

Abstract
Background
High-throughput profiling of circulating metabolites may improve cardiovascular risk prediction over established risk factors.
Methods and Results
We applied quantitative NMR metabolomics to identify biomarkers for incident cardiovascular disease during long-term follow-up. Biomarker discovery was conducted in the FINRISK study (n=7256; 800 events). Replication and incremental risk prediction was assessed in the SABRE study (n=2622; 573 events) and British Women’s Health and Heart Study (n=3563; 368 events). In targeted analyses of 68 lipids and metabolites, 33 measures were associated with incident cardiovascular events at P<0.0007 after adjusting for age, sex, blood pressure, smoking, diabetes and medication. When further adjusting for routine lipids, four metabolites were associated with future cardiovascular events in meta-analyses: higher serum phenylalanine (hazard ratio per standard deviation: 1.18 [95%CI 1.12–1.24]; P=4×10⁻¹⁰) and monounsaturated fatty acid levels (1.17 [1.11–1.24]; P=1×10⁻⁸) were associated with increased cardiovascular risk, while higher omega-6 fatty acids (0.89 [0.84–0.94]; P=6×10⁻⁵) and docosahexaenoic acid levels (0.90 [0.86–0.95]; P=5×10⁻⁵) were associated with lower risk. A risk score incorporating these four biomarkers was derived in FINRISK. Risk prediction estimates were more accurate in the two validation cohorts (relative integrated discrimination improvement 8.8% and 4.3%), albeit discrimination was not enhanced. Risk classification was particularly improved for persons in the 5–10% risk range (net reclassification 27.1% and 15.5%). Biomarker associations were further corroborated with mass spectrometry in FINRISK (n=671) and the Framingham Offspring Study (n=2289).
Conclusions
Metabolite profiling in large prospective cohorts identified phenylalanine, monounsaturated and polyunsaturated fatty acids as biomarkers for cardiovascular risk. This study substantiates the value of high-throughput metabolomics for biomarker discovery and improved risk assessment.
Keywords: biomarkers, metabolomics, risk prediction, amino acids, fatty acids
Cardiovascular disease (CVD) is the leading cause of morbidity and mortality worldwide. Preventive cardiovascular risk assessment relies on established risk factors, including dyslipidemia, hypertension and diabetes; however, the first CVD events often originate from people classified as being at low or intermediate risk based on current risk algorithms.1–4 Detailed profiling of metabolic status, termed metabolite profiling or metabolomics, can provide insights into the molecular mechanisms underlying atherosclerosis.5–9 The quantification of large numbers of circulating metabolites across multiple pathways may also identify metabolic changes prior to the onset of overt disease, and hereby potentially lead to earlier and more accurate identification of individuals at high cardiovascular risk.10–12
Metabolite profiling has successfully been applied to identify biomarkers for the development of type 2 diabetes;13–17 however, few metabolite biomarkers have been consistently associated with future cardiovascular events across multiple studies.6,10–12,18 Technological improvements in sample throughput now allow for metabolite profiling of extensive epidemiological cohorts, rather than case-control settings, to enhance biomarker discovery and replication.8–10,16–22 Serum nuclear magnetic resonance (NMR) metabolomics enables fast, inexpensive and reproducible quantification of circulating lipids and abundant metabolites.8,18,19,23–25 Here, we used a high-throughput NMR platform8 for metabolite profiling in three large population-based cohorts with the aim of identifying circulating biomarkers for cardiovascular risk during long-term follow-up. First, 68 lipid and metabolite measures from multiple pathways were tested for association with incident CVD. This hypothesis-generating approach was taken to discover novel biomarkers, and hereby gain information on disease mechanisms. The ability to improve cardiovascular risk assessment, beyond that achieved by established risk factors, was examined by a risk score including metabolite biomarkers derived in the discovery study and tested in the two validation cohorts.
Analytical confirmation of the identified biomarkers was provided by complementary mass spectrometry and gas chromatography. To examine the coherence across metabolomics methodologies, the NMR-based biomarker associations with CVD were further compared with those obtained from mass spectrometry in the discovery study as well as independently in the Framingham Offspring Study.
METHODS
Study populations
An overview of the study design is shown in Figure 1. This observational study examined metabolite associations with incident cardiovascular events in the population-based FINRISK study as discovery cohort. Metabolite biomarker candidates were replicated in two additional population-based cohorts. All participants provided written informed consent, and study protocols were approved by the local ethical committees. The main endpoint was the first incidence of a major cardiovascular event during follow-up, which includes fatal or nonfatal occurrence of myocardial infarction, ischemic stroke, cardiac revascularization (coronary artery bypass graft surgery or percutaneous transluminal coronary angioplasty), or unstable angina.26 Individuals with prevalent CVD at enrolment were omitted from analyses.
Figure 1.
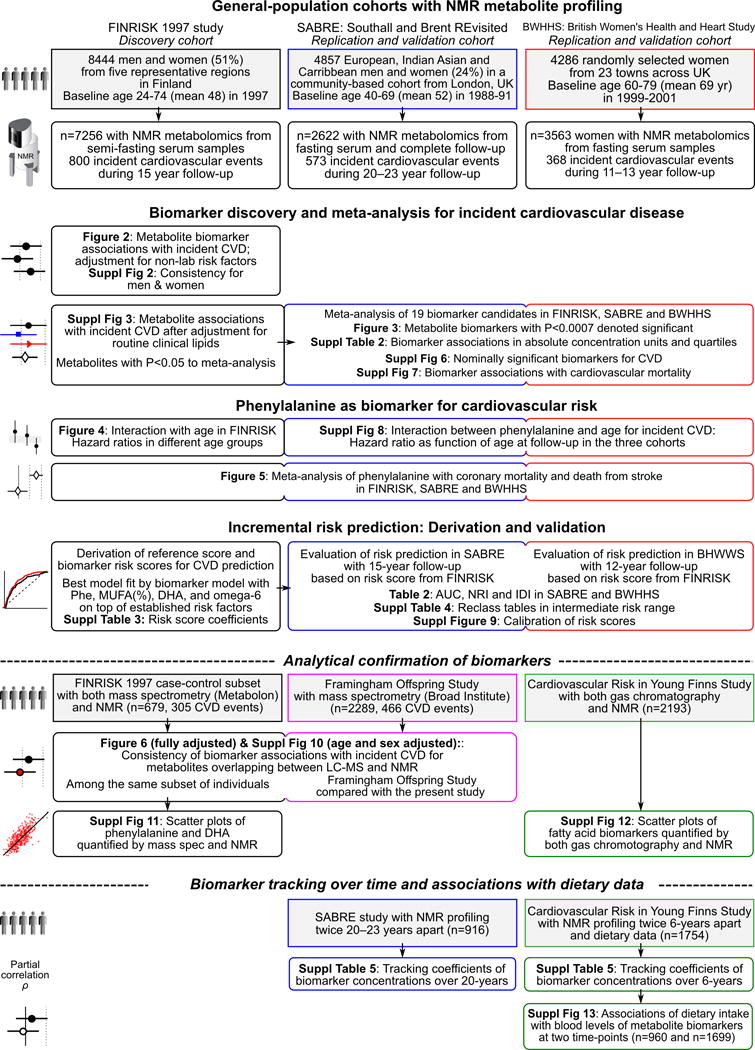
Overview of the study design and statistical analyses conducted.
The FINRISK 1997 study is a general population survey conducted to monitor the health of the Finnish population among persons aged 25–74 at recruitment.22,26,27 In total, 8444 individuals were recruited from five study areas across Finland. Participants completed questionnaires on smoking status, alcohol usage, and medication. Median fasting time was 5h (interquartile range 4–6h). Serum total cholesterol, high-density lipoprotein (HDL) cholesterol, and triglycerides were measured with enzymatic methods. Metabolite profiling by high-throughput NMR was measured during 2012 for 7602 individuals with serum samples collected in 1997 available.22 Pregnant women and persons missing risk factor information (n=83), and individuals with prevalent CVD (n=263) were excluded, leaving 7256 individuals for statistical analyses. Tracking of CVD during follow-up (1997 through December 2011) was enabled by ICD-10 diagnosis codes from the Finnish National Hospital Discharge Register and Causes-of-Death Register. These registers cover all cardiovascular events that have led either to hospitalization or death in Finland. The cardiovascular diagnoses in these registers have been validated.28
Replication of biomarker associations with CVD and improvements in risk prediction were examined in two population-based studies from the UK: fasting serum samples from the Southall and Brent Revisited study (SABRE, n=2622)29 and the British Women’s Heart and Health Study (BWHHS, n=3563)30 were profiled by the same NMR metabolomics platform as used in FINRISK. Detailed information on the study populations is provided in the expanded methods online.
Metabolite quantification
A high-throughput NMR metabolomics platform8 was used for the quantification of 68 lipid and abundant metabolite measures from baseline serum samples of the FINRISK, SABRE, and BWHHS cohorts. All metabolites were measured in a single experimental setup, which allows for the simultaneous quantification of both routine lipids, total lipid concentrations of 14 lipoprotein subclasses, fatty acid composition such as monounsaturated (MUFA) and polyunsaturated fatty acids (PUFA), various glycolysis precursors, ketone bodies and amino acids in absolute concentration units (Supplemental Table 1).8 The targeted metabolite profiling therefore includes both known metabolic risk factors and metabolites from multiple physiological pathways, which have not previously been examined in relation to CVD risk in large population studies. The 68 metabolite measures were assessed for association with incident CVD events using a hypothesis-generating biomarker discovery approach with subsequent replication in two independent cohorts. Spearman’s correlations of the metabolites are shown in Supplemental Figure 1. The NMR metabolomics platform has previously been used in various epidemiological studies9,10,16,17,20–22,31,32, details of the experimentation have been described9,24, and the method has recently been reviewed.8,19
A subset of 679 serum samples from the FINRISK study were additionally profiled with liquid-chromatography mass spectrometry (LC-MS) using the Metabolon platform33 in a case-cohort design for comparison of biomarker associations with incident CVD (expanded methods online). The biomarker associations were further compared with those obtained by LC-MS-based profiling of the Framingham Offspring Study (fifth examination cycle, n=2289 fasting plasma samples), as described in detail previously.13,14 Since several fatty acid biomarkers were not measured by LC-MS, the quantification was analytically confirmed by comparing NMR and gas chromatography in the Cardiovascular Risk in Young Finns Study (YFS, n=2193 fasting serum samples).34 Metabolite profiling data collected at two-time points in YFS9 was further used to examine associations of dietary intake with the circulating biomarkers, and tracking of concentrations within the same individuals over 6 years.
Statistical analyses
All metabolite concentrations were first log-transformed prior to analyses to obtain approximately normal distributions. The metabolite measures were subsequently scaled to standard deviation (SD) units separately for each cohort. Associations with incident CVD were analyzed separately for each metabolite using Cox proportional hazards regression models. In the FINRISK discovery study, metabolite associations were first adjusted for age (as time scale), sex, systolic blood pressure, smoking, prevalent diabetes, antihypertensive treatment, lipid treatment, and geographical region, and subsequently tested with additional adjustment for routine lipid measures (total cholesterol and HDL cholesterol). Metabolites associated with CVD at P<0.05 when adjusting for routine lipids were then analyzed in the two replication cohorts with full adjustment. Analyses in SABRE were further adjusted for ethnicity. Results from individual cohorts were combined using inverse variance-weighted fixed-effect meta-analysis. Metabolites associated with incident CVD at P<0.0007 in meta-analyses were denoted significant biomarkers (Bonferroni correction of P<0.05 accounting for 68 independent tests). Sensitivity analyses were conducted in the FINRISK study with additional exclusion criteria and covariate adjustment. Metabolites that were nominally significant in the meta-analysis (P<0.05) were also tested for association with cardiovascular mortality. Since phenylalanine did not meet the proportional hazards assumptions by the scaled Schoenfeld’s residuals test in the FINRISK study, the association was tested for interaction with age. Phenylalanine was further examined for association with death from coronary heart disease and stroke in meta-analyses.
The potential to improve cardiovascular risk prediction was evaluated by risk scores derived based on established factors with and without the significant metabolite biomarkers in the models. A multi-biomarker risk score was derived in the FINRISK discovery cohort: all combinations of the five significant biomarkers were tested, with established risk factors always included in the model. The model giving rise to the best fit based on the Akaike Information Criterion was selected. The logarithm of the hazard ratios (HRs) in the multivariable model were used as the linear predictor for the biomarker risk score. A reference risk score was also derived in the FINRISK study by using only the conventional risk factors to define the linear predictor. Due to differences in hazard depending on age and geographical regions, the baseline hazard term was derived within each validation cohort. The predictive utility of the biomarker risk score was examined in the two validation cohorts in terms of risk discrimination and reclassification. Prediction estimates were calculated as 15-year absolute risk in SABRE (matching the FINRISK follow-up) and as 12-year absolute risk in BWHHS. Discrimination was assessed by the correlated censored C-statistic approach using jackknife estimation accounting for censoring35 and integrated discrimination improvement (IDI). IDI is the difference of mean predicted probabilities (absolute risk estimates) between the biomarker score and the reference score for events minus the corresponding difference in predicted probabilities for non-events.36,37 IDI thus denotes the average increase in absolute risk estimates by the biomarker risk score for individuals who experienced a CVD event plus the average decrease in absolute risk estimates for those who did not have a CVD event. Since the absolute risk estimates are generally low in the study populations, the relative IDI offers a more intuitive understanding of the average improvement in risk prediction accuracy achieved by the biomarker model.36 Net reclassification improvement (NRI) was examined to determine the extent to which the biomarker risk score reassigned individuals to risk categories that more correctly reflected whether or not they experienced a CVD event during follow-up. NRI was assessed in two risk category ranges: 1) only for individuals in the intermediate risk range of 5–10% based on the reference score (clinical NRI)3,4,38, and 2) for the whole study population using the risk categories <5%, 5–10% and >10% (categorical NRI).36 In addition, we assessed the continuous NRI, which deems any change in predicted risk in the correct direction as appropriate without dependency of risk categories.37 All reclassification metrics were examined separately for events and non-events, and net reclassification denotes the unweighted sum of the two. Model calibration within risk deciles was assessed by Hosmer-Lemeshow goodness-of-fit test.2
Assessment of the consistency of biomarker associations between NMR and mass spectrometry and analytical confirmation of the biomarker quantification is described in the expanded methods online. Details of the biomarker associations with dietary data, and tracking of metabolite concentrations over time can also be found in expanded methods online.
RESULTS
The discovery study included 7256 individuals from the FINRISK general-population cohort, free of CVD at baseline. During a follow-up of 15-years, 800 persons experienced an incident cardiovascular event. Metabolite biomarker candidates for CVD were replicated in the two UK-based population-based cohorts: 2622 individuals from SABRE and 3563 women from BWHHS, with a total of 941 incident cardiovascular events during 12–23 year follow-up. Baseline characteristics and cardiovascular event numbers are summarized in Table 1.
Table 1.
Baseline characteristics of the study populations.
| Clinical characteristics | FINRISK 1997 study (n=7256) |
Southall and Brent REvisted study (SABRE) (n=2622) |
British Women’s Heart and Health Study (BWHHS) (n=3563) |
|---|---|---|---|
| Women (%) | 3678 (51%) | 386 (21%) | 3563 (100%) |
| Location | 6 regions in Finland | London, United Kingdom | 23 British towns |
| Age (years) | 48±13 | 52±7 | 69±5 |
| Body mass index (kg/m2) | 26.6±4.5 | 26.1±3.7 | 27.5±4.9 |
| Systolic blood pressure (mmHg) | 136±20 | 124±18 | 147±25 |
| Total cholesterol (mmol/L) | 5.5±1.1 | 6.0±1.1 | 6.7±1.2 |
| HDL cholesterol (mmol/L) | 1.4±0.4 | 1.3±0.4 | 1.7±0.5 |
| Triglycerides (mmol/L) | 1.5±1.0 | 1.8±1.2 | 1.8±1.0 |
| Lipid-lowering medication (%) | 185 (2.6%) | 5 (0.4%) | 249 (7%) |
| Anti-hypertensive medication (%) | 908 (13%) | 294 (11%) | 1033 (29%) |
| Current smoking (%) | 1736 (24%) | 592 (23%) | 392 (11%) |
| Diabetes prevalence (%) | 393 (5.4%) | 314 (12%) | 356 (10%) |
| Follow-up time (years, range) | 15 | 20–23 | 11–13 |
| Incident cardiovascular events | 800 | 573 | 368 |
Data are number (%) or mean±SD when appropriate. HDL indicates high-density lipoprotein.
Metabolite Associations With Incident Cardiovascular Events
To generate hypotheses on the roles of the metabolite measures in cardiovascular pathophysiology, we first examined each metabolite for association with incident CVD in the FINRISK discovery study with adjustment only for established non-laboratory risk factors: age as time-scale, sex, systolic blood pressure, smoking, prevalent diabetes, geographical region, lipid medication, and antihypertensive treatment.2–4 Associations of the 68 lipid and metabolite measures with incident cardiovascular events are illustrated in Figure 2. HRs are scaled to 1-SD increments in log-transformed metabolite concentrations to facilitate comparison across metabolites. Overall, 33 metabolite measures were associated with future cardiovascular events at P<0.0007 (Bonferroni correction for 68 tests). Prominent associations with increased CVD risk were observed for higher circulating concentrations of aromatic amino acids, glycolysis metabolites, MUFA relative to total fatty acids (MUFA%), glycoprotein acetyls, as well as the lipid concentrations within medium and small very-low-density lipoproteins, intermediate-density lipoprotein and low-density lipoproteins. The strongest inverse associations with cardiovascular risk were found for lower concentrations of lipids within large HDL particles and for HDL cholesterol. Noticeably inverse associations were also observed for ketone bodies as well as ratios of omega-3 and omega-6, relative to total fatty acids. The metabolite associations were broadly consistent between men and women (Supplemental Figure 2).
Figure 2.
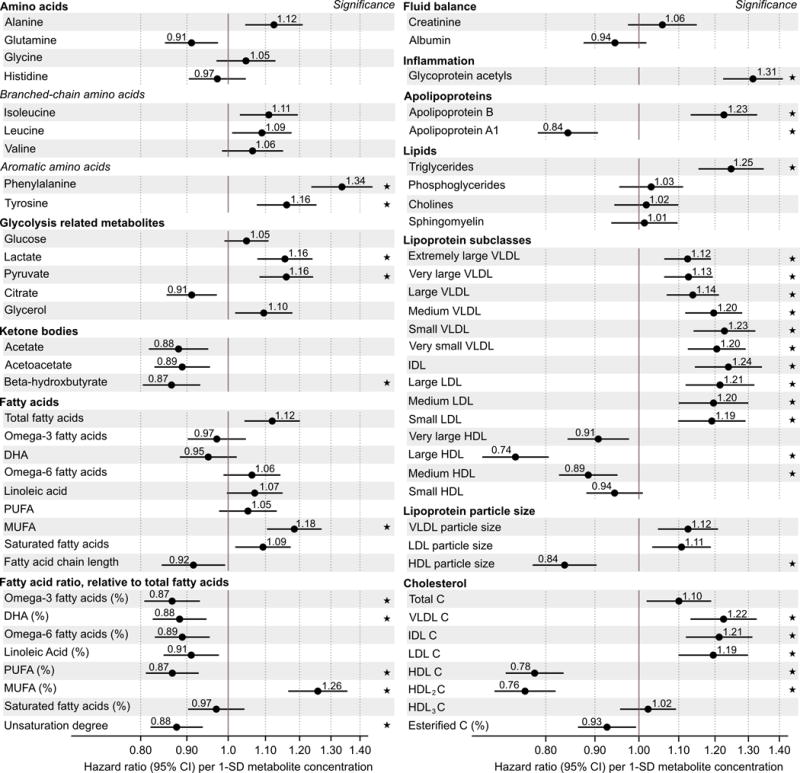
Metabolite associations with future cardiovascular events. Hazard ratios of 68 metabolite measures with incident cardiovascular disease during 15-year follow-up in the FINRISK study (n=7256, 800 events). Hazard ratios are per 1-SD log-transformed metabolite concentration and adjusted for age, sex, blood pressure, smoking, diabetes, geographical region, and cardiovascular medication. Errorbars denote 95% confidence intervals.
★: P<0.0007 (multiple testing correction).
To discover metabolite biomarkers for incident CVD independent of routine lipids, analyses were further adjusted for total- and HDL-cholesterol. In the FINRISK discovery study, 19 metabolite measures were associated with cardiovascular events at P<0.05 when adjusting for routine lipids in the model (Supplemental Figure 3). These biomarker candidates were then further analyzed in the two replication cohorts. In meta-analyses, five metabolite measures were significantly associated with cardiovascular events (P<0.0007; Figure 3). Higher phenylalanine and MUFA% levels were associated with increased cardiovascular event risk. Higher concentrations of omega-6 fatty acids, total concentrations of PUFA, and docosahexaenoic acid (DHA; an omega-3 fatty acid) were associated with lower risk. The biomarker associations with CVD in absolute concentration units (without log-transform and SD-scaling) as well as for upper vs. lower quartiles are listed in Supplemental Table 2. The biomarker associations remained similar with additional subject exclusion criteria and adjustment factors (Supplemental Figure 4). In particular, associations were stronger with further adjustment for serum triglycerides. The magnitudes of the biomarker associations were comparable to those of routine lipid measures (Supplemental Figure 5). Metabolite measures displaying nominal association with incident CVD are listed in Supplemental Figure 6. The metabolite associations were similar or stronger with cardiovascular mortality as outcome (Supplemental Figure 7).
Figure 3.
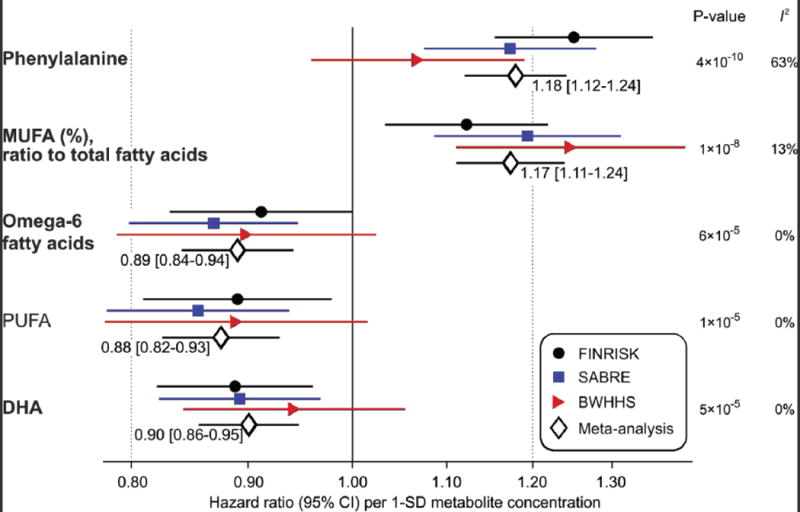
Meta-analysis of metabolite biomarkers for future cardiovascular events. Hazard ratios of biomarkers with incident cardiovascular events in three population-based studies and meta-analysis (n=13441; 1741 events during 12–23 years follow-up). Analyses are adjusted for age, sex, blood pressure, smoking, diabetes, geographical region, cardiovascular medication as well as total and HDL cholesterol. Hazard ratios are per 1-SD log-transformed metabolite concentration and errorbars denote 95% confidence intervals. I2 indicates heterogeneity of meta-analysis. Metabolites associated with cardiovascular events at P<0.0007 (multiple testing correction) are shown here; associations with P<0.05 are listed in Supplemental Figure 6. The four biomarkers highlighted in bold are independent of each other and were included in the risk prediction score.
While the fatty acid measures displayed coherent associations with incident CVD in each cohort, some study heterogeneity was evident in the case of phenylalanine (meta-analysis heterogeneity statistic I2=63%, P=0.07; Figure 3). A potential reason may be the interaction of phenylalanine with age at end of follow-up (P=0.001 in FINRISK), indicating stronger associations of phenylalanine with cardiovascular events at younger age (Figure 4). This interaction, with approximately 1% weaker association per year, was consistent in SABRE but did not replicate in the older population, with narrower age-range (60–79 years at baseline) from BWHHS (Supplemental Figure 8). While phenylalanine was only weakly associated with incident cardiovascular events in BWHHS, the amino acid was consistently associated with death from coronary heart disease across all three cohorts (Figure 5). In contrast, no association was observed for phenylalanine with death from stroke.
Figure 4.
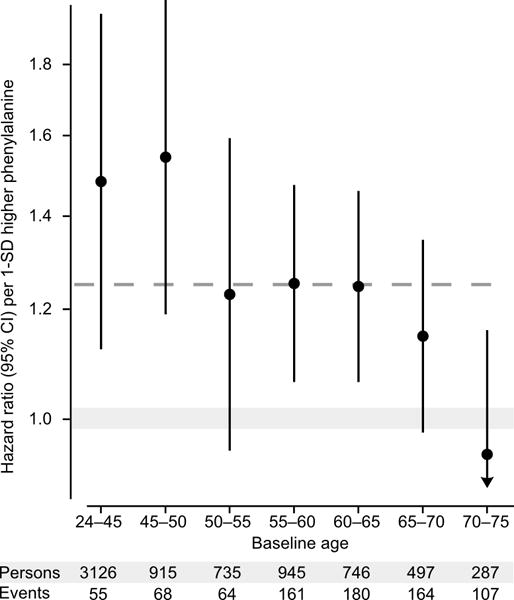
Phenylalanine interaction with age. Hazard ratios of phenylalanine with incident cardiovascular disease in different baseline age groups for the FINRISK study. Analyses were adjusted for age, sex, blood pressure, smoking, diabetes, geographical region, cardiovascular medication as well as total and HDL cholesterol. Hazard ratios are per 1-SD higher log-transformed phenylalanine concentration (approximately corresponding to 14 μmol/L). Errorbars denote 95% confidence intervals. The dashed line denotes the hazard ratio for the full age range. The continuous interaction of phenylalanine with age is shown for all three cohorts in Supplemental Figure 8.
Figure 5.
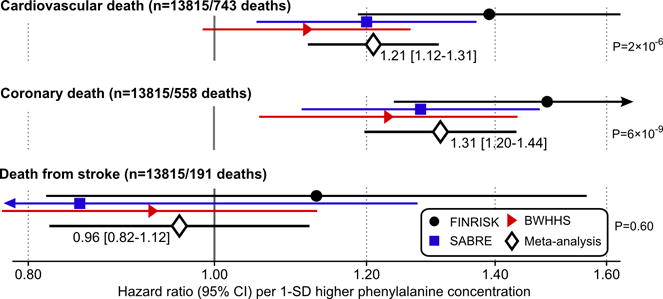
Phenylalanine associations with vascular mortality. Hazard ratios of phenylalanine with death from cardiovascular disease, coronary heart disease and stroke in the three cohorts and meta-analysis (n=13815). Analyses were adjusted for age, sex, blood pressure, smoking, diabetes, geographical region, cardiovascular medication as well as total and HDL cholesterol. Hazard ratios are per 1-SD higher log-transformed phenylalanine concentration (approximately corresponding to 14 μmol/L). Errorbars denote 95% confidence intervals. The numbers of coronary and stroke deaths sum to a slightly higher number than the cardiovascular deaths, since we have considered all causes of death written in the death certificate.
Cardiovascular risk score validation and reclassification
A risk prediction score including metabolite biomarkers was derived in the FINRISK discovery study. The best model fit was obtained by incorporating four out of the five biomarkers (Figure 3) in the score along with established risk factors: phenylalanine, MUFA(%), omega-6 fatty acids, and DHA. Coefficients for calculating the risk prediction scores with and without these biomarkers are listed in Supplemental Table 3. The potential of the biomarker score to improve risk discrimination and reclassification was tested in the SABRE and BWHHS cohorts (Table 2). Although discrimination assessed using the C-statistic was not enhanced, the risk prediction estimates were on average more accurate in the two validation cohorts, both for those who had a CVD event during follow-up (mean improvement in risk prediction accuracy or relative IDI 4.5% for SABRE and 3.2% for BWHHS) and for those who did not (relative IDI 4.4% for SABRE and 1.1% for BWHHS). The model calibration was modest (Supplemental Figure 9), in particular for the older women from BWWHS, where both the reference and biomarker risk scores provided mediocre discrimination. The continuous risk reclassification was improved by the biomarker risk score among individuals who did not experience a cardiovascular event (26.8% for SABRE and 15.6% for BWHHS). The net categorical NRI for the whole study population was 7.6% for SABRE and 5.3% for BWHHS. Most notably, for persons classified in the intermediate risk range (5–10%) based on the reference risk score there was a substantial up-classification by the biomarker score to >10% risk among individuals who actually developed CVD (clinical NRI among events 20.5% for SABRE and 9.8% for BWHHS). Similarly, there was a significant down-classification by the biomarker score to <5% for those who remained free of CVD during follow-up (clinical NRI among non-events 6.6% for SABRE and 5.7% for BWHHS). Reclassification tables for the intermediate risk range are shown in Supplemental Table 4.
Cross-platform biomarker confirmation
To verify the biomarker associations across metabolomics methods, we tested metabolites that were overlapping between the NMR platform and LC-MS for association with incident CVD. In the Framingham Offspring Study (n=2289, 466 events during 12-year follow-up), the biomarker associations were consistent with those obtained from NMR, albeit phenylalanine was weaker (Figure 6). The biomarker associations were also consistent between NMR and LC-MS when compared within the same set of individuals in a case-cohort subset of the FINRISK study (n=679, 305 incident events; Figure 6). Comparisons of biomarker associations across metabolomics platforms with adjustment for age and sex only are shown in Supplemental Figure 10. The correspondence between phenylalanine (Pearson’s correlation r=0.62) and DHA (r=0.77) quantified by NMR and LC-MS is shown in Supplemental Figure 11. MUFA ratio, relative to total fatty acids, and omega-6 fatty acids were not measured by mass spectrometry; quantification of these biomarkers was instead confirmed by comparison with gas chromatography in 2193 participants from the YFS cohort (Supplemental Figure 12). The fatty acid quantification was highly consistent between methods: r=0.92 for MUFA (%), r=0.97 for omega-6 fatty acids and r=0.95 for DHA.
Figure 6.
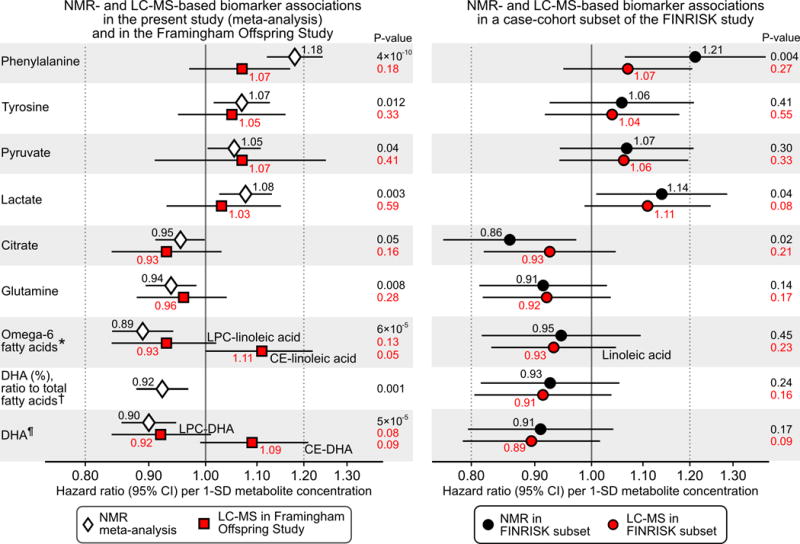
Consistency between NMR and LC-MS for biomarker associations with incident cardiovascular disease. Metabolites overlapping between metabolomics platforms and nominally associated with incident CVD in the present study (P<0.05, Supplemental Figure 6) are shown. Left panel: Biomarker associations with CVD risk observed in the present study based on NMR (white diamonds) compared with those obtained in the Framingham Offspring Study based on LC-MS (red squares; n=2289, 466 events). Right panel: Biomarker associations with CVD risk in a case-cohort subset of the FINRISK study (n=679, 305 events) profiled both by NMR (black circles) and LC-MS (red circles). Hazard ratios are per 1-SD higher log-transformed metabolite concentration. Errorbars denote 95% confidence intervals. All associations were adjusted for age, sex, blood pressure, smoking, diabetes status, geographical region, cardiovascular medication as well as total and HDL cholesterol. LC-MS-based associations were further adjusted for batch. The corresponding age- and sex-adjusted biomarker associations are shown in Supplemental Figure 10. *Associations of omega-6 fatty acids were compared with lysophosphatidylcholine- and cholesterolester-linoleic acid in the Framingham Offspring Study, and with total linoleic acid in the FINRISK subset. † Associations of DHA were compared with lysophosphatidylcholine- and cholesterolester- DHA in the Framingham Offspring Study. ¶ DHA ratio was scaled to the total fatty acid concentration quantified by NMR for both platforms. The DHA ratio was not measured in the Framingham Offspring Study.
Biomarker tracking and dietary associations
The metabolite biomarker levels were consistent over 6-year follow in YFS (tracking correlations 0.41–0.47) and only slightly weaker over 20-year follow-up in the SABRE study (Supplemental Table 5). We further examined associations of dietary intake with the circulating biomarker concentrations at two time-points in YFS. Dietary DHA was robustly associated with serum DHA levels (P<0.0001 at both time-points), whereas dietary measures of phenylalanine, omega-6, and MUFA% were not strongly associated with the corresponding circulating levels (Supplemental Figure 13). Circulating phenylalanine levels were not associated with aspartame in the 652 individuals from FINRISK with data available on this artificial sweetener (Spearman correlation −0.06, P=0.14).
DISCUSSION
Using high-throughput metabolite profiling in three general-population studies, we identified phenylalanine and three measures of fatty acids as independent biomarkers for future cardiovascular events. The circulating metabolites were as strongly predictive of cardiovascular risk as the conventional lipid risk factors, and were markers of CVD onset during more than a decade follow-up. The biomarker associations replicated in independent cohorts with varying baseline characteristics including age and ethnicity, and were consistent across different metabolite profiling platforms. Whereas higher circulating levels of DHA and omega-6 fatty acids have been linked with lower CVD event risk in some studies,39–41 the blood levels of MUFA and phenylalanine have not previously been associated with higher risk for future CVD in large epidemiological studies. These results demonstrate the power of detailed metabolite profiling for biomarker discovery in large prospective cohorts, which can yield improved molecular understanding of disease mechanisms. In combination, the four biomarkers indicated improved cardiovascular risk assessment for people in the intermediate risk range, where clinical decision making remains ambiguous.
Phenylalanine is an essential aromatic amino acid, and precursor for tyrosine and dopamine-related neurotransmitters. The mechanisms by which blood levels of phenylalanine relate to cardiovascular risk remain unknown. Phenylalanine has been associated with insulin resistance and the risk for diabetes;13–16 however, the association with CVD remained similar after adjustment for glucose and insulin. A small case-control study using LC-MS suggested an amino acid score including phenylalanine to be associated with CVD.42 Although phenylalanine alone was not statistically significant in that study, the HR (1.25; P=0.11) matched the magnitude observed in the present study. The ratio of phenylalanine to tyrosine has been suggested as a proxy of phenylalanine hydroxylase activity;43 however, this ratio was not associated with CVD event risk in the present study (HR=1.03; P=0.47). Phenylalanine was more strongly associated with CVD before the age of 60. This amino acid therefore represents a promising biomarker for early identification of cardiovascular risk.
Dietary recommendations support MUFA intake replacing saturated fatty acid to lower cardiovascular risk.44 In this study, high blood levels of MUFAs, relative to total fatty acids, were associated with higher cardiovascular risk. Similar results have been found for the risk of diabetes.17 However, circulating MUFA concentrations do not directly reflect dietary intake, since MUFAs constitute the major fatty acids stored in adipose tissue and can be synthesized de novo. A potential explanation for the positive association with CVD may be that the MUFA levels originate from desaturation of dietary saturated fatty acids.17,45 As such, MUFA% could potentially act as a blood biomarker reflecting long-term dietary quality.
The role of PUFAs in CVD pathogenesis remains controversial.39–41,46–49 Intervention trials do not suggest risk reduction by omega-3 supplementation.46,47 Trials on omega-6 fatty acid consumption are less clear, as most studies evaluate effects of replacing saturated fatty acids.48,49 We observed consistent associations of higher blood levels of both DHA and omega-6 fatty acids with lower CVD risk, in agreement with some prospective studies on circulating PUFAs.39–41 These findings contrast results on the risk for incident diabetes, where only omega-6 fatty acids display inverse associations.17 Circulating PUFAs might serve as more reliable markers of therapeutic target and cardiovascular risk than conventional dietary assssments.10,39–41 Regardless of the therapeutic benefit, DHA and omega-6 fatty acid quantification could potentially augment risk assessment on top of established risk factors.
Individual biomarkers rarely improve risk prediction.1 The biomarkers identified here were quantified by a single analytical platform, which also features measurement of routine lipid risk factors.8,9,20,24,31,32 The combination of four biomarkers yielded improvements in risk prediction accuracy when evaluated in two independent cohorts. The average improvement in risk prediction accuracy (relative IDI) was ~4.5% in SABRE for both individuals who developed CVD and those who did not, and 1–3% in BWHHS. This modest improvement might relate to differences in age and gender distributions, population sampling, ethnicity, and geographical region between derivation and validation cohorts. The poor model calibration and lower reclassification rates in BWHHS may potentially be explained by the female-only composition as well as the higher baseline age of this study cohort. Novel biomarkers for risk prediction are primarily needed for persons in the intermediate risk range, for whom treatment decisions are most challenging.1–4 The four biomarkers proved particularly helpful in correctly reclassifying individuals in the 5–10% risk grey zone (net 27% and 15% in the two validation cohorts). Although there are no widely accepted definitions of intermediate risk for the composite CVD endpoint studied here, also the continuous reclassification metrics were improved in both validation studies. Nonetheless, additional investigations should further evaluate the clinical utility of these biomarkers. In particular, metabolite profiling in clinical trials could inform on the feasibility of using the biomarkers to improve cardiovascular risk assessment. The throughput of the metabolomics platform employed now allows for profiling all samples collected in even the largest CVD prevention trials.8 This would elucidate the role of detailed metabolite profiling in high-risk individuals and patients with prevalent disease, and address the value for risk assessment among patients already on statin medication.
Our study has several strengths, including the large number of individuals studied, biomarker replication, assessment of risk prediction in independent cohorts, and confirmation of biomarker associations across metabolomics methodologies. Some limitations should also be considered. First, the metabolite coverage by NMR is limited compared to that afforded by mass spectrometry, which might further improve risk prediction.5,12 Second, blood sample collections were done before the widespread use of lipid-lowering medication and the benefit of modern preventive treatment based on risk classification by the highlighted biomarkers remains uncertain.
Conclusion
Using NMR metabolomics profiling of 13441 individuals with long-term follow-up, we have identified phenylalanine and MUFA as novel biomarkers of higher CVD event risk, and corroborated omega-6 fatty acids and DHA as biomarkers of lower CVD risk. The combination of the four independent biomarkers indicated improved prediction of cardiovascular risk for persons classified with intermediate risk based on established risk factors. Further studies are needed to elucidate the biological mechanisms underlying the associations with CVD, and to clarify the clinical utility of these biomarkers to guide cardiovascular risk assessment. Overall, our investigation underscores the value of high-throughput metabolite profiling in discovery of new and emerging biomarkers for CVD risk and their potentially cost-effective use for cardiovascular prevention.
Table 2.
Discrimination and reclassification of cardiovascular risk in validation cohorts with and without metabolic biomarkers in the risk prediction score.
| Prediction model | C-statistic [95% CI] |
Model calibra-tion | Reclassi-fication | Clinical NRI* [95% CI] |
Categorical NRI¶ [95% CI] |
Continuous NRI [95% CI] |
IDI [95% CI] |
Relative IDI [95% CI] |
|---|---|---|---|---|---|---|---|---|
| Southall and Brent REvisited study (SABRE, n=2478); 379 events during 15-year follow-up | ||||||||
| Reference risk score | 0.712 [0.695–0.745] |
P=0.14 | CVD events | 20.5% [3.2–37.8%] P=0.02 |
−2.4% [−5.3–0.59%] P=0.12 |
−3.7% [−13.7–6.4%] P=0.47 |
0.95% [0.17–1.72%] P=0.02 |
4.5% [1.3–7.7%] P=0.006 |
| Biomarker risk score | 0.720 [0.687–0.738] P=0.18† |
P=0.03 | Non-events | 6.6% [1.7–11.5%] P=0.008 |
10.0% [8.0–12.0%] P=2×10⁻²² |
26.8% [22.5–31.1%] P=1×10⁻³⁴ |
0.43% [0.20–0.65%] P=0.0002 |
4.4% [3.0–5.7%] P=8×10⁻¹¹ |
| Net | 27.1% [9.1–45.0%] P=0.003 |
7.6% [4.1–11.2%] P=2×10⁻⁵ |
23.1% [12.2–34.0%] P=3×10⁻⁵ |
1.37% [0.57–2.2%] P=0.008 |
8.8% [5.4–12.3%] P=6×10⁻⁷ |
|||
| British Women’s Health and Heart Study (BWHHS, n=3348); 354 events during 12-year follow-up | ||||||||
| Reference risk score | 0.665 [0.636–0.695] |
P=0.02 | CVD events | 9.8% [−1.3–20.9%] P=0.08 |
0.28% [−3.7–4.3%] P=0.89 |
−6.8% [−17.2–3.6%] P=0.20 |
0.64% [0.12–1.17%] P=0.02 |
3.2% [0.2–6.2%] P=0.04 |
| Biomarker risk score | 0.666 [0.637–0.694] P=0.97† |
P=0.0003 | Non- events | 5.7% [2.4–9.0%] P=0.0007 |
5.0% [3.4–6.6%] P=2×10⁻⁹ |
15.6% [12.1–19.2%] P=3×10⁻¹⁸ |
−0.004% [−0.11–0.12%] P=0.94 |
1.1% [0.12–2.1%] P=0.03 |
| Net | 15.5% [3.9–27.0%] P=0.009 |
5.3% [0.94–9.6%] P=0.02 |
8.9% [−2.1–19.8%] P=0.11 |
0.64% [0.10–1.17%] P=0.02 |
4.3% [1.2–7.5%] P=0.007 |
|||
Risk assessment was evaluated in the SABRE (15-year absolute risk) and BWHHS (12-year absolute risk) validation cohorts based on the risk prediction scores derived in the FINRISK study (Supplemental Table 3). The reference risk score included age, sex, smoking, diabetes, lipid and blood pressure treatment, blood pressure, total cholesterol and HDL cholesterol. The biomarker risk score additionally included log-transformed phenylalanine, the ratio of MUFA to total fatty acids, omega-6 fatty acids, and DHA.
P-value for difference from reference model.
Reclassification of individuals in the 5–10% intermediate risk range based on the reference risk score (650 in SABRE and 1288 in BWHHS) to risk classes <5% and >10%. Reclassification tables for this intermediate risk range are shown in Supplemental Table 4.
Reclassification among all study participants to risk classes <5%, 5–10%, and >10%.
Interpretations of NRI (net reclassification improvement) and IDI (Integrated discrimination improvement) metrics are explained in the Methods section.
Calibration of the models within risk deciles is shown in Supplemental Figure 9.
Acknowledgments
Funding Sources: This study was supported by the Academy of Finland (139635, 137870, 250422, 251217, 266199), the European Commission Seventh Framework Programme (BioSHaRE 261433), the Sigrid Juselius Foundation, the Yrjö Jahnsson Foundation, the Emil Aaltonen Foundation, the Paavo Nurmi Foundation, the Finnish Foundation for Cardiovascular Research, the Medical Research Fund of Tampere, the UK Medical Research Council via the University of Bristol Integrative Epidemiology Unit (IEU; MC_UU_12013/5), and Strategic Research Funding from the University of Oulu, Finland. The Wellcome Trust (WT082464AIA), British Heart Foundation (SP/07/001/23603) and Diabetes UK(13/0004774) support the SABRE Study. The British Women’s Heart and Health Study was funded by the British Heart Foundation and UK Department of Health Policy Research Programme with metabolomics data funded by the UK Medical Research Council (G1000427). Metabolomics in the Framingham offspring study was supported by the United States National Institutes of Health grants R01 DK 081572 and R01 HL98280. Surveillance of CVD in the Framingham Heart Study is supported by N01-HC-25195 (from the NHLBI).
Footnotes
Journal Subject Codes: [33] Other diagnostic testing, [135] Risk factors, [140] Energy metabolism, [8] Epidemiology, [121] Primary prevention
Disclosures: PW, AJK, PS, and MAK are shareholders of Brainshake Ltd, a startup company offering NMR based metabolite profiling. TT, QW, MT, and JK report employment (minor compensation) for Brainshake Ltd. No other authors reported disclosures.
References
- 1.Wang TJ. Assessing the role of circulating, genetic, and imaging biomarkers in cardiovascular risk prediction. Circulation. 2011;123:551–565. doi: 10.1161/CIRCULATIONAHA.109.912568. [DOI] [PMC free article] [PubMed] [Google Scholar]
- 2.Lloyd-Jones DM. Cardiovascular risk prediction: basic concepts, current status, and future directions. Circulation. 2010;121:1768–1777. doi: 10.1161/CIRCULATIONAHA.109.849166. [DOI] [PubMed] [Google Scholar]
- 3.Stone NJ, Robinson JG, Lichtenstein AH, Bairey Merz CN, Blum CB, Eckel RH, Goldberg AC, Gordon D, Levy D, Lloyd-Jones DM, McBride P, Schwartz JS, Shero ST, Smith SC, Jr, Watson K, Wilson PW, Eddleman KM, Jarrett NM, LaBresh K, Nevo L, Wnek J, Anderson JL, Halperin JL, Albert NM, Bozkurt B, Brindis RG, Curtis LH, DeMets D, Hochman JS, Kovacs RJ, Ohman EM, Pressler SJ, Sellke FW, Shen WK, Smith SC, Jr, Tomaselli GF. 2013 ACC/AHA guideline on the treatment of blood cholesterol to reduce atherosclerotic cardiovascular risk in adults: a report of the American College of Cardiology/American Heart Association Task Force on Practice Guidelines. Circulation. 2014;129(25 Suppl 2):S1–45. doi: 10.1161/01.cir.0000437738.63853.7a. [DOI] [PubMed] [Google Scholar]
- 4.NICE clinical guideline 181. Lipid modification: cardiovascular risk assessment and the modification of blood lipids for the primary and secondary prevention of cardiovascular disease. 2014 Jul; guidance.nice.org.uk/cg181. [PubMed]
- 5.Quehenberger O, Dennis EA. The human plasma lipidome. N Engl J Med. 2011;365:1812–1823. doi: 10.1056/NEJMra1104901. [DOI] [PMC free article] [PubMed] [Google Scholar]
- 6.Shah SH, Kraus WE, Newgard CB. Metabolomic profiling for the identification of novel biomarkers and mechanisms related to common cardiovascular diseases: form and function. Circulation. 2012;126:1110–1120. doi: 10.1161/CIRCULATIONAHA.111.060368. [DOI] [PMC free article] [PubMed] [Google Scholar]
- 7.Wang Z, Klipfell E, Bennett BJ, Koeth R, Levison BS, Dugar B, Feldstein AE, Britt EB, Fu X, Chung YM, Wu Y, Schauer P, Smith JD, Allayee H, Tang WH, DiDonato JA, Lusis AJ, Hazen SL. Gut flora metabolism of phosphatidylcholine promotes cardiovascular disease. Nature. 2011;472:57–63. doi: 10.1038/nature09922. [DOI] [PMC free article] [PubMed] [Google Scholar]
- 8.Soininen P, Kangas AJ, Würtz P, Suna T, Ala-Korpela M. Quantitative serum nuclear magnetic resonance metabolomics in cardiovascular epidemiology and genetics. Circ Cardiov Genet. 2015 doi: 10.1161/CIRCGENETICS.114.000216. [DOI] [PubMed] [Google Scholar]
- 9.Inouye M, Kettunen J, Soininen P, Silander K, Ripatti S, Kumpula LS, Hämäläinen E, Jousilahti P, Kangas AJ, Männistö S, Savolainen MJ, Jula A, Leiviskä J, Palotie A, Salomaa V, Perola M, Ala-Korpela M, Peltonen L. Metabonomic, transcriptomic, and genomic variation of a population cohort. Mol Syst Biol. 2010;6:1–10. doi: 10.1038/msb.2010.93. [DOI] [PMC free article] [PubMed] [Google Scholar]
- 10.Würtz P, Raiko JR, Magnussen CG, Soininen P, Kangas AJ, Tynkkynen T, Thomson R, Laatikainen R, Savolainen MJ, Laurikka J, Kuukasjärvi P, Tarkka M, Karhunen PJ, Jula A, Viikari JS, Kähönen M, Lehtimäki T, Juonala M, Ala-Korpela M, Raitakari OT. High-throughput quantification of circulating metabolites improves prediction of subclinical atherosclerosis. Eur Heart J. 2012;33:2307–2316. doi: 10.1093/eurheartj/ehs020. [DOI] [PubMed] [Google Scholar]
- 11.Tang WH, Wang Z, Levison BS, Koeth RA, Britt EB, Fu X, Wu Y, Hazen SL. Intestinal microbial metabolism of phosphatidylcholine and cardiovascular risk. N Engl J Med. 2013;368:1575–1584. doi: 10.1056/NEJMoa1109400. [DOI] [PMC free article] [PubMed] [Google Scholar]
- 12.Stegemann C, Pechlaner R, Willeit P, Langley SR, Mangino M, Mayr U, Menni C, Moayyeri A, Santer P, Rungger G, Spector TD, Willeit J, Kiechl S, Mayr M. Lipidomics profiling and risk of cardiovascular disease in the prospective population-based Bruneck study. Circulation. 2014;129:1821–1831. doi: 10.1161/CIRCULATIONAHA.113.002500. [DOI] [PubMed] [Google Scholar]
- 13.Wang TJ, Larson MG, Vasan RS, Cheng S, Rhee EP, McCabe E, Lewis GD, Fox CS, Jacques PF, Fernandez C, O’Donnell CJ, Carr SA, Mootha VK, Florez JC, Souza A, Melander O, Clish CB, Gerszten RE. Metabolite profiles and the risk of developing diabetes. Nat Med. 2011;17:448–453. doi: 10.1038/nm.2307. [DOI] [PMC free article] [PubMed] [Google Scholar]
- 14.Rhee EP, Cheng S, Larson MG, Walford GA, Lewis GD, McCabe E, Yang E, Farrell L, Fox CS, O’Donnell CJ, Carr SA, Vasan RS, Florez JC, Clish CB, Wang TJ, Gerszten RE. Lipid profiling identifies a triacylglycerol signature of insulin resistance and improves diabetes prediction in humans. J Clin Invest. 2011;121:1402–1411. doi: 10.1172/JCI44442. [DOI] [PMC free article] [PubMed] [Google Scholar]
- 15.Floegel A, Stefan N, Yu Z, Mühlenbruch K, Drogan D, Joost HG, Fritsche A, Häring HU, Hrabě de Angelis M, Peters A, Roden M, Prehn C, Wang-Sattler R, Illig T, Schulze MB, Adamski J, Boeing H, Pischon T. Identification of serum metabolites associated with risk of type 2 diabetes using a targeted metabolomic approach. Diabetes. 2013;62:639–648. doi: 10.2337/db12-0495. [DOI] [PMC free article] [PubMed] [Google Scholar]
- 16.Stančáková A, Civelek M, Saleem NK, Soininen P, Kangas AJ, Cederberg H, Paananen J, Pihlajamäki J, Bonnycastle LL, Morken MA, Boehnke M, Pajukanta P, Lusis AJ, Collins FS, Kuusisto J, Ala-Korpela M, Laakso M. Hyperglycemia and a common variant of GCKR are associated with the levels of eight amino acids in 9,369 Finnish men. Diabetes. 2012;61:1895–1902. doi: 10.2337/db11-1378. [DOI] [PMC free article] [PubMed] [Google Scholar]
- 17.Mahendran Y, Cederberg H, Vangipurapu J, Kangas AJ, Soininen P, Kuusisto J, Uusitupa M, Ala-Korpela M, Laakso M. Glycerol and fatty acids in serum predict the development of hyperglycemia and type 2 diabetes in Finnish men. Diabetes Care. 2013;36:3732–3738. doi: 10.2337/dc13-0800. [DOI] [PMC free article] [PubMed] [Google Scholar]
- 18.Roberts LD, Gerszten RE. Toward new biomarkers of cardiometabolic diseases. Cell Metab. 2013;18:43–50. doi: 10.1016/j.cmet.2013.05.009. [DOI] [PMC free article] [PubMed] [Google Scholar]
- 19.Rankin NJ, Preiss D, Welsh P, Burgess KEV, Nelson SE, Lawlor DA, Sattar N. The emergence of proton nuclear magnetic resonance metabolomics in the cardiovascular arena as viewed from a clinical perspective. Atherosclerosis. 2014;237:287–300. doi: 10.1016/j.atherosclerosis.2014.09.024. [DOI] [PMC free article] [PubMed] [Google Scholar]
- 20.Kettunen J, Tukiainen T, Sarin AP, Ortega-Alonso A, Tikkanen E, Lyytikäinen LP, Kangas AJ, Soininen P, Würtz P, Silander K, Dick DM, Rose RJ, Savolainen MJ, Viikari J, Kähönen M, Lehtimäki T, Pietiläinen KH, Inouye M, McCarthy MI, Jula A, Eriksson J, Raitakari OT, Salomaa V, Kaprio J, Järvelin MR, Peltonen L, Perola M, Freimer NB, Ala-Korpela M, Palotie A, Ripatti S. Genome-wide association study identifies multiple loci influencing human serum metabolite levels. Nat Genet. 2012;44:269–76. doi: 10.1038/ng.1073. [DOI] [PMC free article] [PubMed] [Google Scholar]
- 21.Auro K, Joensuu A, Fischer K, Kettunen J, Salo P, Mattsson H, Niironen M, Kaprio J, Eriksson JG, Lehtimäki T, Raitakari O, Jula A, Tiitinen A, Jauhiainen M, Soininen P, Kangas AJ, Kähönen M, Havulinna AS, Ala-Korpela M, Salomaa V, Metspalu A, Perola M. A metabolic view on menopause and aging. Nat Commun. 2014;5:4708. doi: 10.1038/ncomms5708. [DOI] [PubMed] [Google Scholar]
- 22.Fischer K, Kettunen J, Würtz P, Haller T, Havulinna AS, Kangas AJ, Soininen P, Esko T, Tammesoo ML, Mägi R, Smit S, Palotie A, Ripatti S, Salomaa V, Ala-Korpela M, Perola M, Metspalu A. Biomarker profiling by nuclear magnetic resonance spectroscopy for the prediction of all-cause mortality: an observational study of 17,345 persons. PLoS Med. 2014;11:e1001606. doi: 10.1371/journal.pmed.1001606. [DOI] [PMC free article] [PubMed] [Google Scholar]
- 23.Ala-Korpela M, Kangas AJ, Soininen P. Quantitative high-throughput metabolomics: a new era in epidemiology and genetics. Genome Med. 2012;4:36. doi: 10.1186/gm335. [DOI] [PMC free article] [PubMed] [Google Scholar]
- 24.Soininen P, Kangas AJ, Würtz P, Tukiainen T, Tynkkynen T, Laatikainen R, Järvelin MR, Kähönen M, Lehtimäki T, Viikari J, Raitakari OT, Savolainen MJ, Ala-Korpela M. High-throughput serum NMR metabonomics for cost-effective holistic studies on systemic metabolism. Analyst. 2009;134:1781–1785. doi: 10.1039/b910205a. [DOI] [PubMed] [Google Scholar]
- 25.Griffin JL, Atherton H, Shockcor J, Atzori L. Metabolomics as a tool for cardiac research. Nat Rev Cardio. 2011;8:630–643. doi: 10.1038/nrcardio.2011.138. [DOI] [PubMed] [Google Scholar]
- 26.Blankenberg S, Zeller T, Saarela O, Havulinna AS, Kee F, Tunstall-Pedoe H, Kuulasmaa K, Yarnell J, Schnabel RB, Wild PS, Münzel TF, Lackner KJ, Tiret L, Evans A, Salomaa V. Contribution of 30 biomarkers to 10-year cardiovascular risk estimation in 2 population cohorts. Circulation. 2010;121:2388–2397. doi: 10.1161/CIRCULATIONAHA.109.901413. [DOI] [PubMed] [Google Scholar]
- 27.Vartiainen E, Laatikainen T, Peltonen M, Juolevi A, Männisto S, Sundvall J, Jousilahti P, Salomaa V, Valsta L, Puska P. Thirty-five-year trends in cardiovascular risk factors in Finland. Int J Epidemiol. 2010;39:504–518. doi: 10.1093/ije/dyp330. [DOI] [PubMed] [Google Scholar]
- 28.Pajunen P, Koukkunen H, Ketonen M, Jerkkola T, Immonen-Räihä P, Kärjä-Koskenkari P, Mähönen M, Niemelä M, Kuulasmaa K, Palomäki P, Mustonen J, Lehtonen A, Arstila M, Vuorenmaa T, Lehto S, Miettinen H, Torppa J, Tuomilehto J, Kesäniemi YA, Pyörälä K, Salomaa V. The validity of the Finnish Hospital Discharge Register and Causes of Death Register data on coronary heart disease. Eur J Cardiovasc Prev Rehabil. 2005;12:132–137. doi: 10.1097/00149831-200504000-00007. [DOI] [PubMed] [Google Scholar]
- 29.Tillin T, Hughes AD, Mayet J, Whincup P, Sattar N, Forouhi NG, McKeigue PM, Chaturvedi N. The relationship between metabolic riskfactors and incident cardiovascular disease in Europeans, South Asians, and African Caribbeans. J Am Coll Cardiol. 2013;61:1777–1786. doi: 10.1016/j.jacc.2012.12.046. [DOI] [PMC free article] [PubMed] [Google Scholar]
- 30.Lawlor DA, Bedford C, Taylor M, Ebrahim S. Geographical variation in cardiovascular disease, risk factors, and their control in older women: British Women’s Heart and Health Study. J Epidemiol Community Health. 2003;57:134–140. doi: 10.1136/jech.57.2.134. [DOI] [PMC free article] [PubMed] [Google Scholar]
- 31.Kujala UM, Mäkinen VP, Heinonen I, Soininen P, Kangas AJ, Leskinen TH, Rahkila P, Würtz P, Kovanen V, Cheng S, Sipilä S, Hirvensalo M, Telama R, Tammelin T, Savolainen MJ, Pouta A, O’Reilly PF, Mäntyselkä P, Viikari J, Kähönen M, Lehtimäki T, Elliott P, Vanhala MJ, Raitakari OT, Järvelin MR, Kaprio J, Kainulainen H, Ala-Korpela M. Long-term leisure-time physical activity and serum metabolome. Circulation. 2012;127:340–348. doi: 10.1161/CIRCULATIONAHA.112.105551. [DOI] [PubMed] [Google Scholar]
- 32.Würtz P, Wang Q, Kangas AJ, Richmond RC, Skarp J, Tiainen M, Tynkkynen T, Soininen P, Havulinna AS, Kaakkinen M, Viikari JS, Savolainen M, Kähönen M, Lehtimäki T, Männistö S, Blankenberg S, Zeller T, Laitinen J, Pouta A, Mäntyselkä P, Vanhala M, Elliott P, Pietiläinen KH, Ripatti S, Salomaa V, Raitakari OT, Järvelin MR, Davey Smith D, Ala-Korpela M. Metabolic signatures of adiposity: Mendelian randomization analysis and effects of weight change. PLOS Med. 2014;11:e1001765. doi: 10.1371/journal.pmed.1001765. [DOI] [PMC free article] [PubMed] [Google Scholar]
- 33.Shin SY, Fauman EB, Petersen AK, Krumsiek J, Santos R, Huang J, Arnold M, Erte I, Forgetta V, Yang TP, Walter K, Menni C, Chen L, Vasquez L, Valdes AM, Hyde CL, Wang V, Ziemek D, Roberts P, Xi L, Grundberg E, Multiple Tissue Human Expression Resource (MuTHER) Consortium. Waldenberger M, Richards JB, Mohney RP, Milburn MV, John SL, Trimmer J, Theis FJ, Overington JP, Suhre K, Brosnan MJ, Gieger C, Kastenmüller G, Spector TD, Soranzo N. An atlas of genetic influences on human blood metabolites. Nat Genet. 2014;46:543–550. doi: 10.1038/ng.2982. [DOI] [PMC free article] [PubMed] [Google Scholar]
- 34.Kaikkonen JE, Kresanov P, Ahotupa M, Jula A, Mikkilä V, Viikari JS, Kähönen M, Lehtimäki T, Raitakari OT. High serum n6 fatty acid proportion is associated with lowered LDL oxidation and inflammation: the Cardiovascular Risk in Young Finns Study. Free Radic Res. 2014;48:420–426. doi: 10.3109/10715762.2014.883071. [DOI] [PubMed] [Google Scholar]
- 35.Antolini L, Nam BH, D’Agostico RB. Inference on correlated discrimination measures in survival analysis: a nonparametric approach. Commun Statist Theory Meth. 2004;33:2117–2135. [Google Scholar]
- 36.Pencina MJ, D’Agostino RB, Sr, D’Agostino RB, Jr, Vasan RS. Evaluating the added predictive ability of a new marker: from area under the ROC curve to reclassification and beyond. Stat Med. 2008;27:157–172. doi: 10.1002/sim.2929. [DOI] [PubMed] [Google Scholar]
- 37.Pencina MJ, D’Agostino RB, Sr, Steyerberg EW. Extensions of net reclassification improvement calculations to measure usefulness of new biomarkers. Stat Med. 2011;30:11–21. doi: 10.1002/sim.4085. [DOI] [PMC free article] [PubMed] [Google Scholar]
- 38.Ripatti S, Tikkanen E, Orho-Melander M, Havulinna AS, Silander K, Sharma A, Guiducci C, Perola M, Jula A, Sinisalo J, Lokki ML, Nieminen MS, Melander O, Salomaa V, Peltonen L, Kathiresan S. A multilocus genetic risk score for coronary heart disease: case-control and prospective cohort analyses. Lancet. 2010;376:1393–1400. doi: 10.1016/S0140-6736(10)61267-6. [DOI] [PMC free article] [PubMed] [Google Scholar]
- 39.Superko HR, Superko SM, Nasir K, Agatston A, Garrett BC. Omega-3 fatty acid blood levels: clinical significance and controversy. Circulation. 2013;128:2154–2161. doi: 10.1161/CIRCULATIONAHA.113.002731. [DOI] [PubMed] [Google Scholar]
- 40.Chowdhury R, Warnakula S, Kunutsor S, Crowe F, Ward HA, Johnson L, Franco OH, Butterworth AS, Forouhi NG, Thompson SG, Khaw KT, Mozaffarian D, Danesh J, Di Angelantonio E. Association of dietary, circulating, and supplement fatty acids with coronary risk: a systematic review and meta-analysis. Ann Intern Med. 2014;160:398–406. doi: 10.7326/M13-1788. [DOI] [PubMed] [Google Scholar]
- 41.Wu JH, Lemaitre RN, King IB, Song X, Psaty BM, Siscovick DS, Mozaffarian D. Circulating omega-6 polyunsaturated Fatty acids and total and cause-specific mortality: the cardiovascular health study. Circulation. 2014;130:1245–53. doi: 10.1161/CIRCULATIONAHA.114.011590. [DOI] [PMC free article] [PubMed] [Google Scholar]
- 42.Magnusson M, Lewis GD, Ericson U, Orho-Melander M, Hedblad B, Engström G, Ostling G, Clish C, Wang TJ, Gerszten RE, Melander O. A diabetes-predictive amino acid score and future cardiovascular disease. Eur Heart J. 2013;34:1982–1989. doi: 10.1093/eurheartj/ehs424. [DOI] [PMC free article] [PubMed] [Google Scholar]
- 43.Murr C, Grammer TB, Meinitzer A, Kleber ME, März W, Fuchs D. Immune activation and inflammation in patients with cardiovascular disease are associated with higher phenylalanine to tyrosine ratios: the ludwigshafen risk and cardiovascular health study. J Amino Acids. 2014;2014:783730. doi: 10.1155/2014/783730. [DOI] [PMC free article] [PubMed] [Google Scholar]
- 44.Kris-Etherton PM. AHA Science Advisory. Monounsaturated fatty acids and risk of cardiovascular disease. American Heart Association. Nutrition Committee. Circulation. 1999;100:1253–1258. doi: 10.1161/01.cir.100.11.1253. [DOI] [PubMed] [Google Scholar]
- 45.Liu J, Cinar R, Xiong K, Godlewski G, Jourdan T, Lin Y, Ntambi JM, Kunos G. Monounsaturated fatty acids generated via stearoyl CoA desaturase-1 are endogenous inhibitors of fatty acid amide hydrolase. Proc Natl Acad Sci U S A. 2013;110:18832–18837. doi: 10.1073/pnas.1309469110. [DOI] [PMC free article] [PubMed] [Google Scholar]
- 46.Rizos EC, Ntzani EE, Bika E, Kostapanos MS, Elisaf MS. Association between omega-3 fatty acid supplementation and risk of major cardiovascular disease events: a systematic review and meta-analysis. JAMA. 2012;308:1024–1033. doi: 10.1001/2012.jama.11374. [DOI] [PubMed] [Google Scholar]
- 47.Risk and Prevention Study Collaborative Group n-3 fatty acids in patients with multiple cardiovascular risk factors. N Engl J Med. 2013;368:1800–1808. doi: 10.1056/NEJMoa1205409. [DOI] [PubMed] [Google Scholar]
- 48.Mozaffarian D, Micha R, Wallace S. Effects on coronary heart disease of increasing polyunsaturated fat in place of saturated fat: a systematic review and meta-analysis of randomized controlled trials. PLoS Med. 2010;7:e1000252. doi: 10.1371/journal.pmed.1000252. [DOI] [PMC free article] [PubMed] [Google Scholar]
- 49.Harris WS, Mozaffarian D, Rimm E, Kris-Etherton P, Rudel LL, Appel LJ, Engler MM, Engler MB, Sacks F. Omega-6 fatty acids and risk for cardiovascular disease. Circulation. 2009;119:902–907. doi: 10.1161/CIRCULATIONAHA.108.191627. [DOI] [PubMed] [Google Scholar]