

Abstract
Background
Increased attention is being placed on the role of subconcussive impacts to the head during football participation and long-term cognitive health. Some have suggested that mitigating impacts to the head can be achieved by reducing or eliminating contact football practices. The effect that this might have on the number and magnitude of impacts is unknown.
Purpose
To estimate the effect of limiting contact practices on the frequency and magnitude of head impacts through the retrospective assessment of in vivo head impact data.
Study Design
Cross-sectional study; Level of evidence, 3.
Methods
Data on impact magnitude and frequency were collected with the Head Impact Telemetry System during the 2009 football season among 42 varsity high school football athletes (mean age, 16.2 ± 0.6 years; mean height, 180.9 ± 7.2 cm; mean weight, 89.8 ± 20.1 kg). Head impacts were compared between player positions and session types (noncontact practice, contact practice, and game). These results were used to estimate the frequency and magnitude of head impacts when contact sessions were restricted.
Results
The participants collectively sustained 32,510 impacts over the 15-week season. The typical athlete sustained a mean of 774 ± 502 impacts during the season with linemen (center, guard, and offensive or defensive tackle positions) sustaining the highest number of impacts per athlete (1076 ± 541), followed by the tight ends, running backs, and linebackers (779 ± 286);wide receivers, cornerbacks, and safeties (417 ± 266); and quarterbacks (356 ± 433). When viewed by session type, noncontact practices (n = 21) accounted for 1998 total impacts (2.4 ± 1.4 per athlete per session), contact practices (n = 36) accounted for 16,346 impacts (10.5 ± 7.7 per athlete per session), and games (n = 14) accounted for 14,166 impacts (24.1 ± 19.1 per athlete per session). Significantly more impacts occurred during games when compared with contact (P = .02) and noncontact practices (P < .001), and contact practices yielded significantly more impacts than noncontact practices (P = .02). Limiting contact practices to once per week would result in a 18% reduction in impacts for the duration of a season, while eliminating all contact practices would further reduce seasonal impacts by 39% across all players. Impact magnitudes were significantly highest during game sessions compared with contact and non-contact practices.
Conclusion
Our findings suggest that limiting or eliminating contact football practices may reduce the number of head impacts sustained by athletes over the course of a season, although the effect that such rule changes may have on head impact magnitudes during practice sessions is less clear. As such, the potential effect of reductions in contact practice on athletes' long-term cerebral health remains unknown.
Keywords: head injuries/concussions, impact magnitude, impact frequency, football (American)
Introduction
The acute effects of sport-related concussions have been well defined in the scientific literature over the previous decade. Immediately following injury, most athletes report an increased number of concussion-related symptoms, decreased motor control, and impaired cognitive functioning.4,8 In general, the injured athlete returns to a preinjury level of functioning in all areas within 7 to 10 days of injury.29 More recently, however, the potential for chronic effects of concussion has been drawn into question.
The earliest investigation suggesting a relationship between a concussive brain injury and persistent cognitive impairment was reported by Martland27 in a group of professional boxers. The condition, termed “punch drunk,” manifested as impaired motor control and periods of confusion and was more prevalent in less skilled fighters who sustained a greater number of blows to the head.35 This condition was widely believed to be isolated to boxers until 2005, when a case study of a former professional football athlete revealed histopathological evidence of long-term neurodegenerative disease (termed chronic traumatic encephalopathy [CTE]).34 The presence of CTE in this athlete was linked to multiple mild traumatic brain injuries. Other investigators have subsequently linked a concussion history to cognitive impairment23 and depression20 later in life. Indeed, the clinical presentations of impaired cognitive function, depression, and decreased motor control are considered hallmark signs and symptoms of CTE.16,30,31
Importantly, the precise cause of CTE remains unknown. Concussions and other forms of traumatic brain injury were initially suspected as the precipitant, but more contemporary theories suggest otherwise. Some have suggested that repeated head impacts not resulting in concussion (ie, sub-concussive impacts) may contribute equally to neurological decline.7 If sub-concussive impacts do in fact lead to CTE, then it follows that an increased exposure to contact sports would increase an athlete's risk for developing this condition. Current technology can measure both the frequency and magnitude of these head impacts. Indeed, the Head Impact Telemetry (HIT) System implements helmet-based accelerometers and has been widely used in a number of athletic settings to evaluate both impact numbers and magnitudes.6,14,28 Many of these investigations have reported the mean number and magnitude of impacts based on a season of play. For example, high school football athletes competing in a 13-week season can expect to sustain 652 head impacts (about 50 impacts per week), with mean magnitudes of 25.3g, 1646.8 rad/s/s, and 15.1 HIT – severity profile (HITsp) value.6,18 It is noteworthy that the number of impacts sustained by athletes can vary widely based on player position. For example, a high school level athlete playing as a receiver, cornerback, or safety may sustain as few as 45 impacts over a season (slightly more than 3 impacts per week), while an offensive or defensive lineman, however may sustain as many as 2235 impacts (171 impacts per week) over the same time period.6
Given the potentially large number of head impacts that a high school football athlete may experience over the course of a season, some have suggested implementing head impact monitoring and limitation strategies.17 Similar to pitch counts in baseball, such proposals would limit each athlete's exposure to impact frequency and magnitude over a given time frame before mandatory rest is enforced. While this proposal has merit, monitoring and curtailing impact numbers are not straight forward. For example, given the economic status of most high school athletic departments, equipping a football team with impact devices may be cost prohibitive. To address this issue, a number of companies are developing innovative, low-cost technologies that will make instrumentation both practical and feasible. In the interim, some have suggested reducing the number of contact practices permitted each week to reduce the athletes' overall head impact burden,17 and in 2011, one collegiate football conference began to limit the number of contact practices per week.24
In the midst of these discussions, it is not clear what effect that these policies will have on the number and magnitude of head impacts. Accordingly, the purpose of this paper was to compare the number and magnitude of head impacts resulting from games, contact practices, and noncontact practices and to estimate the effect of limiting contact practices on head impact exposure in high school football. We hypothesized that game sessions would result in the highest frequency and magnitude of impacts, followed by contact and noncontact practices
Materials and Methods
As part of an ongoing investigation of head impact biomechanics in high school football, we have implemented the HIT System to measure impact numbers and magnitudes over 6 seasons. For this retrospective analysis, we evaluated impact data from the 2009 season, as it represented the maximum season length: 7 days of preseason practice including a scrimmage, 9 weeks of the regular season, and 5 weeks of postseason play including the state championship game. For this portion of the investigation, 42 varsity athletes (mean age, 16.2 ± 0.6 years; mean height, 180.9 ± 7.2 cm; mean weight, 89.8 ± 20.1 kg) were enrolled, with institutional review board approval and accompanying parental consent, before data collection began. Participants were grouped by their primary position: linemen (center, guard, and offensive or defensive tackle); quarterbacks; wide receivers, cornerbacks, and safeties (WR/CB/S); and tight ends, running backs, and linebackers (TE/RB/LB).
Each athlete was fitted with a new or 1-year-old Riddell Revolution helmet (Riddell, Elyria, Ohio) that was equipped with a HIT System encoder. As previously described6,12,18, the HIT System uses 6 single-axis accelerometers to track and record the cranial center of mass acceleration after an impact sustained during sport participation. The system reports a number of output variables for each impact, including the resultant peak linear and rotational accelerations, HITsp value, and impact location. The value of HITsp is a unit-less measure of impact magnitude that incorporates linear acceleration, rotational acceleration, impact location, and impact duration using a weighted principal component analysis.18 For an impact to be recorded, a single accelerometer must exceed a 14.4g linear acceleration threshold, although the ensuing resultant value may be less than 14.4g. Impacts were monitored for errant events, such as dropped or thrown helmets. These data points were marked and later excluded from the analysis.
Data were collected each day the football team held a session and classified as “non-contact practice,” “contact practice,” or “game” by an investigator. Given the highly restrictive nature of the single scrimmage session, it was classified as a contact practice. During the regular season the team completed 2 noncontact practice sessions, 2 contact practice sessions, and 1 game each week. Postseason weeks included 1 noncontact practice, 3 contact practices, and a single game.
Data Analyses
Descriptive statistics were calculated for impact numbers, peak linear and rotational accelerations, and HITsp values for each session type and player position group. Impact frequencies between player positions for each session type were evaluated using Chi-square analysis. Impact magnitudes were evaluated using 2-way (position group × session type) analysis of variance (ANOVA). Prior to the analyses, impact magnitudes were visually inspected for skewness, which revealed positively skewed distributions. To control for this violation, the data were converted with a natural log function prior to analysis. All results are presented in the original metric. Bonferroni post hoc analyses were implemented when omnibus tests were significant (P < .05).
To estimate the effect of restricting contact practice sessions on head impact exposure over the course of a season, the projected numbers of head impacts were derived by replacing the mean number of head impacts experienced during 1 or 2 contact practices each week with the corresponding number of impacts for 1 or 2 noncontact practice sessions for each player position group.
Understanding that the concussion risk is greatest for high-magnitude impacts and can be masked by group means, we also calculated the mean HITsp values for the top 5%, 1% and 0.5% of impacts for each session type.13,14 Only the HITsp metric was evaluated, as it is a combined injury metric incorporating both linear and rotational accelerations and has been shown to have a greater sensitivity for concussions than either individual measure.18 Differences in HITsp values between session type for each impact magnitude bin (ie, top 0.5%, 1%, and 5% of impacts) were examined using 1-way ANOVAs.
Results
Among the 42 participants, 18 were classified as linemen, 2 as quarterbacks, 13 as WR/CB/S, and 9 as TE/RB/LB. Collectively, these athletes sustained 32,510 impacts from 71 sessions in a season that lasted 106 days (ie, 15.1 weeks). Across all positions and including all session types, the typical athlete sustained mean of 774 ± 502 impacts during the season. Linemen sustained the highest number of impacts per athlete (1076 ± 541), followed by the TE/RB/LB group (779 ± 286), the WR/CB/S group (417 ± 266), and quarterbacks (356 ± 433). When viewed by session type, noncontact practices (n = 21) accounted for 1998 total impacts (2.4 ± 1.4 per athlete per session), contact practices (n = 36) accounted for 16,346 impacts (10.5 ± 7.7) per athlete per session), and games (n = 14) accounted for 14,166 impacts (24.1 ± 19.1 per athlete per session). Chi-square analyses indicated no significant difference in impact frequencies between player position groups for the noncontact (P = .80) and game sessions (P = .07), but a significant difference was identified for contact practices (P < .001). Linemen sustained statistically more impacts than the WR/CB/S group (P = .01) and quarterbacks (P < .001) during the contact sessions (Table 1). Further analysis indicated that games resulted in significantly more impacts than contact (P = .02) and noncontact practices (P < .001) and that contact practices yielded significantly more impacts than noncontact practices (P = .02).
Table 1.
Number of head impacts sustained per athlete per session based on position group and session type.
| Non-Contact Practice | Contact Practice | Game | All Sessions | |
|---|---|---|---|---|
| Linemen | 2.6 (1.3) | 16.5 (7.8)* | 29.6 (22.6) | 15.2 (7.6) |
| Quarterbacks | 0.9 (1.1) | 1.7 (0.8) | 19.7 (27.2) | 5.0 (6.1) |
| Receivers, Corners, Safeties | 2.1 (1.0) | 4.8 (2.6) | 14.1 (11.5) | 5.9 (3.7) |
| Tight Ends, Running Backs, Linebackers | 2.8 (1.8) | 8.8 (3.0) | 28.4 (15.0) | 11.0 (4.0) |
Linemen sustained statistically more impacts than the receivers, corners, and safeties (P = .01) and quarterbacks (P < .001) during the contact sessions.
Impact magnitudes were characterized by peak linear and rotational accelerations and the composite HITsp score. The mean impact magnitudes across all athletes and sessions were 25.9 ± 15.5g, 1694.9 ± 1215.9 rad/s/s, and 15.6 ± 8.2 HITsp score. Mean peak linear accelerations by position across all sessions was 28.0 ± 17.3g for quarterbacks, 26.7 ± 16.1g for the TE/RB/LB group, 26.1 ± 17.1g for the WR/CB/S group, and 25.6 ± 14.8g for linemen. ANOVA results indicated no significant difference between player position groups (P = .28). Likewise, peak linear accelerations during games were 26.9 ± 16.8g, 25.7 ± 16.6g for noncontact practices, and 25.2 ± 14.1g for contact practices. A player position by session evaluation of postimpact linear acceleration is provided in Table 2. Significant differences were present between session types (P < .001), with significantly higher accelerations occurring during games relative to contact (P < .001) and non-contact (P < .001) practice sessions. There was no difference between contact and noncontact sessions (P = .39).
Table 2.
Resultant linear acceleration (g) by player position and session type.
| Non-Contact Practice | Contact Practice | Game | |
|---|---|---|---|
| Linemen | 25.9 (17.2) | 25.1 (13.9) | 26.1 (15.6) |
| Quarterbacks | 22.7 (10.9) | 26.3 (17.3) | 28.7 (17.6) |
| Receivers, Corners, Safeties | 26.1 (17.9) | 24.7 (14.8) | 27.4 (18.6) |
| Tight Ends, Running Backs, Linebackers | 25.2 (14.3) | 25.6 (14.1) | 27.8 (17.6) |
Peak rotational accelerations were also used to characterize impact magnitudes. The highest mean values were recorded among the TE/RB/LB group (1753.8 ± 1202.1 rad/s/s), followed by quarterbacks (1712.0 ± 1356.2 rad/s/s), the WR/CB/S group (1678.8 ± 1315.1 rad/s/s), and linemen (1677.4 ± 1185.6 rad/s/s). Differences in session type were also noted with the highest rotational accelerations occurring during games (1769.1 ± 1315.5 rad/s/s), followed by contact practices (1645.8 ± 1118.9 rad/s/s), and noncontact practices (1570.1 ± 1213.4 rad/s/s). A position group by session evaluation of postimpact rotational acceleration is provided in Table 3. ANOVA results evaluating player position and session type indicated a significant effect for both position group (P < .001) and session type (P < .001). Post hoc analysis for player position indicated that the TE/RB/LB group sustained significantly higher rotational accelerations across all sessions compared to all other players (Ps < .001). There were no differences among the other positions (Ps> .05). Post hoc analysis of all players for session type indicated that games resulted in significantly higher rotational acceleration values compared with both contact and noncontact practices (Ps < .001). Rotational acceleration values were also significantly higher during contact practices as compared to noncontact practices (P < .001).
Table 3.
Resultant rotational acceleration (rad/s/s) by player position and session type.
| Non-Contact Practice | Contact Practice | Game | |
|---|---|---|---|
| Linemen | 1579.8 (1172.0) | 1642.5 (1113.2) | 1741.3 (1283.6) |
| Quarterbacks | 1032.9 (946.6) | 1602.7 (1372.1) | 1780.9 (1363.3) |
| Receivers, Corners, Safeties | 1554.3 (1377.4) | 1610.1 (1172.4) | 1767.1 (1415.2) |
| Tight Ends, Running Backs, Linebackers | 1613.5 (1107.5) | 1688.2 (1083.6) | 1826.9 (1298.3) |
The HITsp value, which incorporates both linear and rotational accelerations, was also evaluated as a multifactorial estimate of impact magnitude. Among all sessions, the HITsp score was highest among the TE/RB/LB group (16.1 ± 8.3), followed by linemen (15.6 ± 7.9), the WR/CB/S group (15.4 ± 8.9), and quarterbacks (14.7 ± 8.7). Across session types, the mean HITsp value was highest during games (16.2 ± 9.0), followed by contact practices (15.3 ± 7.4), and noncontact practices (14.6 ± 7.8). A position group by session evaluation of the postimpact HITsp score is provided in Table 4. ANOVA results evaluating player position and session type indicated a significant effect for both position group (P < .001) and session type (P < .001). Post hoc analysis that included all sessions for position group indicated that all groups were significantly different from each other (Ps < .04). Finally, game sessions resulted in higher HITsp values than contact and noncontact practice sessions (Ps < .001), and greater HITsp values were recorded during contact practices compared to noncontact practices (P < .001).
Table 4.
HITsp value by player position and session type.
| Non-Contact Practice | Contact Practice | Game | |
|---|---|---|---|
| Linemen | 14.6 (7.9) | 15.4 (7.5) | 16.0 (8.4) |
| Quarterbacks | 11.1 (5.2) | 14.2 (8.6) | 15.0 (8.8) |
| Receivers, Corners, Safeties | 14.3 (8.3) | 14.7 (7.2) | 16.1 (10.3) |
| Tight Ends, Running Backs, Linebackers | 15.1 (7.0) | 15.6 (7.2) | 16.6 (9.3) |
In an examination of the highest magnitude impacts that included all participants and sessions, the top 5% of impacts were associated with a mean HITsp value of 30.5, the top 1% with a HITsp value of 48.2, and the top 0.5% with a HITsp value of 56.1. These data are presented in Figure 1, which outlines impact magnitudes by session type. The distribution of the HITsp values across session type followed a predictable pattern when all impacts and the top 5% of impacts were evaluated, that is, increasing magnitude between the noncontact practice, contact practice, and game sessions. Indeed, when all impacts were evaluated, HITsp values were significantly higher (P < .001) in game sessions than contact and noncontact practices, and contact practices were greater (Ps < .001) than noncontact practices. Among the top 5% of impacts, game sessions resulted in significantly higher (Ps < .001) HITsp values than contact and noncontact practices. For impacts falling within the 99th and 99.5th percentiles, games resulted in statistically greater HITsp values (Ps < .001) than contact practices, but there was no difference from the noncontact practices.
Figure 1.
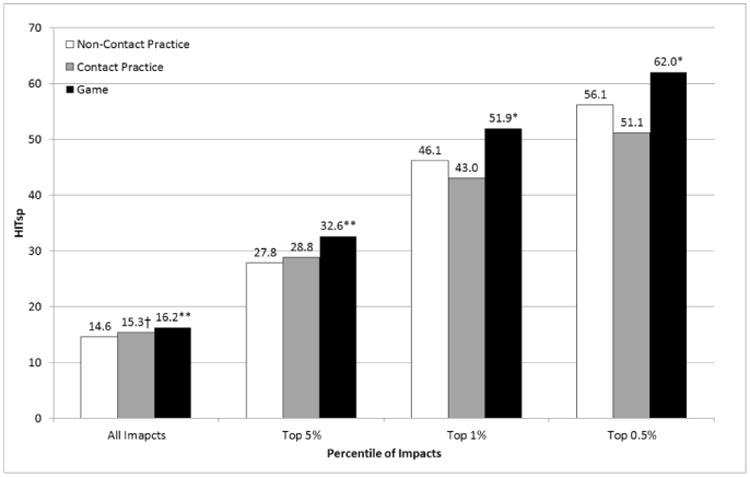
Head Impact Telemetry-severity profile HITsp values for all impacts and the top 5%, 1% and 0.5% of impacts occurring in noncontact practices, contact practices and games.
*Statistically greater than contact sessions. **Statistically greater than contact and non-contact sessions. †Statistically greater than non-contact sessions.
When estimating the effect of replacing contact sessions with noncontact sessions, there was a 17.8% mean reduction in head impacts with only 1 contact practice per week. Eliminating all contact practices reduced head impacts by an estimated 38.9% across all players. The recorded and estimated impact frequencies varied by position and are summarized in Table 5.
Table 5.
Number of head impacts (percent decline) recorded during a season of high school football and the estimated number of head impacts if 1 or no contact practices were allowed.
| Normal Season | Impact estimates with one contact practice per week | Impact estimates with no contact practices per week | |
|---|---|---|---|
| Linemen | 1076 | 840 (-21.9%) | 563 (-47.7%) |
| Quarterback | 356 | 342 (-3.7%) | 327 (-8.1%) |
| Receivers, Corners, Safeties | 417 | 370 (-11.3%) | 314.3 (-24.7%) |
| Tight End, Running Back, Linebacker | 779 | 676 (-13.2%) | 555 (-28.7%) |
| All Athletes | 774 | 636 (-17.8%) | 473 (-38.9%) |
Discussion
This report evaluated the number and magnitude of head impacts occurring during a single season of high school football. Consistent with previous investigations,6 these athletes experienced an average of 774 impacts during the 15-week season, or approximately 50 impacts per athlete per week. For the typical athlete, impacts occurring during the regular season can be divided into 4 impacts during 2 noncontact sessions (Monday and Thursday), 22 impacts from 2 contact sessions (Tuesday and Wednesday) and 24 impacts from a game (Friday). Crisco et al12 previously reported the number of impacts experienced by collegiate football players in practices (combined contact and noncontact sessions) and games. In that investigation, linemen sustained 11.5 impacts per practice and 25 per game, while quarterbacks sustained 3.2 impacts per practice and 8 per game. Other positions were evaluated individually, but group estimations imply that the LB/RB group sustained approximately 6.5 impacts per practice and 16.5 per game, while the WR/CB group sustained approximately 3.5 impacts per practice and 10.5 per game.12 Comparing these results to our own, the collegiate and high school athletes sustained a similar number of head impacts during each practice session, but the high school athletes sustained more impacts, across all positions, during games. Indeed, the high school athletes sustained nearly twice as many impacts as the collegiate athletes, which may be attributed to decreased player availability at the high school level. That is, when compared to college football teams, high school teams often have fewer players who are substituted less often or may play both offensive and defensive positions. Ultimately, the greater number of impacts sustained by the high school athletes may simply be because they spend a greater portion of each game on the field.
The impact magnitudes sustained by the athletes in this investigation are also similar to previous investigations at both the high school and collegiate levels. Among the high school athletes in this investigation, the mean impact magnitudes were 25.9 ± 15.5g, 1694.9 ± 1215.9 rad/s/s, and 15.6 ± 8.2 HITsp score. These values are nearly identical to the mean values reported by Rowson et al37 (22.3g and 1355 rad/s/s), Mihalik et al32 (22.3g), and Crisco et al13 (20.5g and 1400 rad/s/s) in collegiate football athletes. When evaluated by session type, game sessions resulted in significantly higher mean linear acceleration, rotational acceleration, and HITsp values compared with both contact and noncontact sessions (Tables 2-4). In addition, mean rotational acceleration and HITsp values were significantly higher in contact practices compared with noncontact sessions. With each of these measures, however, the mean differences were small and likely not of clinical relevance. The HITsp value for the top 5% of all impacts at the collegiate level has been reported to be 32.0,13 which is similar to the HITsp value of 30.5 reported here. Data for the top 1% and 0.5% of impacts at the collegiate level are not available for comparison.
Researchers and administrative organizations have proposed reducing the number of allowable contact practices each week in an effort to limit head impact exposure.10,17,24 Should contact practices be limited to 1 session per week during the regular season and postseason, our results suggest that the mean impact exposure would decrease by about 18% from 774 to approximately 636 impacts per season. The impact reduction would vary among players based on their position (Table 5) and would likely vary based on the team's style of play.25
While the complete elimination of head impacts in football cannot occur without fundamental changes to the game, eliminating all contact practices has been proposed as an additional means by which to reduce collisions.10 Taking this more drastic approach, an athlete would experience a mean 39% decrease in head impacts (from 774 to 473, or approximately 31 impacts per week). As above, the decreases would not be equal across playing positions. While these large drops in head impact exposure are appealing, extra emphasis on an appropriate tackling technique would need to be put in place to ensure that the highest level of safety was maintained during games.
Mitigating head impact counts in football would plausibly result in fewer contact practices and more noncontact practice sessions. While seemingly logical to reduce the overall number of head impacts that athletes experience over the course of a season, this approach would not directly affect an athlete's head impact exposure during games and might expose athletes to more extreme high-magnitude impacts during practices (Figure 1). The inherent nature of games, with their increased intensity and speed, provides a plausible foundation for the highest magnitude impacts across all session types. The higher, although not statistically different, magnitudes among the top 1% and 0.5% of impacts recorded during noncontact and contact practices however, are an unexpected finding (Figure 1), although not without precedent. Mihalik et al32 reported that the mean linear accelerations during helmet-only practices (22.5g) were higher than those during games (21.1g). That investigation did not account for rotational acceleration, which provides a more comprehensive biomechanical picture, but the mean linear acceleration findings do parallel the current results. Regardless, an explanation to account for why the “easier” sessions resulted in higher magnitude head impacts remains elusive. Some have suggested that when only helmets are worn, athletes are more likely to lead with their heads.32 However, the athletes in the current investigation wore similar equipment on both days: helmets, shoulder pads, and shorts on noncontact days and helmets, shoulder pads and leg pads on contact days. Anecdotally, coaching expectations and intensity did differ during noncontact sessions, which centered on player technique and plays with athletes “wrapping-up” their opponent. Conversely, contact sessions were centered on running plays at full speed and taking the opposing player “to the ground” to simulate game play. In addition, postimpact head acceleration values have been shown to be lower when the impact is anticipated, relative to when it is not.33 As head impacts may not always be expected during noncontact practices, higher acceleration values may have resulted. Regardless of the explanation, exchanging contact practices for noncontact practices would be expected to reduce the total number of head impacts athletes sustain; however, this may be at the expense of more impacts at higher magnitudes.
The concussion incidence in high school football is suggested to range from 3.6 to 5.6% of players each year,22,36 accounting for 43,200 to 67,200 concussions annually.9 The most recent literature does not delineate concussions occurring during contact versus noncontact sessions, but 38% of injuries are reported to occur during practices, while the remaining 62% result from game play.11 Exposure to high magnitude impacts is a clear risk factor for concussions,19 and the findings reported here support the inherent risk of game play (Figure 1). Adding complexity to the picture, some researchers have speculated that subconcussive impacts may also play a role in concussion risk,21 although the research findings on this topic are mixed. One investigation in high school athletes (n = 19) found no association between head impact frequency or a number of impact magnitude variables within 30 minutes of injury, the day of injury, or the entire week preceding injury.15 Conversely, an investigation including both collegiate and high school football athletes reported that both the frequency and magnitude of head impacts sustained were higher on the day of concussion (n = 105) than during noninjury game and practice days.3
Relative to the potential long-term effect head impacts may have on an athlete's risk of developing CTE, some data suggest that the number of head impacts sustained may play a more important role than clinically evident concussions. An evaluation of cerebral perfusion using single-photon emission computed tomography in 97 former professional football players found no difference between those with and without significant concussive events.1 These findings led the authors to speculate that repetitive subconcussive impacts, rather than clinically diagnosed concussions, were responsible for perfusion differences between the football cohort and a healthy control group.1 Similarly, functional magnetic resonance imaging and diffusion tensor imaging studies in athletes participating in football and ice hockey have found cerebral alterations in absence of concussion symptoms or clinically measurable cognitive impairment that were linked to the volume of head impacts.2,5,38 In addition, a case-study autopsy report from a collegiate football athlete with no reported history of concussions revealed early signs of CTE,31 again suggesting that recurrent head trauma rather than clinically evident concussions may precipitate the neurodegenerative CTE process. If verified, this would support the use of head impact numbers to limit the head trauma volume experienced by an athlete each season.
This investigation is not without limitations. First, these data were collected at a single high school and may not be representative of all schools. Differences in coaching philosophy regarding how practices are structured and the team's offensive game plan (ie, a run vs pass offense) will influence both the number and magnitude of impacts.26 In addition, estimates of impact frequency and magnitude presented represent the mean for all players within each position group. Large differences in head impact exposure are known to exist between individual players,6 likely reflecting the number of repetitions taken during practice, game substitution patterns, and potentially playing both offensive and defensive positions. Our methodology did not control for the number of minutes, periods, or downs each athlete played, although such information could be used to further classify rates of head impact exposure.
The current body of literature describing the clinical and pathological findings associated with CTE is based primarily on those in former boxers, professional football players, and other contact sport athletes.30 While contact sport athletes appear to be at a greater risk for developing CTE,31 there is no literature indicating the relationship between head impacts, concussions, and other factors (eg, genetic profile) that may trigger the disease pathway. As such, the effect of reducing impacts by 18% to 40% in the risk for CTE is unknown. Until the risk factors for CTE are better defined by carefully designed and controlled research, prevention strategies will remain educated guesses, at best. Ultimately, a comprehensive approach that includes, but is not necessarily limited to, modifications of head impact exposure, equipment modifications, rule changes and enforcement, and changes in game culture may all be needed to reduce injury risk.
Conclusion
Significant attention has been paid to making the game of football safer for the athletes involved, including discussion on the reduction or elimination of contact practice sessions. Our findings support the notion that limiting or eliminating contact practice sessions will reduce the number of head impacts that athletes experience, but the effect of contact practice limitation on impact magnitudes is less clear. What remains to be determined is what the advisable limit to head impact exposure should be and if reducing full contact practices will result in a higher injury risk in game situations because of a decreased athlete skill set.
Acknowledgments
The authors thank Scott Hamilton and the Unity Rockets for their support in this study.
Footnotes
One or more of the authors has declared the following potential conflict of interest or source of funding: Dr Broglio has discussed data from this study at a meeting in which he was reimbursed for travel and accommodations and/or received an honorarium.
References
- 1.Amen DG, Newberg A, Thatcher R, et al. Impact of playing American professional football on long-term brain function. J Neuropsychiatry Clin Neurosci. 2011;23:98–106. doi: 10.1176/jnp.23.1.jnp98. [DOI] [PubMed] [Google Scholar]
- 2.Bazarian JJ, Zhu T, Blyth B, Borrino A, Zhong J. Subject-specific changes in brain white matter on diffusion tensor imaging after sports-related concussion. Magn Reson Imaging. 2011;30:171–180. doi: 10.1016/j.mri.2011.10.001. [DOI] [PMC free article] [PubMed] [Google Scholar]
- 3.Beckwith JG, Greenwald RM, Chu JJ, et al. Head Impact Exposure Sustained by Football Players on Days of Diagnosed Concussion. Med Sci Sports Exerc. 2013;45:737–746. doi: 10.1249/MSS.0b013e3182792ed7. [DOI] [PMC free article] [PubMed] [Google Scholar]
- 4.Belanger HG, Vanderploeg RD. The neuropsychological impact of sports-related concussion: A meta-analysis. J Int Neuropsychol Soc. 2005;11:345–357. doi: 10.1017/s1355617705050411. [DOI] [PubMed] [Google Scholar]
- 5.Breedlove EL, Robinson M, Talavage TM, et al. Biomechanical correlates of symptomatic and asymptomatic neurophysiological impairment in high school football. J Biomech. doi: 10.1016/j.jbiomech.2012.01.034. In press. [DOI] [PubMed] [Google Scholar]
- 6.Broglio SP, Eckner JT, Martini D, Sosnoff JJ, Kutcher JS, Randolph C. Cummulative head impact burden in high school football. J Neurotrauma. 2011;28:2069–2078. doi: 10.1089/neu.2011.1825. [DOI] [PMC free article] [PubMed] [Google Scholar]
- 7.Broglio SP, Eckner JT, Paulson H, Kutcher JS. Cognitive decline and aging: The role of concussive and sub-concussive impacts. Exerc Sport Sci Rev. 2012;40:138–144. doi: 10.1097/JES.0b013e3182524273. [DOI] [PMC free article] [PubMed] [Google Scholar]
- 8.Broglio SP, Puetz TW. The effect of sport concussion on neurocognitive function, self-report symptoms, and postural control: A meta-analysis. Sports Med. 2008;38:53–67. doi: 10.2165/00007256-200838010-00005. [DOI] [PubMed] [Google Scholar]
- 9.Broglio SP, Sosnoff JJ, Shin S, He X, Alcaraz C, Zimmerman JP. Head impacts during high school football: A biomechanical assessment. J Athl Train. 2009;44:342–349. doi: 10.4085/1062-6050-44.4.342. [DOI] [PMC free article] [PubMed] [Google Scholar]
- 10.Cantu RC, Nowinski CJ. Sports Legacy Institute “Hit Count” White Paper. 2012 [Google Scholar]
- 11.Castile L, Collins CL, McIlvain NM, Comstock RD. The epidemiology of new versus recurrent sports concussions among high school athletes, 2005-2010. Br J Sports Med. 2012;46:603–610. doi: 10.1136/bjsports-2011-090115. [DOI] [PubMed] [Google Scholar]
- 12.Crisco JJ, Fiore R, Beckwith JG, et al. Frequency and location of head impact exposures in individual collegiate football players. J Athl Train. 2010;45:549–559. doi: 10.4085/1062-6050-45.6.549. [DOI] [PMC free article] [PubMed] [Google Scholar]
- 13.Crisco JJ, Wilcox BJ, Beckwith JG, et al. Head impact exposure in collegiate football players. J Biomech. 2011;44:2673–2678. doi: 10.1016/j.jbiomech.2011.08.003. [DOI] [PMC free article] [PubMed] [Google Scholar]
- 14.Crisco JJ, Wilcox BJ, Machan JT, et al. Magnitude of head impact exposures in individual collegiate football players. J Appl Biomech. doi: 10.1123/jab.28.2.174. In press. [DOI] [PMC free article] [PubMed] [Google Scholar]
- 15.Eckner JT, Sabin MN, Kutcher JS, Broglio SP. No evidence for a cummulative impact effect on concussion injury threshold. J Neurotrauma. 2011;28:2079–2090. doi: 10.1089/neu.2011.1910. [DOI] [PMC free article] [PubMed] [Google Scholar]
- 16.Gavett BE, Stern RA, McKee AC. Chronic traumatic encephalopathy: a potential late effect of sport-related concussive and subconcussive head trauma. Clin J Sport Med. 2011;30:179–188. doi: 10.1016/j.csm.2010.09.007. [DOI] [PMC free article] [PubMed] [Google Scholar]
- 17.Greenwald RM, Chu JJ, Beckwith JG, Crisco JJ. A proposed method to reduce underreporting of brain injury in sports. Clin J Sport Med. 2012;22:83–85. doi: 10.1097/JSM.0b013e31824cc5d3. [DOI] [PubMed] [Google Scholar]
- 18.Greenwald RM, Gwin JT, Chu JJ, Crisco JJ. Head impact severity measures for evaluating mild traumatic brain injury risk exposure. Neurosurgery. 2008;62:789–798. doi: 10.1227/01.neu.0000318162.67472.ad. [DOI] [PMC free article] [PubMed] [Google Scholar]
- 19.Gurdjian ES, Lissner HR, Patrick LM. Concussion: Mechanism and Pathology. Proc Am Assoc Automot Med Annu Conf. 1963:470–482. [Google Scholar]
- 20.Guskiewicz KM, Marshall SW, Bailes J, et al. Recurrent concussion and risk of depression in retired professional football players. Med Sci Sports Exerc. 2007;39:903–909. doi: 10.1249/mss.0b013e3180383da5. [DOI] [PubMed] [Google Scholar]
- 21.Guskiewicz KM, Mihalik JP. Biomechanics of sport concussion: quest for the elusive injury threshold. Exerc Sport Sci Rev. 2011;39:4–11. doi: 10.1097/JES.0b013e318201f53e. [DOI] [PubMed] [Google Scholar]
- 22.Guskiewicz KM, Weaver NL, Padua DA, Garrett WE. Epidemiology of concussion in collegiate and high school football players. Am J Sports Med. 2000;28:643–650. doi: 10.1177/03635465000280050401. [DOI] [PubMed] [Google Scholar]
- 23.Guskiewicz KM, Marshall SW, Bailes J, et al. Association between recurrent concussion and late-life cognitive impairment in retired professional football players. Neurosurgery. 2005;57:719–726. doi: 10.1093/neurosurgery/57.4.719. [DOI] [PubMed] [Google Scholar]
- 24.Kim J, Skorton D. In: Report Regarding the Ivy League Review of Concussions in Football. Ivy League, editor. 2011. [Google Scholar]
- 25.Martini DN, Eckner JT, Kutcher JS, Broglio SP. Sub-Concussive Head Impact Biomechanics: Comparing Differing Offensive Schemes. Med Sci Sports Exerc. 2013;45:755–761. doi: 10.1249/MSS.0b013e3182798758. [DOI] [PMC free article] [PubMed] [Google Scholar]
- 26.Martini DN, Eckner JT, Kutcher JS, Broglio SP. Sub-Concussive Head ImpactBiomechanics: Comparing Differing Offensive Schemes. Med Sci Sports Exerc. doi: 10.1249/MSS.0b013e3182798758. In press. [DOI] [PMC free article] [PubMed] [Google Scholar]
- 27.Martland HS. Punch Drunk. JAMA. 1928;91:1103–1107. [Google Scholar]
- 28.McAllister TW, Flashman LA, Maerlender A, et al. Cognitive effects of one season of head impacts in a cohort of collegiate contact sport athletes. Neurology. 2012;78:1777–1784. doi: 10.1212/WNL.0b013e3182582fe7. [DOI] [PMC free article] [PubMed] [Google Scholar]
- 29.McCrory P, Meeuwisse W, Johnston K, et al. Consensus Statement on Concussion in Sport 3rd International Conference on Concussion in Sport Held in Zurich, November 2008. Br J Sports Med. 2009;43:i76–90. doi: 10.1136/bjsm.2009.058248. [DOI] [PubMed] [Google Scholar]
- 30.McKee AC, Cantu RC, Nowinski C, et al. Chronic traumatic encephalopathy in athletes: progressive tauopathy after repetitive head injury. J Neuropathol Exp Neurol. 2009;68:709–735. doi: 10.1097/NEN.0b013e3181a9d503. [DOI] [PMC free article] [PubMed] [Google Scholar]
- 31.McKee AC, Stein TD, Nowinski CJ, et al. The spectrum of disease in chronic traumatic encephalopathy. Brain. doi: 10.1093/brain/aws307. In press. [DOI] [PMC free article] [PubMed] [Google Scholar]
- 32.Mihalik JP, Bell DR, Marshall SW, Guskiewicz KM. Measurement of head impacts in collegiate football players: an investigation of positional and event-type differences. Neurosurgery. 2007;61:1229–1235. doi: 10.1227/01.neu.0000306101.83882.c8. [DOI] [PubMed] [Google Scholar]
- 33.Mihalik JP, Blackburn JT, Greenwald RM, Cantu RC, Marshall SW, Guskiewicz KM. Collision type and player anticipation affect head impact severity among youth ice hockey players. Pediactrics. 2010;125:1394–1340. doi: 10.1542/peds.2009-2849. [DOI] [PubMed] [Google Scholar]
- 34.Omalu BI, DeKosky ST, Minster RL, Kamboh MI, Hamilton RL, Wecht CH. Chronic traumatic encephalopathy in a National Football League player. Neurosurgery. 2005;57:128–134. doi: 10.1227/01.neu.0000163407.92769.ed. [DOI] [PubMed] [Google Scholar]
- 35.Parker HL. Traumatic Encephalopathy (‘Punch Drunk’) of Professional Pugilists. J Neurol Psychopathol. 1934;15:20–28. doi: 10.1136/jnnp.s1-15.57.20. [DOI] [PMC free article] [PubMed] [Google Scholar]
- 36.Powell JW, Barber-Foss KD. Traumatic brain injury in high school athletes. JAMA. 1999;282:958–963. doi: 10.1001/jama.282.10.958. [DOI] [PubMed] [Google Scholar]
- 37.Rowson S, Brolinson G, Goforth M, Dietter D, Duma S. Linear and angular head acceleration measurements in collegiate footbal. J Biomech Eng. 2009;131:061016-1–061016-7. doi: 10.1115/1.3130454. [DOI] [PubMed] [Google Scholar]
- 38.Talavage TM, Nauman E, Breedlove EL, et al. Functionally-detected cognitive impairment in high school football players without clinically-diagnosed concussion. J Neurotrauma. doi: 10.1089/neu.2010.1512. In press. [DOI] [PMC free article] [PubMed] [Google Scholar]