

Abstract
Background.
We compared the effects of two uniquely different lower extremity power training interventions on changes in muscle power, physical performance, neuromuscular activation, and muscle cross sectional area in mobility-limited older adults.
Methods.
Fifty-two subjects (78±5 years, short physical performance battery score: 8.1±1) were randomized to either 16 weeks of progressive high velocity resistance training performed at low external resistance (40% of the 1-repetition maximum [1-RM] [LO]) or high external resistance (70% of 1RM [HI]). Both groups completed three sets of leg and knee extension exercises at maximum voluntary velocity, two times per week. Neuromuscular activation was assessed using surface electromyography and muscle cross sectional area (CSA) was measured using computed tomography.
Results.
At 16 weeks, LO and HI exhibited significant and similar within-group increases of leg extensor peak power (~34% vs ~42%), strength (~13% vs ~19%), and SPPB score (1.4±0.3 vs 1.8±0.3 units), respectively (all P < .03). Improvements in neuromuscular activation occurred in LO (P = .03) while small gains in mid-thigh muscle CSA were detected in LO (1.6%, P = .35) and HI (2.1%, P = .17). No significant between-group differences were evident for any measured parameters (all P > .25).
Conclusions.
High velocity resistance training with low external resistance yields similar improvements in muscle power and physical performance compared to training with high external resistance in mobility-limited elders. These findings may have important implications for optimizing exercise interventions for older adults with mobility limitations.
Key Words: Mobility limitations, exercise interventions, muscle power, high-velocity resistance training.
Limitations in mobility, typically defined as difficulty in performing ambulatory tasks such as walking, rising from a chair, or climbing a flight of stairs, are estimated to affect approximately 30% of adults aged 70 years or older (1). Mobility-limited older adults also have higher rates of falls, chronic disease, institutionalization, and mortality (2). As the population of older adults continues to rapidly increase, corresponding increases in the prevalence and incidence of mobility limitations are inevitable unless interventions for preserving mobility are identified and optimized.
Resistance exercise training interventions have the potential to counteract the age-related decline of mobility among older adults (3). In recent years, recognition of the importance of improving the muscle-power generating capacity of skeletal muscle has given rise to studies in which more powerful, high-velocity movements are employed during progressive resistance training interventions in older participants (3,4). Muscle power (force × velocity of muscle contraction) declines earlier and more rapidly with advancing age compared to muscle strength (maximum force capacity of muscle) (5,6). Furthermore, power is more influential than strength in determining performance on mobility related tasks among older adults (3). High velocity resistance training has emerged as a safe, feasible, and efficacious intervention for increasing lower extremity muscle power in older persons (3,4,7–11). This explosive form of resistance training is characterized by participants performing the concentric phase of each repetition as fast as possible. However, additional studies are needed to better understand and refine power training interventions, particularly for improving muscle power and physical performance outcomes among mobility-limited older adults.
The purpose of this study was to compare the effects of two distinct high velocity power training interventions performed at low external resistance (40% of the 1RM [LO]) or high external resistance (70% of the 1RM [HI]) for improving lower extremity muscle power and mobility in older adults with mobility-limitations. We chose to directly compare these two training intensities because, LO facilitates greater speeds of muscle action with lower force output throughout training, specifically emphasizing the velocity component of muscle power generation. Conversely, HI yields higher force outputs at lower velocities throughout training, thus emphasizing the force component of muscle power generation. The second aim of this investigation was to examine the influence of neuromuscular function and muscle mass as potential mechanisms contributing to changes in muscle power and mobility after LO and HI.
Methods
Study Design
This study was a single blind, randomized, 16-week exercise intervention trial comparing the effects of LO and HI on lower extremity muscle power, mobility, neuromuscular activity and muscle cross sectional area (CSA) in older adults with mobility limitations.
Study Population
Subjects were recruited from the Greater Boston area through advertisements and community newsletters. Participants were initially prescreened by telephone and considered eligible if they were: aged 70–85 years, community-dwelling, not performing any regular endurance or resistance training exercise, and reported difficulty in any of the following mobility-related tasks: walking one quarter of a mile or more; rising from a chair; climbing a flight of stairs; or lifting and carrying an object weighing 10 lbs. Eligible subjects were invited to the research center for a screening visit. Individuals completed a medical history questionnaire and performed the short physical performance battery test (SPPB) for objective assessment of functional performance (2). Participants with an SPPB score of ≤ 9 underwent a physical examination, completed a resting electrocardiogram, standard blood chemistries, and urinalysis. Subjects were excluded if they had a BMI < 19kg/m2 or > 32kg/m2, acute or terminal illness, cognitive impairment (Mini-Mental State Examination score < 23) (12), myocardial infarction or upper/lower extremity fracture in the previous six months, symptomatic coronary artery disease, congestive heart failure, uncontrolled hypertension (>150/90 mm Hg), neuromuscular disease, or hormone replacement therapy. Subjects who met the study entry criteria and were given medical clearance by the study physician were deemed eligible. Signed informed consent was obtained from all study subjects. This study was approved by the Tufts University Health Sciences Institutional Review Board.
High Velocity Power Training Interventions
Blood pressure and heart rate were recorded before each training session, followed by five minutes of stationary cycling. All subjects trained two times per week for 16 weeks. Subjects randomized to LO performed three sets of 10 repetitions at 40% of their 1RM for the seated bilateral leg press (LP) and seated unilateral knee extension (KE) exercises using Keiser pneumatic resistance training equipment (Keiser Sport Health Equipment Inc., Fresno, CA). Subjects assigned to HI performed three sets of 10 repetitions at 70% of their 1RM for LP and KE. Both intervention groups were instructed to complete the concentric phase as fast as possible, maintain full extension for 1 second, and complete the eccentric phase over 2 seconds. Participant’s self-perceived level of exertion was assessed after each completed set of LP and KE using the Borg scale (13). The resistance for each participant was adjusted every three weeks by repeating the 1RM measures. To compare the relative training intensities of LO and HI throughout each intervention, data were analyzed from the training session following each tri-weekly 1RM reassessment.
Testing Procedures
Testing of all outcome measures were conducted by a blinded assessor prior to randomization and repeated at week 16. An additional interim assessment of muscle strength, power, and neuromuscular activation was performed at week 4.
SPPB
The SPPB is a well-established, valid and reliable objective test of lower extremity physical performance (2). Testing involves assessment of standing balance, usual gait speed, and chair stand performance. Scores obtained using the SPPB are highly predictive of subsequent disability, institutionalization, and mortality (2).
Muscle Strength, Peak Power, and Neuromuscular Activation
Assessment of muscle strength and peak power has been previously described and validated (14). Briefly, strength was assessed by 1RM measurement of LP and individual right and left KE, using the same pneumatic resistance training equipment used throughout training. After 1RM testing, LP and individual right and left KE peak muscle power was assessed. Each participant was instructed to complete five repetitions as quickly as possible through their full range of motion at 40% and 70% of 1RM; each separated by 30 seconds of rest. Baseline 1RM and peak power measures were performed twice with approximately seven days between evaluations. The best of the two baseline measures was used as the baseline value. All KE data are presented for the left leg as no differences were evident between left or right leg KE measurements.
Vastus lateralis rate of activation was assessed by surface electromyography (EMG) using a commercially available data acquisition system (Delsys Bagnoli-8, Delsys, Boston, MA). Muscle activation was quantified during the LP peak power testing performed at 70% of 1RM, as previously described (15,16). At both time points, the EMG electrodes were placed on the main bulk of the vastus lateralis muscle. To account for inexact electrode placement during assessments, we normalized the rate of EMG rise to the peak EMG magnitude obtained from a sustained maximal voluntary isometric contraction. Rate of EMG rise was calculated as the mean derivative of the normalized EMG signal between activation onset and movement onset. Activation onset was attained by finding the EMG amplitude that exceeded the resting mean plus 3 standard deviations.
Muscle Size
Computed tomography (CT) of the non-dominant thigh was performed at the midpoint of the femur using a Siemens Somotom Scanner (Erlangen, Germany) (15). All scans were analyzed by a single blinded investigator using SliceOmatic v4.2 software (Montreal, Canada). Reliability of these measures has been previously demonstrated as excellent (Intraclass correlation coefficients range from .95 to .99) (17).
Statistical Analysis
Data analysis was performed using SAS statistical software (Version 9.2, SAS Institute Inc., Cary, North Carolina). Data are presented as mean ± SD or adjusted mean ± SE. An intention-to-treat analysis was utilized. Outcome variables were assessed using repeated measures analysis of variance and covariance models to analyze the effect of time, group and time × group interactions. Independent samples t-tests were used to compare the training intensity between LO and HI. Statistical significance was accepted at P ≤ .05.
RESULTS
Recruitment and Subject Characteristics
Participant screening and recruitment throughout the study are presented in Figure 1. A total of 65 subjects met acceptable SPPB score criteria of ≤ 9, however, 10 subjects were excluded for medical reasons. Three eligible subjects dropped out before being randomized; one due to a previously unreported history of inguinal hernia, one because of muscle soreness, and one was no longer interested in participating after baseline testing. A total of 52 subjects were randomized to LO (n = 25) or HI (n = 27). Baseline characteristics are presented in Table 1.
Figure 1.

Participant flow from initial respondents to randomization.
Table 1.
Baseline Subject Characteristics
| Variables | LO | HI | P value |
|---|---|---|---|
| Age, years | 78.3±5 | 77.6±4 | .51 |
| Body Mass Index, kg/m2 | 25.7±3 | 27.4±3 | .08 |
| Medical diagnoses, n | 3.3±2.4 | 3.8±2.5 | .43 |
| Medications, n | 3.8±3 | 4.5±3 | .52 |
| SPPB | 8.0±1.3 | 8.1±1.2 | .75 |
Values are mean ± SD.
Training Intensity
Comparison of representative LO and HI training intensity during weeks 3, 9, and 15 (average of three sets) is presented in Table 2. For both LP and KE, the external training resistances (% 1RM’s) were maintained at the desired levels and were significantly different between groups throughout the study (P < .05). As intended, HI produced greater absolute force levels (P < .05) while LO produced significantly greater velocities (P < .05) for both LP and KE. Power output levels elicited during LP and KE training for both LO or HI were similar throughout the study (all P ≥ .25). During LP training, total work tended to be lower in LO (P = .06–.12), while during KE, total work was significantly lower in LO at each representative training session evaluated (P < .05). In LO, rate of perceived exertion was significantly and consistently lower throughout training.
Table 2.
Comparison of Training Intensity Between LO & HI Throughout the Intervention
| Training | Week 3 | Week 9 | Week 15 | |||
|---|---|---|---|---|---|---|
| Leg Extension | LO | HI | LO | HI | LO | HI |
| % 1RM | 40.2±0.8 | 70.0±0.2* | 40.4±1.2 | 70.1±0.5* | 40.0±0. | 70.0±0.0* |
| Force, N | 401±108 | 654±239* | 423±222 | 672±264* | 405±125 | 660±200* |
| Work, J | 155±70 | 203±91 | 167±84 | 177.3±71 | 174±59 | 214±87 |
| Power, W | 218±131 | 226±118 | 222±134 | 217±124 | 251±129 | 261±124 |
| Velocity, radians | 0.41±0.16 | 0.28±0.10* | 0.41±0.13 | 0.27±0.09* | 0.47±0.13 | 0.32±0.09* |
| RPE | 11.7±1.6 | 14.2±2.5* | 11.4±1.6 | 13.1±2.4* | 11.3±2.1 | 12.9±2.4* |
| Knee Extension | LO | HI | LO | HI | LO | HI |
| % 1RM | 40.0±0.0 | 70.0±0.0* | 40.0±0.0 | 70.0±0.0* | 40.0±0.0 | 70.0±0.0* |
| Force, N | 27.7±8 | 44.5±13* | 29.4±10 | 40.1±17* | 29.8±10 | 44.2±13* |
| Work, J | 32.3±13 | 46.9±15* | 34.5±15 | 45.7±16* | 36.2±15 | 47.9±17* |
| Power, W | 46.9±22 | 56.3±29 | 45.7±27 | 54.7±29 | 51.9±26 | 60.5±31 |
| Velocity, radians/sec | 1.91±0.43 | 1.39±0.37* | 1.79±0.66 | 1.47±0.36 | 1.97±0.45 | 1.52±0.41* |
| RPE | 13.5±1.8 | 15.1±2.1* | 13.1±1.2 | 14.7±1.9* | 13.2±2.3 | 14.5±1.6* |
Values are mean ± SD. * = significant difference between training groups (P < .05).
RPE: Rate of perceived exertion (6–20 Borg scale)
Training Adherence
One LO participant withdrew from the study due to an illness (week 7). Three HI participants withdrew from the study. One subject reported a hamstring injury and back pain after a training session (week 2), one subject discontinued secondary to exacerbation of preexisting chronic obstructive pulmonary disease (week 5), and one participant had a non-injurious fall outside of the laboratory after a training visit (week 10) and was withdrawn after consultation with the study investigators. No other adverse events were reported. Overall adherence rates (number of training sessions attended / total number of sessions), including all withdrawals, corresponded to 88% in LO and 82% in HI.
Outcome Measures
Muscle power, contraction velocity, strength, and neuromuscular activation
At week 4, no significant within or between group changes were evident for any measure of LP or KE muscle power, contraction velocity or muscle strength (Table 3 and Supplementary Appendix Table 4). However, by week 16, large and statistically significant increases in LP muscle power, contraction velocity and strength were elicited within both groups. For KE, each intervention group was associated with significant gains in most parameters measured. No statistically significant between-group differences were evident.
Table 3.
Leg Extensor Muscle Power, Contraction Velocity and Strength: Absolute and Relative Changes
| Week 4 | Week 16 | |||||||||
|---|---|---|---|---|---|---|---|---|---|---|
| Power Training Group | Baseline Value mean ± SD | Delta* mean ± SE | % Change mean ± SE | P (within group) | P (between groups) | Delta* mean ± SE | % Change mean ± SE | P (within group) | P (between groups) | |
| Peak Power (40%), W | LO | 243±113 | 10.3±10 | 6.2±6 | .29 | .54 | 50.4±15 | 34.0±11 | .002 | .26 |
| HI | 260±140 | 1.9±9 | 6.2±5 | .84 | 74.8±15 | 42.1±8 | .001 | |||
| Contraction Velocity (40%), m/s | LO | 0.48±0.13 | 0.01±0.02 | 1.2±5 | .76 | .47 | 0.06±0.02 | 17.7±6 | .005 | .55 |
| HI | 0.47±0.15 | −0.01±0.02 | 1.9±5 | .47 | 0.08±0.02 | 25.2±7 | .0004 | |||
| Peak Power (70%), W | LO | 273±131 | 6.9±12 | 5.5±6 | .57 | .68 | 47.6±17 | 32.9±13 | .007 | .40 |
| HI | 282±153 | −0.01±12 | 4.0±4 | .99 | 67.7±17 | 41.6±12 | .001 | |||
| Contraction Velocity (70%), m/s | LO | 0.35±0.1 | 0.003±0.02 | 1.6±6 | .87 | .23 | 0.03±0.02 | 14.6±7 | .07 | .73 |
| HI | 0.34±0.11 | −0.02±0.02 | −4.8±4 | .12 | 0.04±0.02 | 21.2±9 | .02 | |||
| 1RM Strength, N | LO | 882±258 | 4.4±35 | 0.7±3 | .90 | .97 | 116.4±38 | 13.3±4 | .003 | .41 |
| HI | 940±344 | 2.6±34 | 1.1±4 | .94 | 160.5±38 | 19.2±4 | .0001 | |||
*Adjusted for baseline value.
Rate of vastus lateralis neuromuscular activation was unchanged at week 4 within both groups (P > .77). However, at week 16, rate of activation increased in both groups and was significantly improved in LO (P = .03) but not in HI (P = .65) (Figure 2). No between-group differences were found (P > .26).
Figure 2.

Rate of vastus lateralis muscle activation: baseline vs week 16 (absolute means ± SE). * = Significant within-group difference (P < .05).
SPPB
Significant improvements in SPPB score were elicited within both groups (Figure 3). A 1.3 unit increase (P < .001) in SPPB occurred in LO score while HI produced a 1.8 unit increase (P < .001). No between-group differences were evident (P = .32).
Figure 3.
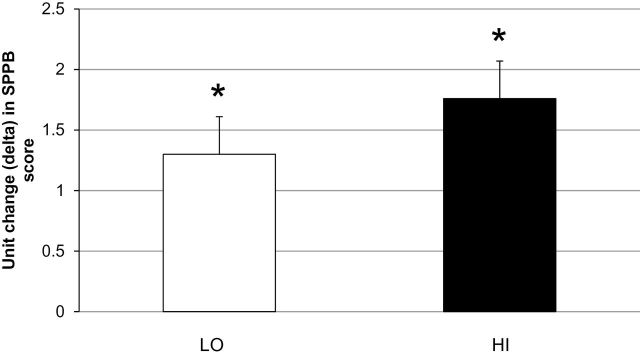
SPPB score change: baseline vs week 16 (adjusted means ± SE). * = Significant within-group difference (P < .05).
Muscle Size
At week 16, non-significant but noticeable gains in total mid-thigh muscle CSA occurred in LO (Adjusted Δ ± SE, % change: 0.76±1cm2, 1.6%, P = .35) and in HI (1.6±1cm2, 2.1%, P = .17) (between-group difference: P = .78).
Discussion
This is the first study to directly compare the effects of two distinct high velocity power training interventions on changes in muscle power, mobility, muscle mass, and neuromuscular activation in mobility-limited older adults. The major finding from this investigation is that, both modes of velocity-specific (LO) and force-specific (HI) power training elicited significant and similar improvements in lower extremity muscle power and mobility performance after 16 weeks. However, these important outcomes were accomplished in LO with consistently lower training loads, total work, and levels of perceived exertion throughout the intervention compared to HI. We also demonstrated that both LO and HI elicited notable improvements in neuromuscular activation and muscle mass within this population of mobility-limited older adults.
Muscle Power
The magnitude of lower extremity muscle power improvements in the current investigation (~26% to ~42%) are of particular interest when compared to previous studies. In healthy older subjects without mobility-limitations, peak muscle power has been shown to improve similarly by ~15% after 12 weeks of high velocity power training across three different resistance levels (20% 1RM, 50% 1RM, or 80% 1RM) (7). Reid et al. reported improvements in peak power ranging from ~23% to ~30% after 12 weeks of high velocity power training (performed at 70% 1RM) in mobility-limited older adults (10). The longer training duration of the current study may explain the greater muscle power gains observed compared to these previous studies. However, our findings are in notable contrast to two other previous studies. In healthy, high functioning older adults, 12 weeks of high velocity training (at resistance equivalent to 70% of body mass) resulted in gains of leg extensor muscle power of ~150% (11). Similarly, Fielding et al. showed that 16 weeks of high velocity power training (at 70% 1RM) resulted in leg power gains ranging from ~33 to ~97% in older females (9). This study, conducted in participants reporting mild levels of self-reported functional difficulties rather than subjects with performance-based limitations in mobility, also revealed rapid early improvements in knee and leg extensor muscle power (~15% to ~53% after four weeks). In the current study, no changes in muscle power were observed after four weeks of LO or HI. This observation suggests that training-induced improvements in muscle power among mobility-limited older adults occur over a longer and more gradual time course compared to more rapid improvements in healthier older individuals and younger subjects (9,18).
Effects of LO and HI on Mobility
Both LO and HI were associated with substantial gains in mobility performance as a 1-unit improvement in SPPB score is considered a meaningfully large clinical effect (19). The respective gains in SPPB in LO and HI were similar despite the major differences in absolute force loads, total work and perceived exertion throughout training in both groups. Overall, the magnitude of the SPPB improvements observed are greater than a previous study reporting a 0.7 unit SPPB score increase following 12 weeks of power training in healthy older adults(11). Our findings are also comparable with other studies of alternative exercise interventions in mobility-limited older adults that emphasized explosive power movements. Programs of weighted stair climbing and weighted vest exercises that incorporated high velocity movements, ranging from 12–16 weeks in duration, have improved SPPB score by 1.1–2.7 units in mobility-limited older adults (8,20).
Neuromuscular and Muscle Mass Adaptations
The improvements in muscle performance and mobility observed after LO and HI may be attributed to both neural and muscular adaptations. Our findings suggest that the training induced adaptations in neural drive and increased muscle CSA are mechanistically similar, but of a lower magnitude, to adaptations shown in younger subjects and healthy older populations (21). Neuromuscular activation at week 4 remained unchanged and mirrored the overall changes in muscle performance evident at this interim assessment. Previous studies in younger and healthier older adults have demonstrated early neural adaptations to resistance training performed at various intensities (21–23). Our findings indicate that despite robust training stimuli for neuromuscular adaptations, mobility-limited participants elicit delayed neuromuscular responses to high velocity power training. Similarly, the small muscle CSA changes observed are modest compared to previous investigations. Studies specifically designed to induce muscle hypertrophy in older individuals using resistance training have reported muscle CSA gains ranging from 5%–12% after 10–14 weeks of training (23–25). Overall, it is plausible that mobility-limited older adults have an attenuated capacity for neural or muscle regeneration in response to resistance training interventions as this population exhibit substantial deficits in neuromuscular function, muscle mass, strength and muscle quality compared to younger or healthy older subjects without mobility limitations (15). Therefore, therapeutic interventions, such as LO or HI, that can preserve or increase neural activation or muscle mass within mobility-limited older adults may have important clinical significance.
Study Limitations
There are several limitations to this investigation. The relatively small sample sizes may have limited the overall statistical power of the study to detect significant between-group differences for the primary muscle power and mobility outcomes. It is also currently unknown whether the magnitude of the observed between-group difference in leg power is clinically meaningful (~8%), as no study to date has quantified a minimal clinically important difference in leg extensor muscle power output among mobility-limited older adults. Such information, which has been established for the SPPB test (19), would be beneficial for further interpretation of the current study findings. In addition, the measurement variability associated with the EMG and CT measures likely restricted our ability to detect consistent within-group differences after LO and HI. An additional interim assessment of lower extremity power after week 4 would have also provided greater insight into the time course of the respective muscle power improvements after LO and HI observed in this study.
Clinical Implications
There are important clinical implications related to our study findings. Compared to HI, participants in LO, using lighter resistance and moving the training loads more rapidly, attained substantial improvements in muscle power and clinically important gains in mobility. These outcomes, which were accomplished with overall lower total workloads and consistently lower rates of perceived exertion, may have important implications for exercise prescription strategies for older adults as the use of lighter weights moved more rapidly may be a more practical and tolerable form of high velocity power training. This may be of particular relevance for older adults with chronic conditions as arthritis, osteoporosis, or other debilitating disorders where high intensity exercise may be contraindicated or poorly tolerated. As there is a distinct lack of research comparing various exercise regimens for improving mobility in vulnerable older adults, future studies should assess the feasibility and efficacy of longer term (> 4 months) interventions of high velocity power training among mobility-limited older using a variety of external resistances and training volumes. Additional research is also warranted to assess the feasibility of implementing sustained interventions of high velocity resistance training and alternative exercise regimens for restoring muscle power in clinical and community-based settings. Recent evidence demonstrating the benefits of a long term multimodal exercise intervention for preserving mobility in a large cohort of mobility-limited older adults from a variety of urban and rural settings is encouraging (26).
Conclusions
This study demonstrated that two distinct 16 week power training interventions, performed at low or high external resistance, elicited significant and similar improvements in muscle power, and clinically meaningful improvements in physical performance in mobility-limited older adults. These improvements were primarily driven by adaptations in neuromuscular function and small increases in muscle mass. High velocity resistance training, using light resistance moved more rapidly, may be a more practical and widely applicable form of power training for improving muscle power, counteracting mobility loss and ultimately addressing a major clinical and physiological issue affecting older adults.
Supplementary Material
Supplementary material can be found at: http://biomedgerontology.oxfordjournals.org/
Funding
This research was supported by the National Institute on Aging grant number AG18844 and based upon work supported by the U.S. Department of Agriculture, under agreement No. 58-1950-0-014. Any opinions, findings, conclusion, or recommendations expressed in this publication are those of the author(s) and do not necessarily reflect the view of the U.S. Department of Agriculture. This research was also supported by the Boston Claude D. Pepper Older Americans Independence Center (1P30AG031679) and the Boston Rehabilitation Outcomes Center Grant (1R24HD065688-01A1). This manuscript contributed to the requirements for a PhD. thesis in Clinical Medicine at Trinity College Dublin.
Supplementary Material
References
- 1. Freedman VA, Martin LG. Understanding trends in functional limitations among older Americans. Am J Public Health. 1998;88:1457–1462. [DOI] [PMC free article] [PubMed] [Google Scholar]
- 2. Guralnik JM, Simonsick EM, Ferrucci L, et al. A short physical performance battery assessing lower extremity function: association with self-reported disability and prediction of mortality and nursing home admission. J Gerontol. 1994;49:M85–M94. :10.1093/geronj/49.2.M85 [DOI] [PubMed] [Google Scholar]
- 3. Reid KF, Fielding RA. Skeletal muscle power: a critical determinant of physical functioning in older adults. Exerc Sport Sci Rev. 2012;40:4–12. :10.1097/JES.0b013e31823b5f13 [DOI] [PMC free article] [PubMed] [Google Scholar]
- 4. Evans WJ. Exercise strategies should be designed to increase muscle power. J Gerontol A Biol Sci Med Sci. 2000;55:M309–M310. :10.1093/gerona/55.6.M309 [DOI] [PubMed] [Google Scholar]
- 5. Metter EJ, Conwit R, Tobin J, Fozard JL. Age-associated loss of power and strength in the upper extremities in women and men. J Gerontol A Biol Sci Med Sci. 1997;52:B267–B276. :10.1093/gerona/52A.5.B267 [DOI] [PubMed] [Google Scholar]
- 6. Reid KF, Pasha E, Doros G, et al. Longitudinal decline of lower extremity muscle power in healthy and mobility-limited older adults: influence of muscle mass, strength, composition, neuromuscular activation and single fiber contractile properties. Eur J Appl Physiol. 2014;114:29–39. :10.1007/s00421-013-2728-2 [DOI] [PMC free article] [PubMed] [Google Scholar]
- 7. de Vos NJ, Singh NA, Ross DA, Stavrinos TM, Orr R, Fiatarone Singh MA. Optimal load for increasing muscle power during explosive resistance training in older adults. J Gerontol A Biol Sci Med Sci. 2005;60:638–647. :10.1093/gerona/60.5.638 [DOI] [PubMed] [Google Scholar]
- 8. Bean JF, Herman S, Kiely DK, et al. Increased Velocity Exercise Specific to Task (InVEST) training: a pilot study exploring effects on leg power, balance, and mobility in community-dwelling older women. J Am Geriatr Soc. 2004;52:799–804. :10.1111/j.1532-5415.2004.52222.x [DOI] [PubMed] [Google Scholar]
- 9. Fielding RA, LeBrasseur NK, Cuoco A, Bean J, Mizer K, Fiatarone Singh MA. High-velocity resistance training increases skeletal muscle peak power in older women. J Am Geriatr Soc. 2002;50:655–662. :10.1046/j.1532-5415.2002.50159.x [DOI] [PubMed] [Google Scholar]
- 10. Reid KF, Callahan DM, Carabello RJ, Phillips EM, Frontera WR, Fielding RA. Lower extremity power training in elderly subjects with mobility limitations: a randomized controlled trial. Aging Clin Exp Res. 2008;20:337–343. [DOI] [PMC free article] [PubMed] [Google Scholar]
- 11. Earles DR, Judge JO, Gunnarsson OT. Velocity training induces power-specific adaptations in highly functioning older adults. Arch Phys Med Rehabil. 2001;82:872–878. :10.1053/apmr.2001.23838 [DOI] [PubMed] [Google Scholar]
- 12. Folstein MF, Folstein SE, McHugh PR. “Mini-mental state”. A practical method for grading the cognitive state of patients for the clinician. J Psychiatr Res. 1975;12:189–198. [DOI] [PubMed] [Google Scholar]
- 13. Borg G. Perceived exertion as an indicator of somatic stress. Scand J Rehabil Med. 1970;2:92–98. [PubMed] [Google Scholar]
- 14. Callahan D, Phillips E, Carabello R, Frontera WR, Fielding RA. Assessment of lower extremity muscle power in functionally-limited elders. Aging Clin Exp Res. 2007;19:194–199. :10.1007/BF03324689 [DOI] [PubMed] [Google Scholar]
- 15. Reid KF, Doros G, Clark DJ, et al. Muscle power failure in mobility-limited older adults: preserved single fiber function despite lower whole muscle size, quality and rate of neuromuscular activation. Eur J Appl Physiol. 2012;112:2289–2301. :10.1007/s00421-011-2200-0 [DOI] [PMC free article] [PubMed] [Google Scholar]
- 16. Clark DJ, Patten C, Reid KF, Carabello RJ, Phillips EM, Fielding RA. Muscle performance and physical function are associated with voluntary rate of neuromuscular activation in older adults. J Gerontol A Biol Sci Med Sci. 2011;66:115–121. :10.1093/gerona/glq153 [DOI] [PMC free article] [PubMed] [Google Scholar]
- 17. Lustgarten MS, Price LL, Phillips EM, Fielding RA. Serum glycine is associated with regional body fat and insulin resistance in functionally-limited older adults. PLoS One. 2013;8:e84034. :10.1371/journal.pone.0084034 [DOI] [PMC free article] [PubMed] [Google Scholar]
- 18. Kraemer WJ, Newton RU. Training for muscular power. Phys Med Rehabil Clin N Am. 2000;11:341–368, vii. [PubMed] [Google Scholar]
- 19. Perera S, Mody SH, Woodman RC, Studenski SA. Meaningful change and responsiveness in common physical performance measures in older adults. J Am Geriatr Soc. 2006;54:743–749. :10.1111/j.1532-5415.2006.00701.x [DOI] [PubMed] [Google Scholar]
- 20. Bean JF, Kiely DK, LaRose S, O’Neill E, Goldstein R, Frontera WR. Increased velocity exercise specific to task training versus the National Institute on Aging’s strength training program: changes in limb power and mobility. J Gerontol A Biol Sci Med Sci. 2009;64:983–991. :10.1093/gerona/glp056 [DOI] [PMC free article] [PubMed] [Google Scholar]
- 21. Aagaard P, Suetta C, Caserotti P, Magnusson SP, Kjaer M. Role of the nervous system in sarcopenia and muscle atrophy with aging: strength training as a countermeasure. Scand J Med Sci Sports. 2010;20:49–64. 10.1111/j.1600-0838.2009.01084.x [DOI] [PubMed] [Google Scholar]
- 22. Caserotti P, Aagaard P, Larsen JB, Puggaard L. Explosive heavy-resistance training in old and very old adults: changes in rapid muscle force, strength and power. Scand J Med Sci Sports. 2008;18:773–782. :10.1111/j.1600-0838.2007.00732.x [DOI] [PubMed] [Google Scholar]
- 23. Häkkinen K, Newton RU, Gordon SE, et al. Changes in muscle morphology, electromyographic activity, and force production characteristics during progressive strength training in young and older men. J Gerontol A Biol Sci Med Sci. 1998;53:B415–B423. :10.1093/gerona/53A.6.B415 [DOI] [PubMed] [Google Scholar]
- 24. Frontera WR, Meredith CN, O’Reilly KP, Knuttgen HG, Evans WJ. Strength conditioning in older men: skeletal muscle hypertrophy and improved function. J Appl Physiol (1985). 1988;64:1038–1044. [DOI] [PubMed] [Google Scholar]
- 25. Suetta C, Aagaard P, Rosted A, et al. Training-induced changes in muscle CSA, muscle strength, EMG, and rate of force development in elderly subjects after long-term unilateral disuse. J Appl Physiol (1985). 2004;97:1954–1961. :10.1152/japplphysiol.01307.2003 [DOI] [PubMed] [Google Scholar]
- 26. Pahor M, Guralnik JM, Ambrosius WT, et al. ; LIFE study investigators. Effect of structured physical activity on prevention of major mobility disability in older adults: the LIFE study randomized clinical trial. JAMA. 2014;311:2387–2396. :10.1001/jama.2014.5616 [DOI] [PMC free article] [PubMed] [Google Scholar]
Associated Data
This section collects any data citations, data availability statements, or supplementary materials included in this article.