

Abstract
N-cadherin is a cell-cell adhesion molecule that plays a role in breast cancer metastasis. Here, we show that in vivo expression of N-cadherin in the PyMT mouse model, which enhances mammary tumor metastasis, results in selective inhibition of Akt3 expression and phosphorylation. Similarly, exogenous expression of N-cadherin in PyMT or MCF-7 mammary tumor cells enhanced cell motility and caused a dramatic reduction in Akt3 expression and phosphorylation. Moreover, knockdown of Akt3 in PyMT tumor cells increased cell motility and disrupted mammary morphogenesis, but had no effect on cell proliferation. Conversely, overexpression of wild-type Akt3 in PyMT-N-cadherin cells inhibited cell motility promoted by N-cadherin. Taken altogether, these findings demonstrate that N-cadherin suppresses Akt3 to promote cell motility and highlight the intricate regulation of Akt isoforms by N-cadherin during metastasis.
Keywords: adhesion, motility, Akt isoforms, Akt3, breast cancer
INTRODUCTION
Metastasis is a multi-step process where tumor cells migrate away from a primary tumor to grow at a distant site. For tumor cells to successfully metastasize, they must acquire the ability to detach from the primary tumor, invade into the extracellular matrix, intravasate into lymphatic or blood vessels, extravasate out into a distant site and form secondary tumors.1 Cell-cell adhesion is a critical process that regulates metastasis through key modulators such as the classical cadherins, especially E-cadherin and N-cadherin.2–4 E-cadherin is expressed in epithelial tissues where it maintains strong cell-cell adhesion and tissue architecture and is thus often reduced during malignant progression.2 On the contrary, N-cadherin, which is prevalent in neurons and mesenchymal tissues,4 has been found to be upregulated in invasive breast cancer cell lines5 and breast tumors, especially in the metastasis-prone micropapillary breast carcinoma.6 Upregulation of N-cadherin in malignant cells was shown to enhance cell motility, invasion and metastasis.7–10 The mechanism whereby N-cadherin promotes metastasis is likely to be complex but one possibility involves the regulation of oncogenic signaling pathways.3 We have shown that N-cadherin expression in MCF-7 cells promotes metastasis by enhancing extracellular-signal-regulated kinase (ERK) phosphorylation that leads to matrix metallopeptidase-9 upregulation and increased tumor cell invasion.8,9 These findings were corroborated in vivo, where de novo expression of N-cadherin in the MMTV-PyMT mouse model of mammary tumorigenesis enhanced metastasis partly because of increased ERK activation and matrix metallopeptidase-9 expression.10 Interestingly, whereas ERK inhibition suppressed invasion, it had no effect on cell migration, suggesting that N-cadherin uses another pathway to regulate cell migration.10 Indeed, we observed that Akt phosphorylation was decreased in PyMT-N-cadherin cells compared with PyMT control cells, thus suggesting that N-cadherin attenuates the Akt pathway to increase cell motility.10
The Akt pathway involves three distinct isoforms, Akt1, Akt2 and Akt3, which were shown to differentially regulate cell proliferation, motility and invasion.11,12 Whereas Akt2 promotes tumor cell motility and epithelial-to-mesenchymal transition, Akt1 suppresses these processes.13,14 Whereas several studies have addressed the role of Akt1 and Akt2 in tumor progression, little is known about Akt3. Here we report in vivo in the PyMT-N-cadherin breast cancer metastasis model that N-cadherin enhances motility by suppressing Akt3 function. We show that N-cadherin expression in the PyMT and MCF-7 mammary tumor cells has no effect on Akt1 or Akt2 but selectively suppresses Akt3 expression. In addition, we demonstrate that knockdown of Akt3 in PyMT tumor cells increased cell motility and disrupted mammary morphogenesis, but had no effect on tumor cell proliferation. Conversely, increased expression of wild-type Akt3 in PyMT-N-cadherin tumor cells inhibited cell motility while having no effect on cell proliferation. Therefore, our study suggests that N-cadherin suppresses Akt3 to promote tumor cell motility during metastasis.
RESULTS
In vivo mammary expression of N-cadherin in the MMTV-PyMT transgenic breast tumor model suppresses Akt3 expression and phosphorylation
We previously observed an inverse relationship between ERK and Akt phosphorylation in N-cadherin-expressing PyMT mammary tumor cells (PyMT-N-cad) derived from the highly metastatic PyMT-N-cadherin bi-transgenic mouse. Namely, whereas ERK phosphorylation was increased in PyMT-N-cad cells, Akt phosphorylation was decreased relative to control PyMT cells.10 Given the intricate interplay between the Akt isoforms in tumor progression, we sought to determine whether N-cadherin alters the expression of specific Akt isoforms in PyMT-N-cad cells. Independent heterogeneous pools of mammary tumor epithelial cells were generated from three PyMT and PyMT-N-cad mice. These tumors were at 7 weeks post tumor onset because at this time point PyMT-N-cad mice exhibited a 3.5-fold increase in metastasis compared with PyMT mice.10 It is important to note that the mammary tumor cell lines were used only once after 4 days in culture to minimize in vitro artifacts. These cell lines were analyzed for their expression of N-cadherin, E-cadherin and PyMT by immunoblotting to confirm their tumorigenic epithelial origin. As expected, N-cadherin expression was increased in PyMT-N-cad cells compared with PyMT cells, whereas E-cadherin levels were unchanged (Figure 1a). The expression of PyMT, a viral oncoprotein that drives tumorigenesis in this model, was also comparable (Figure 1a). Next, the levels of the individual Akt isoforms were assessed with isoform-specific Akt antibodies and relative expression levels were assessed by densitometry. Although Akt1 and Akt2 expression was similar in PyMT and PyMT-N-cad cells (Figures 1a and b), Akt3 was significantly decreased in PyMT-N-cad cells relative to PyMT cells (Figures 1a and b).
Figure 1.
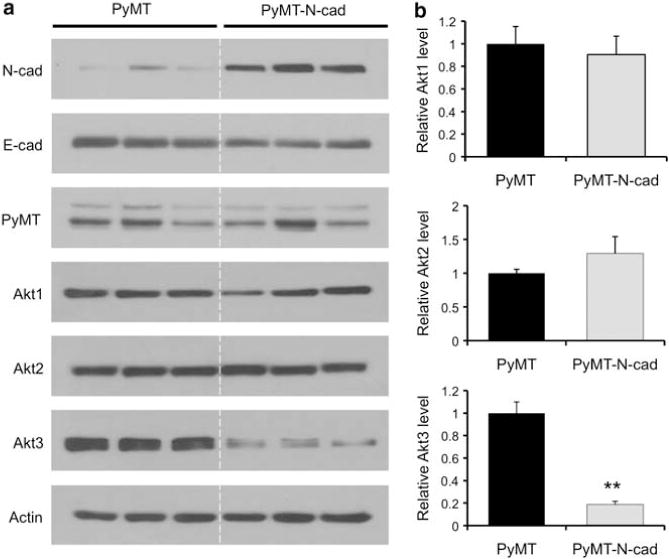
Akt3 expression is suppressed in PyMT-N-cad primary tumor cells compared with PyMT cells. (a) Lysates from heterogeneous pool of cells generated from PyMT and PyMT-N-cadherin primary tumors at 7 weeks post tumor onset were western blotted for N-cadherin (N-cad), E-cadherin (E-cad), PyMT, Akt1, Akt2, Akt3 and actin as loading control. (b) Levels of each Akt isoform shown in (a) were quantified by densitometry. Bar graphs show the average densitometry values normalized to actin±s.e.m. from three PyMT and three PyMT-N-cad cell lines. The values are represented as fold change relative to PyMT cells. **P<0.01, two-tailed t-test.
Clonal epithelial cell lines were also derived from PyMT and PyMT-N-cad mammary tumors at 7 weeks post tumor onset. These cell lines were maintained in culture for further analysis of the regulation of Akt3 expression by N-cadherin. Four PyMT-N-cad clones were analyzed; all showed similar increases in N-cadherin and unchanged levels of E-cadherin compared with PyMT control clones (Figure 2a). Consistent with observations made in heterogeneous pools, PyMT-N-cad clonal cell lines exhibited a significant decrease in Akt3 expression, but did not show any changes in Akt1 or Akt2 expression (Figures 2a and b).
Figure 2.
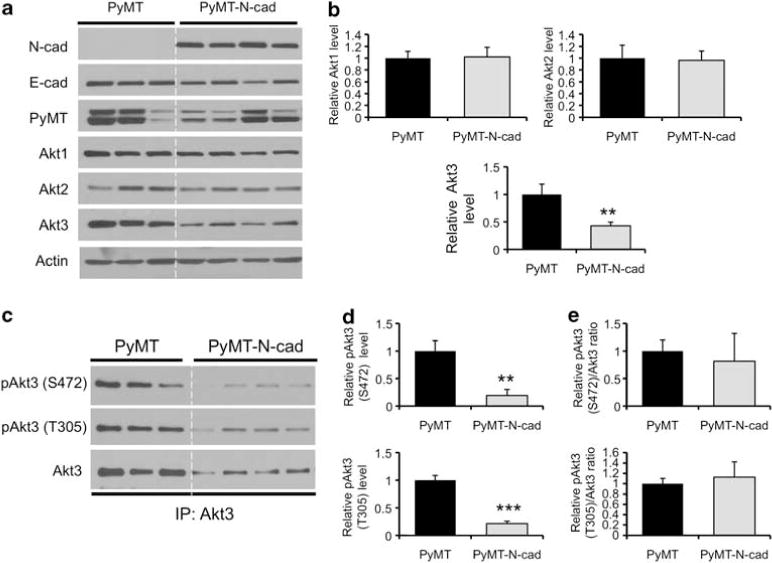
Akt3 expression and subsequently Akt3 phosphorylation are suppressed in PyMT-N-cadherin clonal cell lines compared with PyMT cell lines. (a) Levels of N-cad, E-cad, PyMT, Akt1, Akt2, Akt3, and actin were assessed by western blotting in clonal cells lines generated from PyMT and PyMT-N-cad primary tumors at 7 weeks post tumor onset. (b) The levels of each Akt isoform shown in (a) were quantified by densitometry and normalized to actin. (c) Akt3 was immunoprecipitated from the PyMT and PyMT-N-cad clonal cell lines using an Akt3 antibody and western blotted with antibodies against phosphorylated Akt (Ser473) or (Thr308) and Akt3. (d) The levels of Akt3 phosphorylation at Ser472 and Thr305 shown in (c) were quantified by densitometry. (e) The densitometry values of Akt3 phosphorylation at Ser472 and Thr305 were normalized to total Akt3 shown in (c). All bar graphs show the average densitometry values±s.e.m. from two independent experiments represented as fold change relative to PyMT cell lines. **P<0.01, ***P<0.001, two-tailed t-test.
We also assessed the phosphorylation levels of Akt3 in these cell lines using antibodies that recognize two regulatory sites, Ser472 and Thr305.15 To specifically detect Akt3 phosphorylation, Akt3 immunoprecipitates from PyMT and PyMT-N-cad cell extracts were immunoblotted with anti-phospho-Akt Ser472 and Thr305 or anti-Akt3. The phosphorylation of Akt3 at both Ser472 and Thr305 sites was significantly decreased in the PyMT-N-cad cells compared with PyMT cells (Figures 2c and d). The decrease in Akt3 phosphorylation in PyMT-N-cad cells was equivalent to the decrease in total Akt3 levels, as shown by a densitometric ratio of 1.0 between phosphorylated and total Akt3 levels (Figure 2e), suggesting that the phosphorylation of Akt3 is suppressed because of decreased Akt3 expression.
Exogenous expression of N-cadherin in a PyMT mammary tumor cell line reduces Akt3 expression and phosphorylation
To further confirm that N-cadherin suppresses Akt3 expression, a myc-tagged N-cadherin construct (N-cad-Myc) or control vector was transduced into a PyMT clonal cell line. PyMT-N-cad-Myc cells positive for N-cad membrane expression were isolated by fluorescence-activated cell sorter analysis using an extracellular N-cad-specific antibody. Immunofluorescence analysis revealed that high levels of N-cadherin were present at cell-cell contacts in PyMT-N-cad-Myc cells as compared with low levels in PyMT control cells (Figure 3a). In both control PyMT and PyMT-N-cad-Myc cells, E-cad was predominantly present at the membrane (Figure 3a), further suggesting that expression of N-cad does not displace E-cad from cell-cell contacts. These observations were validated by western blot analysis that demonstrated that ectopic N-cad-Myc expression had no effect on either E-cad or PyMT expression (Figure 3b). The effects of ectopic N-cad-Myc on the expression of Akt isoforms were also analyzed. Once again, Akt1 and Akt2 expression remained unchanged but Akt3 expression was decreased when comparing PyMT-N-cad-Myc cells with PyMT control cells (Figure 3b). Furthermore, immunoblot analysis of Akt3 immunoprecipitates showed that Akt3 phosphorylation at Ser472 and Thr305 was reduced in PyMT-N-cad-Myc cells relative to PyMT control cells (Figure 3c). Again, the decrease in Akt3 phosphorylation was proportional to the decrease in Akt3 expression (Figure 3d), suggesting that Akt3 phosphorylation is suppressed because of reduced Akt3 protein expression.
Figure 3.
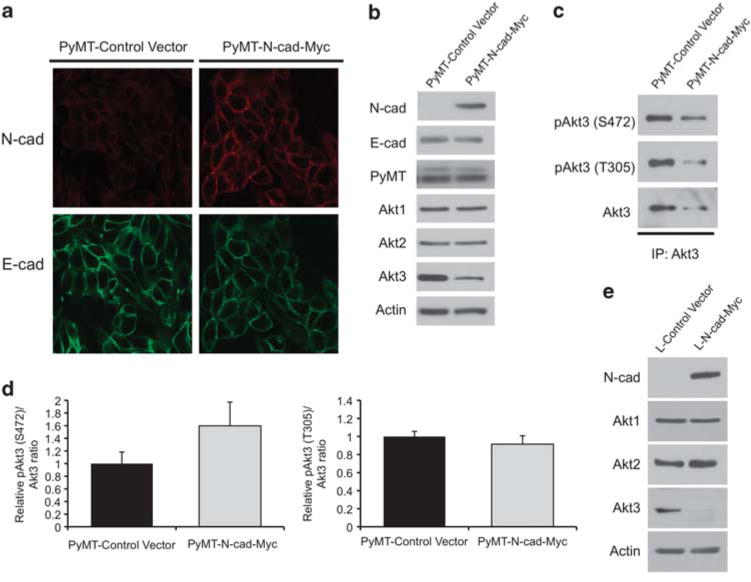
Ectopic expression of N-cadherin in a PyMT cell line reduces Akt3 expression, causing the suppression of Akt3 phosphorylation. (a) A PyMT cell line was transduced with N-cad-Myc or control vector. The localization of N-cad and E-cad was analyzed by immunostaining for E-cad (fluorescein isothiocyanate (FITC)) and N-cad (TRITC). (b) Lysates from PyMT-control vector and PyMT-Ncad-Myc were western blotted for N-cad, E-cad, PyMT, Akt1, Akt2, Akt3 and actin. (c) Akt3 was immunoprecipitated from PyMT-control vector and PyMT-N-cad-Myc cells using an Akt3 antibody and western blotted with antibodies against phosphorylated Akt (Ser473), phosphorylated Akt (Thr308) and total Akt3. (d) The densitometry value of Akt3 phosphorylation at Ser472 and Thr305 were normalized to total Akt3. The bar graphs show the average densitometry value±s.e.m. from two independent experiments represented as fold change relative to PyMT. (e) Levels of N-cad, Akt1, Akt2, Akt3 and actin were assessed by western blot in L cells transfected with N-cad-Myc or control vector.
To further validate that the effects of N-cadherin on Akt3 expression were not because of confounding effects from other cadherins present in mammary epithelial cells such as R-cadherin,16 we transfected N-cad-Myc into mouse L cells that are fibroblasts devoid of endogenous cadherins. In these cells, N-cad was also found to downregulate Akt3 expression without affecting Akt1 or Akt2 levels compared with control vector-transfected L cells (Figure 3e). These data, in combination with our findings in PyMT-N-cad cells, strongly suggest that N-cadherin selectively suppresses Akt3 expression and hence phosphorylation.
To confirm the relationship between N-cadherin and Akt3 in human breast cancer cells, we expressed N-cadherin in MCF-7 cells. We found that transfection of a tetracycline-repressible human N-cadherin vector into MCF-7 cells induced N-cadherin and reduced Akt3 expression 24 h following tetracycline withdrawal from the growth media (Figure 4a, lane 2). In contrast, cells maintained in tetracycline exhibited negative N-cadherin but positive Akt3 expression (Figure 4a, lane 1). However, Akt 1, Akt2 or E-cad levels remained unchanged between induced and non-induced MCF-7 cells (Figure 4a, lanes 1 and 2), suggesting an N-cadherin-dependent suppression of Akt3. These data were further corroborated in MCF-7 cells constitutively expressing N-cadherin. N-cadherin-stimulated increases in cell motility and invasion8 (Figure 4b) were accompanied by Akt3 downregulation but had no effect on Akt1 or Akt 2 expression (Figure 4a, lanes 3 and 4). Thus, the effects of N-cadherin on Akt3 expression seen in mouse mammary tumor cells were reproduced in human breast cancer cells.
Figure 4.
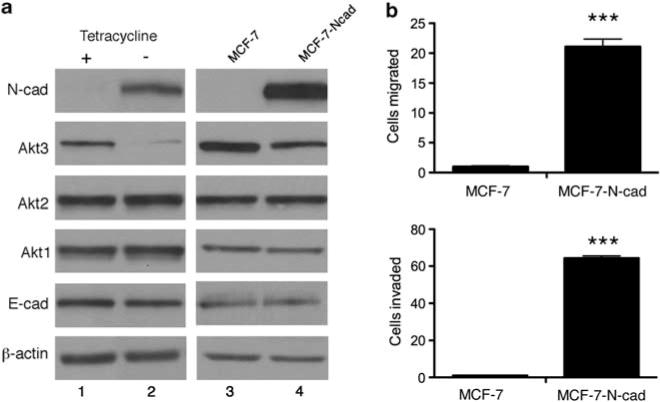
Exogenous expression of N-cadherin in the weakly motile MCF-7 cell line enhances motility and reduces Akt3 expression. (a) MCF-7 cells were transfected with either a tetracycline-inducible N-cadherin expression vector (lanes 1 and 2) or a constitutive N-cadherin complementary DNA (cDNA) construct (lanes 3 and 4). Cell lysates were immunoblotted for N-cad, Akt3, Akt2, Akt1, E-cad and β-actin. (b) MCF-7 and MCF-7-N-cad cells were tested for cell motility and Matrigel invasion in Boyden chambers. The number of migrated or invaded cells in each well was counted from seven × 20 microscope fields. The bar graphs show the average number of migrated or invaded cells per field±s.e.m. from three independent experiments; ***P<0.001, two-tailed t-test.
N-cadherin reduces Akt3 mRNA but has no effect on Akt3 protein stability
Given that N-cadherin has an inhibitory effect on Akt3 expression, we examined whether this effect occurred at the transcriptional or post-translational level. Akt3 mRNA levels in two PyMT and PyMT-N-cadherin clonal cell lines (PyMT1, PyMT2, PyMT-N-cad1 and PyMT-N-cad2) were assessed by real-time quantitative PCR. One out of the two PyMT-N-cadherin cell lines exhibited a modest, yet significant, decrease in Akt3 mRNA levels compared with PyMT cells (Supplementary Figure 1A). In addition, PyMT-N-cad-Myc cells also had a slightly lower level of Akt3 mRNA than PyMT-control vector cells (Supplementary Figure 1B). These data suggest that transcriptional regulation may be a partial mechanism by which N-cadherin suppresses Akt3 expression.
Next, we examined whether N-cadherin expression affects Akt3 protein stability. PyMT and PyMT-N-cad clonal cell lines were treated with the protein synthesis inhibitor cycloheximide for 0, 2, 4 and 8 h. Extracts from these cells were then western blotted for Akt3. PyMT-N-cad cell lines exhibited similar Akt3 degradation rate as PyMT cell lines (Supplementary Figure 1C). We also performed the same experiment on PyMT-control vector cells and PyMT-N-cad-myc cells and found that the degradation rate of Akt3 was comparable between the two cell lines (Supplementary Figure 1D). Altogether, these data indicate that N-cadherin modestly affects the expression of Akt3 at the transcriptional level but not at the post-translational level. Similar effects on Akt3 mRNA expression and protein stability were obtained in N-cadherin-expressing L cells relative to vector-transfected cells (not shown).
N-cadherin suppression of Akt3 expression is independent of FGFR As N-cadherin was shown to mediate invasion by potentiating fibroblast growth factor receptor (FGFR) signaling,8–10 we speculated that N-cadherin may regulate Akt3 expression through the FGFR pathway. We thus tested whether inhibition of FGFR1 by the FGFR1 tyrosine kinase inhibitor, PD173074,17 restores Akt3 expression. Treatment of PyMT-N-cad cells with PD173074 at 0.1–0.5 μM, which efficiently reduced FRS2 and ERK phosphorylation,18 had no effect on Akt3 expression (Supplementary Figure 2). These data suggest that N-cadherin regulates Akt3 expression in an FGFR-independent manner.
Akt3 knockdown in PyMT cell lines increases cell migration and disrupts mammary acinar morphogenesis
Several studies have demonstrated that Akt isoforms regulate cell motility.11,12 Given that we previously showed that expression of N-cadherin in PyMT cells promotes motility,10 and that we have presently found that N-cadherin specifically suppresses Akt3, we examined the effects of decreased Akt3 expression on cell motility. Three independent Akt3 (Akt3 shRNAmir-1, -2 and -3) targeting different regions of the Akt3 mRNA were transduced into a PyMT clonal cell line. A vector containing a sequence that does not target any known mammalian gene was used as control. The expression levels of Akt3 were analyzed by western blotting. Akt3 shRNAmir-2 and -3 most efficiently silenced Akt3 expression (Figure 5a), whereas they had no effect on the expression of Akt1 or Akt2 (Figure 5a). The effect of Akt3 knockdown by shRNAmir-2 or -3 on cell migration was determined in transwell motility assays. PyMT cell lines expressing either Akt3 shRNAmir-2 or -3 exhibited a 1.7- and a 1.8-fold increase in cell motility, respectively, compared with control cells (Figure 5b).
Figure 5.
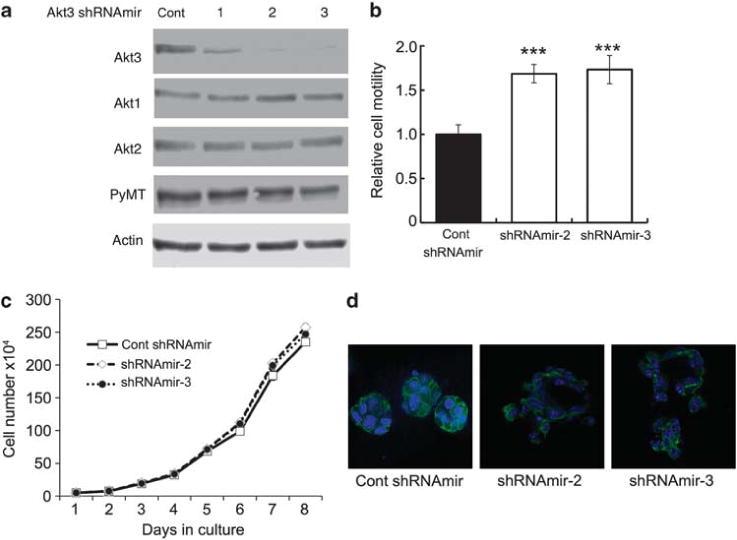
Knockdown of Akt3 increases cell migration without affecting cell growth. It also disrupts mammary acinar structure. (a) Three different Akt3 shRNAmirs targeting different regions of the Akt3 mRNA and non-silencing vector control were transduced into a PyMT mammary tumor cell line. The cells were lysed and western blotted with antibodies against Akt3, Akt2, Akt1 and Actin. (b) The motility of PyMT cell lines transduced with either control shRNAmir, Akt3 shRNAmir-2 or Akt3 shRNAmir-3 was examined by transwell migration assays. The number of migrated cells in each well was counted from seven × 20 microscope fields. The bar graphs show the average number of migrated cells per field±s.e.m. from three independent experiments performed in triplicates; ***P<0.001, by two-tailed t-test. (c) Cell growth curves of PyMT cell lines transduced with Akt3 shRNAmir-2 or -3 were compared with that of cells expressing control shRNAmir. Each time point represents mean±s.e.m. of cell numbers from triplicate experiments. (d) PyMT cell lines transduced with either control shRNAmir, Akt3 shRNAmir-2 or -3 were grown in Matrigel for 10 days. Cultures were fixed and stained with phalloidin and counterstained with 4,6-diamidino-2-phenylindole (DAPI). For each condition, acini formation was imaged by confocal microscopy and representative images are shown.
Considering that Akt isoforms have been shown to be involved in cell proliferation and survival,15 we analyzed the effects of Akt3 knockdown on these processes in the PyMT cell lines. Growth curves performed for PyMT cell lines transduced with control vector, Akt3 shRNAmir-2 or -3 showed that both Akt3 knockdown cell lines exhibited similar growth rates as compared with control cells (Figure 5c). These data suggested that Akt3 does not affect cell proliferation, implying that N-cad attenuates Akt3 expression to enhance cell motility.
It has been shown that Akt1 and Akt2 have distinct effects on mammary acinar morphogenesis.13 We therefore examined whether Akt3 knockdown would affect the formation of mammary acini in three-dimensional Matrigel cultures. We cultured the PyMT cell lines transduced with control shRNAmir, Akt3shRNAmir-2 or -3 in Matrigel for 10 days. Matrigel cultures were fixed and stained with phalloidin to visualize the actin cytoskeleton and changes in morphogenesis (Figure 5d). Using confocal microscopy, we found that compared with control PyMT cells that formed compact spheroids with cortical actin belts, PyMT cells transduced with either Akt3 shRNAmir-2 or -3 were unable to assume a full acinar structure (Figure 5d). These results suggest that Akt3 loss disrupts mammary morphogenesis.
These results were further reproduced in another PyMT cell line, in which Akt3 shRNAmir-3, which caused the most dramatic knockdown of Akt3 without affecting Akt1 or Akt2 (Figure 6a), caused a 2.5-fold increase in cell motility (Figure 6b). Although Akt3 shRNAmir-3 enhanced migration, it did not affect cell growth or viability (Figure 6c). Moreover, Akt3 shRNAmir-3 caused PyMT cells to form aberrant acini in Matrigel as compared with control cells that formed intact acini (Figure 6d). Taken together, these data suggest that Akt3 suppresses malignant transformation by inhibiting cell motility and supporting acinus formation.
Figure 6.
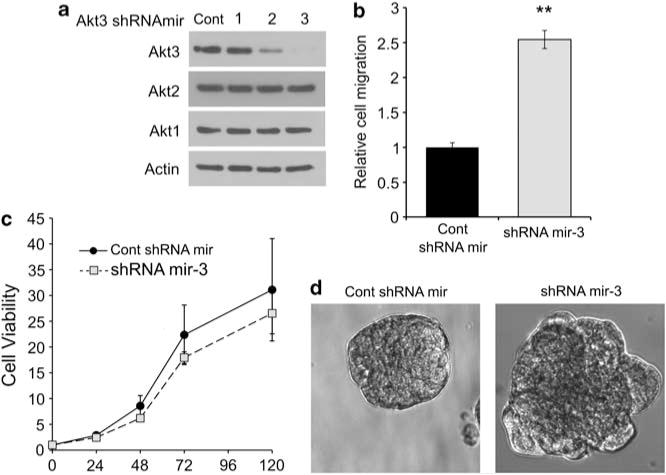
Akt3 knockdown increases cell motility and disrupts morphogenesis without affecting cell viability in another PyMT cell line. (a) Three different Akt3 shRNAmirs targeting different regions of the Akt3 mRNA and non-silencing vector control were transduced into a PyMT mammary tumor cell line. The cells were lysed and western blotted with antibodies against Akt3, Akt2, Akt1 and Actin. (b) The motility of PyMT cell lines transduced with either control shRNAmir or Akt3 shRNAmir-3 was examined by transwell migration. The number of migrated cells in each well was counted from seven × 20 microscope fields. The bar graphs show the average number of migrated cells per field±s.e.m. from three independent experiments performed in triplicates; P<0.01, two-tailed t-test. (c) Cell growth curves of PyMT cell lines transduced with Akt3 shRNAmir-3 were compared with that of cells expressing control shRNAmir. The line graph shows the average fluorescence signal from triplicates of three independent experiments. (d) PyMT cell lines transduced with control shRNAmir or Akt3 shRNAmir-3 were grown in Matrigel for 10 days, fixed and imaged with bright field microscopy.
Overexpression of Akt3 in PyMT-N-cad cells inhibits cell motility Having found that Akt3 inhibits cell motility, we hypothesized that Akt3 played a role in N-cadherin-induced motility. As shown earlier, N-cadherin suppresses Akt3 expression and subsequently the phosphorylation of Akt3. To determine whether activation of Akt3 inhibits N-cad-mediated motility, we generated a PyMT-N-cad cell line expressing wild-type Akt3 using a lentiviral expression vector. By western blotting, we confirmed that PyMT-N-cad-Akt3 cells had increased expression of Akt3 (Figure 7a) but unchanged Akt1 or Akt2 expression relative to PyMT-N-cad control cells (Figure 7a). To analyze the migration of PyMT-N-cad-Akt3 cells relative to control cells, we first performed transwell migration assays. Interestingly, Akt3 expression dramatically suppressed motility as compared with PyMT-N-cad control cells (Figure 7b). Similar results were obtained when cell migration was measured by a time-lapse epidermal growth factor (EGF) chemotaxis assay (Figure 7c). PyMT-N-cad-Akt3 and PyMT control cells were serum starved and stimulated with EGF for 30 min. EGF-treated PyMT-N-cad cells expressing Akt3 exhibited dramatically reduced chemotaxis as compared with PyMT-N-cad control cells that were highly motile (Figure 7c). In this assay, there was however no change in motile behavior between untreated cells from control and Akt3-overexpressing PyMT-N-cad cells (Figure 7c). To dissociate the effects of Akt3 on cell motility from those on cell proliferation, we measured 5-bromodeoxyuridine (BrdU) incorporation in these cell lines. We found no differences in BrdU uptake between Akt3 and control vector expressing PyMT-N-cad cells, indicating that Akt3 suppresses motility but has no effect on cell proliferation (Figure 7d), consistent with the effect of Akt3 knockdown on these processes.
Figure 7.
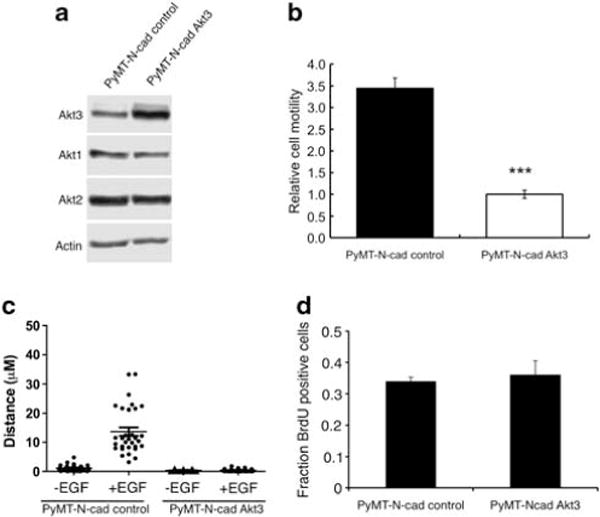
Overexpression of wild-type Akt3 in a PyMT-N-cad cell line inhibits cell migration. (a) A PyMT-N-cad cell line was transduced with a lentiviral Akt3 expression vector and control vector. Lysates from these cells were western blotted with antibodies against Akt3, Akt1, Akt2 and Actin. (b) Cell migration of PyMT-N-cad-control vector and PyMT-N-cad-Akt3 cells was measured by transwell migration assays. The number of migrated cells in each well was counted from seven × 20 microscope fields. The bar graph shows the average number of migrated cells per field±s.e.m. from three independent experiments; ***P<0.001, two-tailed t-test. (c) PyMT-N-cad-control vector and PyMT-N-cad-Akt3 cells were serum starved for 4–6 h, left untreated or treated with 100 ng/ml of EGF delivered by a micropipette. The motility of these cells was assessed by time-lapse assay for 30 min. The box-and-whisker plot shows the distance travelled by cells in μM. Data were obtained by analyzing ≥40 cells from three independent experiments; P<0.001, two-tailed t-test. (d) Cell proliferation of PyMT-N-cad-Akt3 cells relative to control cells was measured by BrdU incorporation in cells cultured in growth media. Cells pulsed with BrdU for 2 h were fixed and stained with a fluorescein isothiocyanate (FITC)-conjugated anti-BrdU antibody for 30 min at room temperature (RT). The fraction of BrdU-positive cells in 500 cells was determined in triplicate experiments. Data are mean±s.e.m.
DISCUSSION
We have previously shown that mammary expression of N-cadherin in the PyMT mammary tumor model enhances tumor cell motility, invasion and metastasis in vivo. N-cadherin was shown to constitutively activate the ERK pathway that led to matrix metallopeptidase-9 upregulation and tumor cell invasion.10 Interestingly, although invasion was dependent on ERK activation, N-cadherin-induced motility was not, suggesting that invasion and motility are governed by distinct signaling events.10 Indeed, the findings from this study show that N-cadherin regulates the Akt pathway to enhance tumor cell migration via Akt3 suppression.
We found that N-cadherin expression into the MMTV-PyMT mouse, which enhances metastasis, suppresses Akt3 expression in primary tumors, suggesting Akt3 regulation by N-cadherin occurs in vivo. Suppression of Akt3 by N-cadherin appears to be direct as ectopic expression of N-cadherin in PyMT cells, MCF-7 cells and finally in L cells that do not contain any other cadherins dramatically reduced Akt3 expression. This downregulation of Akt3 resulted in a decrease in Akt3 phosphorylation, suggesting that Akt3 activity is important for motility suppression. Interestingly, N-cadherin selectively targeted Akt3 as it had no effect on the expression of either Akt1 or Akt2.
Our data showed that N-cadherin had no effect on Akt3 protein stability but caused a modest decrease in Akt3 mRNA levels, suggesting a mild effect on Akt3 gene transcription. However, this alone is unlikely to account for the large reduction in Akt3 protein expression. We thus speculate that N-cadherin may modulate Akt3 expression at the translational level possibly through the regulation of microRNAs that have been shown to regulate other Akt isoforms.19 Thus, the likelihood that N-cadherin attenuates Akt3 expression via the regulation of microRNAs remains to be determined.
As N-cadherin was shown to mediate metastasis by potentiating FGFR signaling,8–10 we speculated that N-cadherin may regulate Akt3 through the FGFR pathway. However, inhibition of FGFR by PD173074 in PyMT-N-cad cells, which was previously shown to reduce tumor motility and invasion,10 did not reverse Akt3 suppression. These data suggest that N-cadherin regulates Akt3 expression in an FGFR-independent manner.
Several studies have shown that Akt1 inhibits motility whereas Akt2 promotes it in breast cancer cells.11,12 However, little is known about the function of Akt3 in tumor progression. We are the first to demonstrate a function for Akt3 in breast cancer and to link it to tumor cell migration. We propose that downregulation of Akt3 may be one mechanism by which N-cadherin enhances metastasis in the PyMT mammary tumor model. N-cadherin expression in this model enhanced metastasis without affecting primary tumor growth.10 Consistent with these findings, knockdown of Akt3 in PyMT cells increased cell motility without affecting cell proliferation. In three-dimensional Matrigel cultures, knockdown of Akt3 in PyMT cell lines disrupted acinar morphogenesis, which might be caused by weakened cell-cell adhesion associated with the motile phenotype.
Our findings clearly show that Akt3 signaling regulates cell migration. In further support of this idea, we showed that expression of Akt3 in PyMT-N-cad cells markedly reduced cell migration. These results are consistent with the inhibition of cell motility observed in melanoma cells exogenously expressing myristoylated Akt3.20 Our data demonstrate that N-cadherin-stimulated motility can be reversed by enhancing Akt3 expression.
Although we have shown that Akt3 inhibits motility, the mechanism by which Akt3 regulates this process remains unknown. Previous studies have demonstrated that the Akt isoforms can modulate motility via the regulation of oncogenic signaling.21 Akt1 has been shown to suppress breast cancer cell migration by inhibiting ERK, which is known to regulate transcription of pro-motility genes.13 However, we have not found a link between Akt3 and ERK activity in the PyMT-N-cad model. Akt3 knockdown in PyMT cells did not activate ERK (not shown), consistent with that ERK inhibition in PyMT-N-cad cells did not affect cell motility.10
Given that Akt3 and Akt1 may be functionally redundant as both isoforms were shown to inhibit breast cancer cell migration, it is not clear how Akt1 does not compensate for Akt3 loss in tumor cells. This raises the question of whether Akt3 and Akt1 share common or independent mechanisms. Both Akt1 and Akt3 were shown to phosphorylate glycogen synthase kinase-3β and Foxo1,22 suggesting that these isoforms may signal through the same pathway to modulate migration. Thus, if Akt1 and Akt3 share common pathways, then N-cadherin might inhibit motility by lowering the combined activity of Akt1 and Akt3. On the other hand, Akt3 and Akt1 may use independent mechanisms to regulate motility. In support of this notion, Akt1, and not Akt2, has been shown to associate with and phosphorylate the actin-bundling protein,23 suggesting that the Akt isoforms may be involved in isoform-specific protein-protein interactions, and thus impart distinct signaling events.12
Others have investigated the effect of Akt3 knockout on PyMT and ErbB2 models and failed to find striking effects for Akt3 on tumorigenesis or metastasis.24 These models may however not truly reflect the role of Akt3 in vivo as Akt3 was deleted in all tissues. Akt3 has been shown to contribute to tumor-stroma paracrine signaling, and hence these mouse models do not discriminate the tumor cell autonomous effects from the stromal effects of Akt3.11
This study and previous ones highlight the fact that Akt isoforms having opposing effects on cell proliferation, invasion and migration, and thus a more thoughtful and controlled approach should be taken in the clinical application of Akt inhibitors. As both N-cadherin and Akt3 may be potential targets for breast cancer treatment, our study contributes to the understanding of how drugs can be better developed to effectively treat breast cancer.
MATERIALS AND METHODS
Animals and generation of mammary tumor cells
The MMTV-PyMT and PyMT-N-cadherin mice have been previously described.25,26 Mammary tumor cells were isolated from PyMT-N-cad mice at 7 weeks post tumor onset.10 All animal experiments were performed according to a protocol approved by the institutional animal care and use committee at Albert Einstein College of Medicine.
Constructs, transfection and transduction
Full-length mouse N-cadherin complementary DNA was obtained from Dr Masatoshi Takeichi (Kyoto University, Japan). It was c-terminally tagged with Myc epitopes and subcloned into the pCXN2 vector and the pLXSN retroviral vector. N-cadherin inducible construct was generated by cloning full-length human N-cadherin into a tetracycline-repressible vector. The mouse Akt3 complementary DNA (1.4 kb) was PCR amplified from the pCMV6-Kna/Neo vector containing the complementary DNA (Origene) using forward primer: 5′-TCGCTCGAGATGAGCGATGTTAC CATTGTG-3′and reverse primer: 5′-CGATCTAGATTATTCCCGTCCGCTTGCA GA-3′; it was then cloned into the lentiviral expression plasmid pLVX-Puro (8.1 kb, Clontech) downstream of the cytomegalovirus promoter between the Xho1/Xba1 restriction sites. For production of shRNAmirs for mouse Akt3, three independent mouse Akt3 shRNAmirs in the pGIPZ lentiviral vector were purchased from Open Biosystems. A pGIPZ non-silencing shRNA mir vector along with Tat, Rev, Gag/Pol and VSV-G packaging vectors were obtained from Dr Jeffery Segall (Albert Einstein College of Medicine, NY, USA). The pcL-ampho packing vector was obtained from Dr Stuart Aaronson (Mount Sinai School of Medicine, NY, USA). Cells were transfected with appropriate retroviral vector using Lipofectamine LTX reagent. After 48 h, cells were selected with puromycin (2 μg/ml) or geneticin (400 μg/ml). To generate viruses, retroviral and lentiviral vectors were transfected into 293T cells with either the pCL-Ampho vector or Tat, Rev, Gag/Pol and VSV-G vectors, respectively, for 48 h. Viral supernatant was used to transduce cells that were selected with puromycin (2 mg/ml) or geneticin (400 μg/ml). Cells transduced with N-cad-Myc were further selected for N-cadherin expression by fluorescence-activated cell sorting using an N-cadherin antibody and conjugated secondary antibody (Invitrogen).
Western blot and immunoprecipiation
Protein (30 μg) was run on a 10% SDS-PAGE gel and transferred to polyvinylidene difluoride membrane. Blots were probed with appropriate primary antibodies and then incubated with horseradish peroxidase-conjugated secondary antibodies. Blots were developed with chemiluminescence. Akt3 immunoprecipitations were performed by incubating Akt3 antibody with cell lysates overnight at 4 °C with gentle rotation. The next day, protein G-agarose beads were added for 3 h, washed with 1% Triton lysis buffer and eluted in boiling 1 × SDS buffer. The antibodies used were as follows: N-cadherin or E-cadherin Akt1, Akt2, Akt3, p-Akt (Ser473), p-Akt (Thr308) p-ERK, ERK and P-FRS2 PyMT (Dr Steve Dillworth, Imperial College, London, UK); and Actin. Band intensity was quantified by ImageJ 1.34s (NIH, Bethesda, MD, USA). Statistical significance was determined using the two-tailed t-test at P-values <0.05.
Immunostaining
Cells attached to collagen-coated coverslips were fixed with 3.7% paraformaldehyde for 10 min, permeabilized with 0.02% Triton for 2 min and blocked with 2% bovine serum albumin buffer for 1 h, incubated with N-cadherin and E-cadherin primary antibodies for 1 h and then incubated with fluorescein isothiocyanate-conjugated and TRITC-conjugated secondary antibodies (Invitrogen) for 1 h. Images were taken using Axioskop 2 microscope.
Real time-PCR
RNA was isolated using Trizol reagent (Invitrogen) following the manufacturer’s protocol. Akt3 Taqman- primers and RNA-to-CT 1-Step Kit were purchased from Applied Biosystems, and real-time PCR experiments were performed using a StepOnePlus real-time PCR instrument from Applied Biosystems. GAPDH was used as reference gene and relative mRNA levels were determined using the 2(−ΔΔCt) method. Three independent experiments were performed. Statistical significance was tested by the two-tailed t-test at P-values <0.05.
Transwell migration assay
PyMT cells (5 × 10⁴) in 0.5 ml Dulbecco’s modified Eagle’s medium/0.2% bovine serum albumin were plated onto a 24-well transwell chamber with 8 mM pore size and allowed to migrate for 16 h. As chemoattractant, 10% fetal bovine serum/Dulbecco’s modified Eagle’s medium was used. Cells that did not migrate were wiped away, and cells that migrated were stained with 4,6-diamidino-2-phenylindole and imaged. Cells from seven × 20 microscopic fields were counted per chamber. Triplicates of three independent experiments were performed. Statistical significance by the two-tailed t-test was at P-values <0.05.
Cell viability assay
PyMT cells (0.4 × 10⁴) in 100 ml growth media were plated into 96-well plates for 5 days. Cell viability was assessed by using CellTiter-Blue reagent Briefly, CellTiter-Blue reagents were added to cells at indicated times for 1 h. Cell viability was then quantified by measuring the fluorescence signal emitted from the conversion of resazurin to resorufin in live cells, and was measured at excitation/emission wavelength of 560/590 nm. Background signal emitted from wells containing only culture medium were subtracted from experimental values.
Growth curves and BrdU incorporation
For growth kinetics, cells were plated in triplicate wells in six-well plates at 5 × 10⁴, and viable cells were trypsinized and counted each day for 8 days. The mean number of cells from triplicate wells ±s.e.m. is presented for each time point. P<0.05, two tailed t-test. For BrdU uptake, cells were grown on coverslips and 18 h later were pulsed with 10 μM of BrdU for 2 h. Cells were fixed and stained with anti-BrdU fluorescein isothiocyanate-coupled antibody. The percentage of BrdU-positive cells was determined in 10 fields of 500 cells per sample. The fraction of cells staining for BrdU was plotted as mean±s.e.m. in triplicates; P<0.05, two-tailed t-test.
Growth in Matrigel and immunostaining of acini
The embedding and growth of cells in Matrigel was performed as described.27 For immunostaining, cultures were fixed in 4% paraformaldehyde for 30 min, permeabilized in 0.5% Triton-X-100 for 5 min and blocked in 2% bovine serum albumin/phosphate-buffered saline. Acini were stained with Alexafluor594 phalloidin (Invitrogen) for 30 min at 1:500 dilution, followed by washes in phosphate-buffered saline, counterstained with 4,6-diamidino-2-phenylindoleI and imaged by confocal microscopy.
Time lapse assay
Cells were plated at low density on MatTek dishes (Ashland, MA, USA). At 6 h before the experiment, cells were serum starved. Cells were either treated with EGF (100 ng/ml) by micropipette or untreated. Cells were imaged at × 40 for 30 min at 1 min intervals with the Axiovision Rel 4.7 program. The movement of cells was measured using the NIS elements from Nikon. Statistical significance used two-tailed t-test with P-values <0.05.
Supplementary Material
Acknowledgments
This study was supported by grants from National Cancer Institute (Grant 1R01 CA135061-01A1) the NIH and Breast Cancer Research Foundation (to RB Hazan). Su Chung was partly supported by the Training Program in Cellular and Molecular Biology and Genetics (T32 GM007491).
Footnotes
CONFLICT OF INTEREST
The authors declare no conflict of interest.
Supplementary Information accompanies the paper on the Oncogene website (http://www.nature.com/onc)
References
- 1.Chambers AF, Groom AC, MacDonald IC. Dissemination and growth of cancer cells in metastatic sites. Nat Rev Cancer. 2002;2:563–572. doi: 10.1038/nrc865. [DOI] [PubMed] [Google Scholar]
- 2.Wheelock MJ, Johnson KR. Cadherins as modulators of cellular phenotype. Annu Rev Cell Dev Biol. 2003;19:207–235. doi: 10.1146/annurev.cellbio.19.011102.111135. [DOI] [PubMed] [Google Scholar]
- 3.Wheelock MJ, Johnson KR. Cadherin-mediated cellular signaling. Curr Opin Cell Biol. 2003;15:509–514. doi: 10.1016/s0955-0674(03)00101-7. [DOI] [PubMed] [Google Scholar]
- 4.Cavallaro U. N-cadherin as an invasion promoter: a novel target for antitumor therapy? Curr Opin Investig Drugs. 2004;5:1274–1278. [PubMed] [Google Scholar]
- 5.Hazan RB, Kang L, Whooley BP, Borgen PI. N-cadherin promotes adhesion between invasive breast cancer cells and the stroma. Cell Adhes Commun. 1997;4:399–411. doi: 10.3109/15419069709004457. [DOI] [PubMed] [Google Scholar]
- 6.Nagi C, Guttman M, Jaffer S, Qiao R, Keren R, Triana A, et al. N-cadherin expression in breast cancer: correlation with an aggressive histologic variant–invasive micropapillary carcinoma. Breast Cancer Res Treat. 2005;94:225–235. doi: 10.1007/s10549-005-7727-5. [DOI] [PubMed] [Google Scholar]
- 7.Nieman MT, Prudoff RS, Johnson KR, Wheelock MJ. N-cadherin promotes motility in human breast cancer cells regardless of their E-cadherin expression. J Cell Biol. 1999;147:631–644. doi: 10.1083/jcb.147.3.631. [DOI] [PMC free article] [PubMed] [Google Scholar]
- 8.Hazan RB, Phillips GR, Qiao RF, Norton L, Aaronson SA. Exogenous expression of N-cadherin in breast cancer cells induces cell migration, invasion, and metastasis. J Cell Biol. 2000;148:779–790. doi: 10.1083/jcb.148.4.779. [DOI] [PMC free article] [PubMed] [Google Scholar]
- 9.Suyama K, Shapiro I, Guttman M, Hazan RB. A signaling pathway leading to metastasis is controlled by N-cadherin and the FGF receptor. Cancer Cell. 2002;2:301–314. doi: 10.1016/s1535-6108(02)00150-2. [DOI] [PubMed] [Google Scholar]
- 10.Hulit J, Suyama K, Chung S, Keren R, Agiostratidou G, Shan W, et al. N-cadherin signaling potentiates mammary tumor metastasis via enhanced extracellular signal-regulated kinase activation. Cancer Res. 2007;67:3106–3116. doi: 10.1158/0008-5472.CAN-06-3401. [DOI] [PubMed] [Google Scholar]
- 11.Chin YR, Toker A. Function of Akt/PKB signaling to cell motility, invasion and the tumor stroma in cancer. Cell Signal. 2009;21:470–476. doi: 10.1016/j.cellsig.2008.11.015. [DOI] [PMC free article] [PubMed] [Google Scholar]
- 12.Dillon RL, Muller WJ. Distinct biological roles for the Akt family in mammary tumor progression. Cancer Res. 2010;70:4260–4264. doi: 10.1158/0008-5472.CAN-10-0266. [DOI] [PMC free article] [PubMed] [Google Scholar]
- 13.Irie HY, Pearline RV, Grueneberg D, Hsia M, Ravichandran P, Kothari N, et al. Distinct roles of Akt1 and Akt2 in regulating cell migration and epithelial-mesenchymal transition. J Cell Biol. 2005;171:1023–1034. doi: 10.1083/jcb.200505087. [DOI] [PMC free article] [PubMed] [Google Scholar]
- 14.Iliopoulos D, Polytarchou C, Hatziapostolou M, Kottakis F, Maroulakou IG, Struhl K, et al. MicroRNAs differentially regulated by Akt isoforms control EMT and stem cell renewal in cancer cells. Sci Signal. 2009;2:ra62. doi: 10.1126/scisignal.2000356. [DOI] [PMC free article] [PubMed] [Google Scholar]
- 15.Bellacosa A, Kumar CC, Di Cristofano A, Testa JR. Activation of AKT kinases in cancer: implications for therapeutic targeting. Adv Cancer Res. 2005;94:29–86. doi: 10.1016/S0065-230X(05)94002-5. [DOI] [PubMed] [Google Scholar]
- 16.Agiostratidou G, Li M, Suyama K, Badano I, Keren R, Chung S, et al. Loss of retinal cadherin facilitates mammary tumor progression and metastasis. Cancer Res. 2009;69:5030–5038. doi: 10.1158/0008-5472.CAN-08-4007. [DOI] [PMC free article] [PubMed] [Google Scholar]
- 17.Mohammadi M, Froum S, Hamby JM, Schroeder MC, Panek RL, Lu GH, et al. Crystal structure of an angiogenesis inhibitor bound to the FGF receptor tyrosine kinase domain. EMBO J. 1998;17:5896–5904. doi: 10.1093/emboj/17.20.5896. [DOI] [PMC free article] [PubMed] [Google Scholar]
- 18.Kouhara H, Hadari YR, Spivak-Kroizman T, Schilling J, Bar-Sagi D, Lax I, et al. A lipid-anchored Grb2-binding protein that links FGF-receptor activation to the Ras/MAPK signaling pathway. Cell. 1997;89:693–702. doi: 10.1016/s0092-8674(00)80252-4. [DOI] [PubMed] [Google Scholar]
- 19.Roccaro AM, Sacco A, Thompson B, Leleu X, Azab AK, Azab F, et al. MicroRNAs 15a and 16 regulate tumor proliferation in multiple myeloma. Blood. 2009;113:6669–6680. doi: 10.1182/blood-2009-01-198408. [DOI] [PMC free article] [PubMed] [Google Scholar]
- 20.Nogueira C, Kim KH, Sung H, Paraiso KH, Dannenberg JH, Bosenberg M, et al. Cooperative interactions of PTEN deficiency and RAS activation in melanoma metastasis. Oncogene. 2010;29:6222–6232. doi: 10.1038/onc.2010.349. [DOI] [PMC free article] [PubMed] [Google Scholar]
- 21.Toker A, Yoeli-Lerner M. Akt signaling and cancer: surviving but not moving on. Cancer Res. 2006;66:3963–3966. doi: 10.1158/0008-5472.CAN-06-0743. [DOI] [PubMed] [Google Scholar]
- 22.Brognard J, Sierecki E, Gao T, Newton AC. PHLPP and a second isoform, PHLPP2, differentially attenuate the amplitude of Akt signaling by regulating distinct Akt isoforms. Mol Cell. 2007;25:917–931. doi: 10.1016/j.molcel.2007.02.017. [DOI] [PubMed] [Google Scholar]
- 23.Chin YR, Toker A. The actin-bundling protein palladin is an Akt1-specific substrate that regulates breast cancer cell migration. Mol Cell. 2010;38:333–344. doi: 10.1016/j.molcel.2010.02.031. [DOI] [PMC free article] [PubMed] [Google Scholar]
- 24.Maroulakou IG, Oemler W, Naber SP, Tsichlis PN. Akt1 ablation inhibits, whereas Akt2 ablation accelerates, the development of mammary adenocarcinomas in mouse mammary tumor virus (MMTV)-ErbB2/neu and MMTV-polyoma middle T transgenic mice. Cancer Res. 2007;67:167–177. doi: 10.1158/0008-5472.CAN-06-3782. [DOI] [PubMed] [Google Scholar]
- 25.Guy CT, Cardiff RD, Muller WJ. Induction of mammary tumors by expression of polyomavirus middle T oncogene: a transgenic mouse model for metastatic disease. Mol Cell Biol. 1992;12:954–961. doi: 10.1128/mcb.12.3.954. [DOI] [PMC free article] [PubMed] [Google Scholar]
- 26.Agiostratidou G, Hulit J, Phillips GR, Hazan RB. Differential cadherin expression: potential markers for epithelial to mesenchymal transformation during tumor progression. J Mammary Gland Biol Neoplasia. 2007;12:127–133. doi: 10.1007/s10911-007-9044-6. [DOI] [PubMed] [Google Scholar]
- 27.Debnath J, Walker SJ, Brugge JS. Akt activation disrupts mammary acinar architecture and enhances proliferation in an mTOR-dependent manner. J Cell Biol. 2003;163:315–326. doi: 10.1083/jcb.200304159. [DOI] [PMC free article] [PubMed] [Google Scholar]
Associated Data
This section collects any data citations, data availability statements, or supplementary materials included in this article.