

Abstract
Airborne hexavalent chromium (Cr(VI)) is a known pulmonary carcinogen and can be emitted from both natural and anthropogenic sources, including diesel emissions. However, there is limited knowledge about ambient Cr(VI) concentration levels and its particle size distribution. This pilot study characterized ambient Cr(VI) concentrations in the New Jersey Meadowlands (NJ ML) district, which is close to the heavily trafficked New Jersey Turnpike (NJTPK) as well as Chromium Ore Processing Residue (COPR) waste sites. Monitoring was simultaneously conducted at two sites, William site (~50 m from NJTPK) and MERI site (~700 m from NJTPK). The distance between the two sites is approximately 6.2 km. Ambient Cr(VI) concentrations and PM2.5 mass concentrations were concurrently measured at both sites during summer and winter. The summer concentrations (mean ± S.D. [median]), 0.13 ± 0.06 [0.12] ng/m3 at the MERI site and 0.08 ± 0.05 [0.07] ng/m3 at the William site, were all significantly higher than the winter concentrations, 0.02 ± 0.01 [0.02] ng/m3 and 0.03 ± 0.01 [0.03] ng/m3 at the MERI and William sites, respectively. The site difference (i.e., MERI > William) was observed for summer Cr(VI) concentrations; however, no differences for winter and pooled datasets. These results suggest higher Cr(VI) concentrations may be attributed from stronger atmospheric reactions such as photo-oxidation of Cr(III) to Cr(VI) in the summer. The Cr(VI) distribution as a function of particle size, ranging from 0.18 to 18 μm, was determined at the William site. It was found that Cr(VI) was enriched in the particles less than 2.5 μm in diameter (PM2.5). This finding suggested potential health concerns, because PM2.5 are easily inhaled and deposited in the alveoli. A multiple linear regression analysis confirmed ambient Cr(VI) concentrations were significantly affected by meteorological factors (i.e., temperature and humidity) and reactive gases/particles (i.e., O3, Fe and Mn).
Keywords: Cr(VI), Hexavalent chromium, Particle size, Diesel traffic
1. Introduction
Chromium (Cr) exists, primarily as trivalent chromium (Cr(III)) and hexavalent chromium (Cr(VI)), in the environment. Cr(III), in trace level, is an essential nutrient for human health; in contrast, airborne Cr(VI) is a human carcinogen (Barceloux, 1999; Kimbrough et al., 1999). Exposure to airborne Cr(VI) at occupational settings has been associated with an increased risk of lung and nasal cancer (Kotas and Stasicka, 2000; Ashley et al., 2003; Pettine and Capri, 2005). Given its toxicity, Cr(VI) has been enlisted as one of the 188 hazardous air pollutants (HAPs), the 33 urban air toxics, and the 18 core HAPs by the US EPA. However, understanding of exposure to Cr(VI) in ambient air and associated health effects is still limited because ambient Cr(VI) data are dearth.
The major sources of environmental Cr(VI) include metal processing, coal burning, and fossil fuel emission (ATSDR, 2008; Barceloux, 1999; Kotas and Stasicka, 2000). In urban areas with heavy diesel traffics, vehicular emissions can significantly contribute to the increase of airborne Cr in ambient air, because Cr is among the top five most abundant metals in diesel particles (Wang et al., 2003). However, ambient Cr(VI) data are scarce in highly populated areas with heavy diesel traffic. Previous studies reported that elemental concentrations including Cr in ambient particles were higher in finer particle size (Hughes et al., 1998; Kimbrough et al., 1999). However, few studies have characterized the particle size distribution of Cr(VI) in ambient air. Airborne Cr(VI) is prone to be converted from Cr(III) in the atmosphere under the presence of transitional metals (Fe and Mn) (Seigneur and Constantino, 1995; Buerge and Hug, 1997; Zhang, 2000), reactive oxygen species (Huang et al., 2013; Torkmahalleh et al., 2013a) or high humidity (Torkmahalleh et al., 2012); however, the effects of these factors on Cr species conversion are not fully studied. Research is needed to accurately determine Cr(VI) concentrations, its particle size distribution as well as to understand environmental and meteorological factors in ambient air, which are vital for accurately assessing exposure to airborne Cr(VI) and associated health risks.
The New Jersey Meadowlands (NJ ML) district, which is located close to a major U.S. Highway (I-95) with high truck traffic volume (14,907 diesel-powered vehicles/day during study period), may have elevated atmospheric Cr(VI) concentration levels. Further, the NJ ML district is located only ~8 km from Kearny and ~16 km from Jersey City areas in Hudson County, NJ which have more than 200 historic Chromium Ore Processing Residue (COPR) waste sites (NJDEP, 2008a). The largest stationary emission source of ambient Cr in New Jersey, PSEG Fossil LLC Hudson Generation Station, is ~3.7 km southeast of the NJ ML district. A recent study conducted at the EOHSI (Environmental & Occupational Health Sciences Institute) found that Cr(VI) is enriched in 2.5 μm size soil particles (NJDEP, 2008b). Wind erosion of the soil could make Cr(VI)-contaminated soil particles airborne, and the fine particles contaminated with Cr(VI) may be transported to the NJ ML area. This study 1) determined Cr(VI) concentrations in PM2.5 in the NJ ML district, an area with mixed local Cr(VI) sources; 2) characterized Cr(VI) concentration distribution as a function of particle size; and 3) evaluated the impacts of environmental and meteorological factors on ambient Cr(VI) concentrations. The study provides baseline data of ambient Cr(VI) concentrations and its particle size distribution in a metropolitan area with heavy diesel traffic and historic COPR waste sites.
2. Methods
2.1. Study area
The NJ ML district is a general name for the large ecosystem of wetlands in northeast New Jersey. The district consists of roughly 8400 acres (34 km2) of open, undeveloped space and developed areas, which were previously part of the natural wetlands. The developed area is known for being the site of large landfills. The NJ ML area also includes a portion of Jersey City, where many historical COPR waste sites are located. In addition, the NJ ML district is located in the New York-Newark-Jersey City Metropolitan Area, the largest metropolitan statistical area in the U.S. with a total population of ~19 million in 2010 (US Census, 2012). The major road in the NJ ML district is the New Jersey Turnpike (I-95, hereafter referred to as NJTPK), a major highway in the U.S. connecting the metropolitan areas of New York and Philadelphia, with as many as ~700,000 vehicles transiting this highway per day.
2.2. Sampling sites
Two sampling sites were selected for this study. One site (i.e., William) was located approximately 50 m from the median strip of the NJTPK (Fig. 1) at ground level. Another site (hereafter referred to as MERI) was located at the rooftop of the Meadowlands Environmental Research Institute (MERI) building (~10 m above the ground), which is distant (~700 m) from the NJTPK (Fig. 1). The distance between the two sites is approximately 6.2 km. The William site represented the monitoring site for traffic-related air pollutants as no major anthropogenic emission sources (e.g., residential heating, wood burning, industrial emissions, etc.) were present within 800 m of the sampling site. A scaffolding platform, made of aluminum, was installed on the creek running parallel with NJTPK lane, and the sampling equipment sat on the aluminum platform at ground level. The MERI building is surrounded by marshes, creeks, swamps, and wet meadow. The sampling equipment sat on the roof of the MERI building covered with a black-colored polymer membrane.
Fig. 1.

The two sampling locations of ground-level William site, distant <50 m from the NJTPK, and roof top of MERI building, distant >700 m from the NJTPK (Route 95).
2.3. Field sampling
Pilot sampling for Cr(VI) only was conducted for three days (6/15/2009–6/17/2009) from both sites and intensive samplings for Cr(VI) and PM2.5 were conducted at both sites during the period of 8/4/2009 to 9/10/2009 (i.e., summer sampling) and 1/12/2010 to 3/2/2010 (i.e., winter sampling), respectively. Two co-located PM2.5 filters were collected for 24 h, i.e., from 8:00 am to 8:00 am next day, to determine Cr(VI) concentrations in a PM2.5 filter as well as PM2.5 mass concentration and elemental concentrations in another PM2.5 filter. To characterize Cr(VI) concentration by particle size, additional particle-size fractioned PM sampling was concurrently conducted for the two sampling campaigns. During the summer sampling period, three rounds of 72-h integrated PM sampling was conducted. During the winter sampling period, the sampling time increased from 72 h to 168 h to increase the sensitivity of Cr(VI) detection.
Existing sampling sites and equipment of the MERI’s Continuous Air Monitoring Program (http://meri.njmeadowlands.gov/projects/continuous-air-monitoring-program/) were utilized to collect PM samples for the measurement of airborne Cr(VI) concentration. The Partisol 2000 air sampler (Thermo Fisher Scientific, MA) was used to collect 24-h Cr(VI) in PM2.5. at both sites, and the Micro-Orifice Uniform Deposition Impactor (MOUDI 100, MSP Corp, MN) was used to collect Cr(VI) in 8 PM particle size fractions: 18–10, 10–5.6, 5.6–3.2, 3.2–1.8, 1.8–1.0, 1.0–0.56, 0.56–0.32, and 0.32–0.18 μm, respectively (Marple et al., 1991). To assist Cr(VI) characterization in the NJ ML district, regular PM2.5 sampling was concurrently conducted at the same sites, using the Federal Reference Method (40 CFR 50, Appendix L) with Partisol 2000 air samplers.
Prior to airborne Cr(VI) sampling, the mixed cellulose (MCE) filter was cleaned with nitric acid solution (10% HNO3) overnight, then pretreated with 20 mM sodium bicarbonate (NaHCO3) to make the Cr(VI) stable in collected particles. Stable isotope-enriched 50Cr(III) and 53Cr(VI) standard solutions (10 ng/mL each) (AIT, CA) were spiked onto the MCE filter before sampling to monitor any potential interconversion between Cr(III) and Cr(VI) during field trip, air sampling and sample analysis. Teflon filters were used to determine PM2.5 mass concentration and trace elements in PM2.5.
For quality assurance and quality control (QA/QC), ~10% lab blanks, ~10% field blanks, and ~5% duplicates were collected over the study period. The MCE filters were cleaned, spiked and stored in a freezer (<−16 °C) until sampling at the Environmental & Occupational Health Sciences Institute (EOHSI).
2.4. Sample analysis
2.4.1. Cr(VI) concentrations in PM2.5
Cr(VI) concentrations were determined by ion exchange chromatography-inductively coupled plasma mass spectrometry (IC-ICPMS), and the detailed method can be found in Meng et al. (2011). Briefly, the filter samples were extracted with 5 mL of pH = 4 nitric acid (Optima grade, Fisher Scientific, MA), and the final pH of the extract was 9–10 due to NaHCO3 left on the pretreated filter. The samples were sonicated for 40 min in a warm bath (60 °C), and the extract was filtered by a membrane syringe filter (GHP Acrodisc with 0.45 μm, Pall Corp, NY) and injected into IC (Dionex, Bannockburn, IL) equipped with a CG5A column for separation of Cr(III) and Cr(VI). The concentration of Cr species were determined by ICPMS, a VG PlasmaQuad PQIII system (VG Instruments, Winsford, UK). High purity natural abundance Cr(VI) and Cr(III) standards (High Purity Standards, SC) were used for quantification.
2.4.2. Inter-conversion of Cr species during sampling and extraction
The stability of Cr(VI) and Cr(III) is a major concern for Cr(VI) measurement. However, these interconversion issues and potential measurement biases were addressed in our previous lab and field studies (Huang et al., 2013, 2014). We have reported that predominant Cr(III) (99.9%) exist as insoluble form in PM matrix and any soluble Cr(III) quickly precipitates in the alkaline solution under our extraction conditions (pH = 9–10); thus oxidation of soluble Cr(III) to Cr(VI) was negligible in our current extract solution. On the other hand, potential reduction of Cr(VI) to Cr(III) is not significant, i.e., less than 6% based on our comprehensive field tests (Huang et al., 2014). Thus, the Cr(VI) concentrations quantified in this study were not expected to be significantly affected by potential interconversion between Cr(III) and Cr(VI) in air sampling and analytical processes.
2.4.3. PM2.5 mass concentrations and trace elements
The mass of co-located PM2.5 samples were determined by the Federal Reference Method (40 CFR 50, Appendix L). Concentrations of nine elements (Cd, Cr, Co, Cu, Fe, Mn, Ni, Pb and Zn; ng/m3) in co-located PM2.5 were determined by atomic absorption spectrometer (Varian SpectrAA-220, Santa Clara, CA) at the MERI chemical analysis lab. The selection of 9 elements in PM2.5 was based on concerns for toxicities and/or potential sources in the NJ ML district.
2.5. QA/QCs
QA/QC samples included ~10% field (N 6) and lab blanks (N = 6) and 5% co-located duplicate samples (N = 3 pairs). All blank results indicated there was no significant Cr contamination during either field sampling, sample storage or lab analysis. The RPD (relative percent difference) for the paired Cr(VI) concentrations at the William site was 16.6 ± 7.9% with a range of 7.6% and 22.3%. The Method Detection Limit (MDL) (40. CFR 136, Appendix B) was 0.016 ng/m3. Since Cr(VI) concentrations in field blanks were under detection, field blank subtraction was not conducted for all of the field samples.
2.6. Data collection
Meteorological data (temperature, pressure, relative humidity, wind speed, wind direction, and precipitation) were collected from a Partisol 2000 air sampler deployed at the MERI site during the sampling periods. Solar radiation data was obtained through MERI’s GIS website (http://meri.njmeadowlands.gov/gis/meri_gis/). The 15-min average temperature, pressure, relative humidity, solar radiation, wind speed and wind direction data were collected and averaged for the 24 h sampling time (i.e., 8:00 am to 8:00 am next date). The amount of precipitation was accumulated over the past 24 h.
Ambient air concentrations of O3, NOx and CO2 were acquired from the continuous monitors placed on the rooftop of the MERI building. The concentrations were averaged by the same sampling time.
Daily traffic counts on the NJTPK, passing the two sampling sites (i.e., between Exit 15 W–16 W for the MERI site and between Exit 16 W–18 W for the William site; see Fig. 1), were obtained from the New Jersey Turnpike Authority during the sampling period. North and south bound traffic were combined to calculate the total numbers of the passing vehicles. Traffic counts were classified into two categories: diesel-powered trucks and gasoline-powered vehicles. During the sampling period, an average traffic flow was 112,390/day (MERI site) and 78,278/day (William site) for gasoline-powered cars and 16,493/day (MERI site) and 13,321/day (William site) for diesel-powered trucks. The percent of diesel-powered trucks over all passing vehicles on NJTPK was similar at two sites (MERI site, ~14.7% and William site, ~17.0%).
Descriptive statistics for meteorological data, ambient air concentrations and daily traffic counts are provided in Table 1.
Table 1.
Descriptive statistics for meteorological data and ambient air pollutant concentrations concurrently monitored in NJ Meadowlands district.
| Variables | Unit | N | Avg. ± SD | Min | Med | Max |
|---|---|---|---|---|---|---|
| Temperature | °C | 34 | 12.7 ± 11.9 | −2.73 | 17.3 | 28.8 |
| Relative humidity | % | 34 | 64.0 ± 9.96 | 43.7 | 64.5 | 83.3 |
| Solar radiation | W/m2 | 34 | 56.3 ± 42.1 | 0.03 | 50.4 | 185 |
| Precipitation | in | 34 | 0.03 ± 0.09 | 0.00 | 0.00 | 0.83 |
| Wind speed | m/s | 34 | 2.95 ± 1.44 | 1.34 | 2.44 | 6.23 |
| Wind direction | degrees | 34 | 205 ± 76.6 | 41 | 236 | 312 |
| Pressure | mmHg | 34 | 762 ± 4.68 | 749 | 763 | 769 |
| O3 | ppb | 34 | 18.6 ± 8.89 | 2.50 | 19.8 | 39.2 |
| CO2 | ppb | 34 | 393 ± 24.8 | 346 | 389 | 461 |
| NOx | ppb | 34 | 30.4 ± 29.1 | 9.50 | 20.0 | 139 |
| Gasoline | ||||||
| MERI | #/day | 34 | 112,390 ± 9589 | 98,273 | 112,042 | 134,809 |
| William | #/day | 30 | 78,278 ± 7749 | 67,974 | 78,425 | 95,752 |
| Diesel | ||||||
| MERI | #/day | 34 | 16,493 ± 1060 | 13,083 | 16,618 | 18,294 |
| William | #/day | 30 | 13,321 ± 1063 | 10,089 | 13,487 | 15,002 |
2.7. Data analysis
2.7.1. Descriptive statistics and group comparisons
Due to right-tailed in Cr(VI) concentrations, the log-transformed Cr(VI) concentrations, which were found to be normally distributed (ShapiroeWilk test; p > 0.05), we used for data analysis. Elemental concentrations were blank subtracted and non-detected values were substituted with a half of each MDL prior to statistical analyses. All nine elements were detected over 75%; therefore, the substitution of non-detects with MDLs would not significantly affect the statistical results. The ambient Cr(VI) concentrations, pooled from the two sites, were used for both correlation and linear regression analyses to increase the power of statistical detections.
Descriptive statistics were performed to characterize the distribution of measured Cr(VI) concentrations for the summer and winter seasons. One-sample t-test was conducted to compare the determined Cr(VI) in the study area with an average from other urban NJ site and nationwide datasets. Student’s t-test was conducted to compare the mean differences between the two study locations (MERI site vs. William site) and the two sampling seasons (summer vs. winter). A Spearman correlation (rs) was calculated to examine associations among Cr(VI) and nine elements in PM2.5, as well as relationships for Cr(VI) and PM2.5 mass concentrations with meteorological variables (e.g., relative humidity, solar radiation, temperature, etc.) and co-air pollutant concentrations (i.e., O3, CO2, NOx). All statistical analyses were conducted using the SAS program version 9.3 (Cary, NC).
2.7.2. Multiple linear regression analysis
A multiple linear regression model was developed to estimate the contribution of diesel/gasoline-powered vehicle counts to Cr(VI) concentrations as well as the impact of meteorological factors, ambient co-pollutants (O3, CO2, and NOx), interested metal concentrations (Cu, Cr, Fe, Mn, Ni and Pb) and PM2.5 mass concentrations on the Cr(VI) concentrations. The co-pollutants were simultaneously measured at the MERI site, and the transitional metal concentrations and PM2.5 mass concentrations were concurrently measured with co-located Cr(VI) concentrations. The development of a multiple linear regression model was based on the equation,
where, Yi is a log-transformed Cr(VI) concentration in ambient air;
β0 is an intercept estimate
β1–β20 are model parameter estimates; and
Xi1–Xi20 are model predicting variables, including vehicle counts (gasoline and diesel-powered vehicles), meteorological factors (i.e., temperature, relative humidity, precipitation, pressure, solar radiation, wind speed and categorical wind directions of upwind, downwind and parallel), ambient gaseous co-air pollutant concentrations (i.e., O3, CO2 and NOx); interested elemental concentrations in PM2.5 (i.e., Cr, Cu, Fe, Mn, Ni and Pb) and PM2.5 mass concentrations.
For wind direction data (continuous variable as degrees), categorical variables of upwind, downwind and parallel from the NJTPK were assigned as follows: upwind (<30° and >240°), parallel (between 30 and 60° and between 210 and 240°), and downwind (between 60 and 210°). The categorical wind direction variables were replaced with numeric dummy variables and used in SAS’s REG procedure. Among the 20 candidate variables, six variables (temperature, relative humidity, downwind direction, O3, Fe and Mn) were selected by SAS’s forward/backward selection methods.
Multi-colinearity for the six predicting variables was examined to check the effect of correlation among variables. No significant correlations were observed among predicting variables in the final regression model. Tests on equal variance, independence and normality for residuals, were employed to check the assumptions of the linear regression model.
3. Results and discussion
3.1. Ambient Cr(VI) concentrations in NJ ML district
Cr(VI) concentrations and co-located PM2.5 mass concentrations measured at the two monitoring sites for both summer and winter seasons are presented in Figs. 2 and 3, respectively. The Cr(VI) was detected in all of the field samples (N = 64) and 8% of these results were below the MDL (0.016 ng/m3). During summer 2009, the ambient Cr(VI) concentration (mean ± SD [range]) was 0.128 ± 0.064 [0.021–0.267] ng/m3 at the MERI site and 0.081 ± 0.046 [0.033–0.211] ng/m3 at the William site. In winter 2010, the concentrations were 0.024 ± 0.008 [0.014–0.047] ng/m3 and 0.027 ± 0.011 [0.011–0.048] ng/m3 at the MERI and William sites, respectively. The measured Cr(VI) concentrations in the NJ ML district were compared to Cr(VI) concentrations measured at the New Jersey Department of Environmental Protection’s Elizabeth monitoring site, which is located right next to Exit 13 of the NJTPK and approximately ~21 km SW from the NJ ML district (Torkmahalleh et al., 2013b). The Cr(VI) concentrations measured at the Elizabeth site (0.051 ± 0.07 ng/m3 for two summer seasons in 2011/2012 (N = 39) and 0.019 ± 0.009 ng/m3 for the winter in 2012 (N = 15), respectively) were significantly lower than the NJ ML concentrations (one-sample t-test; p < 0.01 for both seasons). In addition, we compared the results with nationwide levels measured at 22 sites including urban, suburban and rural areas in U.S. (US EPA, 2013). The Cr(VI) concentrations were reported to be 0.024 ± 0.026 [0.001–0.268] ng/m3 (N 1068 in 2011), which were also significantly lower than the NJ ML= measurements (p < 0.01). Therefore, besides the nearby vehicular emissions, there is a possibility of additional Cr(VI) sources in the study area.
Fig. 2.

The ambient Cr(VI) concentrations at MERI and William sites during summer and winter seasons in NJ Meadowlands district.
Fig. 3.

The ambient PM2.5 mass concentrations at MERI and William sites during summer and winter seasons in NJ Meadowlands district.
3.1.1. Season comparison (summer vs. winter)
The summer Cr(VI) concentrations were more than 4 times higher than the winter concentrations (Student’s t-test; p < 0.05). Previous studies reported similar seasonal patterns in ambient Cr(VI) concentration (ERG, 2006; NJDEP, 2010). The stronger photo-oxidation of Cr(III) to Cr(VI) in summer season was suggested to increase Cr(VI) concentrations significantly (Nusko and Heumann, 1997). This seasonal trend was consistent to both sites (p = 0.01 for the William site and p = 0.02 for the MERI site; Fig. 2). In the study area, PM = 2.5 mass concentrations were also found to be significantly higher (1.6 times) in the summer than in the winter (p < 0.05 for both sites; Fig. 3). The emission of PM2.5 from mobile sources is usually higher in winter than in summer due to incomplete combustion at cold temperature and a longer warm-up time of the vehicles (Gertler et al., 2000; Zhu et al., 2004; Chen et al., 2007). However, our results, i.e., higher PM2.5 concentrations in the summer than in the winter, suggested secondary aerosol formation as the dominant sources in the area. In addition, we found a significant positive correlation between PM2.5 mass and relative humidity (rs = 0.31; p = 0.02) and a negative correlation between PM2.5 mass and solar radiation (rs = 0.18; p = 0.19) in the study period. This suggests a possibility of accumulation = of PM2.5 in hot humid conditions (such as cloudy or foggy days) that increased PM2.5 mass concentrations in the area (Jung et al., 2011).
3.1.2. Site comparison (MERI vs. William)
The site difference i.e., MERI vs. William, was not significant either in the pooled (Student’s t-test, p = 0.40) or winter datasets (p = 0.48); however, in summer data, Cr(VI) concentrations at the MERI site were significantly higher than that at the William site (p = 0.04; Fig. 2). As suggested by previous studies (Nusko and Heumann, 1997; Kimbrough et al., 1999), photochemical reactions can be dominant sources of Cr(VI) in ambient air. The magnitude of photochemistry can be different by the elevation of measured locations and surrounding environments (e.g., surface color and material). In general, solar radiation is stronger at higher altitude (15–20% change per 1 km; Blumthaler et al., 1997), and the absorbed solar radiation is approximately 2–4 times higher on dark surface than on shining surface as well as it varies by surface material type (http://www.engineeringtoolbox.com/solar-radiation-absorbed-materials-d_1568.html). The sampler for the William site was located on shining aluminum-floored platform at ground level; the sampler for the MERI site was located on a black-colored polymer membrane at the rooftop of the MERI building. Therefore, solar radiation can be significantly stronger at the MERI site than the William site; thus, higher Cr(VI) can occur by photo-oxidation in the atmosphere during the sampling time, especially in the summer. We collected concurrent solar radiation data, but only from the MERI building due to logistical limitations. Further Cr(VI) and solar radiation measurements at each sampling site is suggested to verify this observation.
The PM2.5 concentrations were higher at the William site than the MERI building for the pooled (p < 0.01) or season-specific datasets (p = 0.01 for summer and p = 0.04 for winter; Fig. 3). The expected higher PM2.5 mass concentrations measured at the William site, distant <50 m from the NJTPK, likely resulted from the heavy traffic emissions on the nearby NJTPK. Jung et al. (2011) observed significant drop in PM2.5 mass concentrations with the two distances (i.e., 50 vs. 100 m) from the NJTPK at the same William site. Considering the MERI site is distant from the NJTPK compared to the William site, we expected lower PM2.5 mass concentrations at the MERI site than at the William site. Many studies (Janssen et al., 1997; Hitchins et al., 2000; Cyrys et al., 2003; Zhu et al., 2004) reported PM2.5 mass concentrations decreased with increasing distance to major roads; however, the trend was not significant or weak in other studies (Roorda-Knape et al., 1998; Wu et al., 2002).
3.2. Cr(VI) concentration by particle size
The particle size distribution in Cr(VI) concentrations is illustrated in Fig. 4. Since Cr(VI) concentrations measured by a MOUDI for most winter samples were lower than the MDL (<0.016 ng/m3), the winter measurements were not included in this analysis. The general trend was that Cr(VI) concentrations were higher in the particle size between 1.0 and 5.6 μm than in other size fractions, and the peak Cr(VI) concentrations were found around the particle size of 2.5 μm. However, in the second round, Cr(VI) concentrations in the particle size fractions of 3.2–5.6 μm and 5.6–10 μm were higher than in the other size fractions. When compared meteorological data between in the period of second round and in the period of first and third rounds, we noticed one rainy day (i.e., 8/12/2009 with precipitation of 0.33 inches) during the second sampling period and approximately 13% higher relative humidity in the second period (77.6%) than in the first and third sampling periods (64.4%). High relative humidity may facilitate particle growth through condensation processes in atmosphere (Svenningsson et al., 1992). A Spearman correlation indicated that Cr(VI) concentrations were significantly correlated with O3 concentrations (rs = 0.45; p < 0.01), suggesting that photochemical reactions may lead to the formation of Cr(VI) in fine particle fractions. O3-related chemistry, such as the formation of radicals, may lead to the formation of Cr(VI) in ambient air (Werner et al., 2006; Nico et al., 2009; Torkmahalleh et al., 2013a).
Fig. 4.
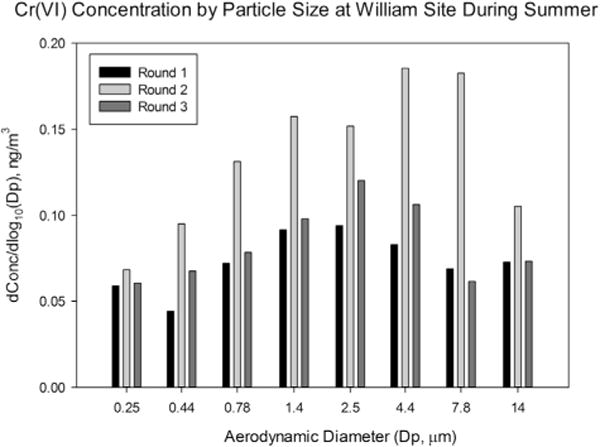
The ambient Cr(VI) concentrations as a function of particle size by a MOUDI sampling at the William site within 50 m distant from the heavy trafficked NJTPK.
The particle size distribution of ambient Cr(VI) concentration was consistent with our Cr(VI) measurements for soils collected from the historic COPR sites in Jersey City. The Cr(VI) concentrations were significantly concentrated in soils fractioned below 2.5 μm than other coarse sizes (NJDEP, 2008b), indicating a possibility of the potential contribution of airborne Cr(VI) particles from COPR sites in nearby Jersey City, located about 16 km upwind from the NJ ML district. However, a thorough source apportionment (e.g., Chemical Mass Balance model) is needed to accurately estimate the contribution of airborne Cr(VI) particles from COPR sites to PM air pollution in the area. Nonetheless, higher Cr(VI) concentration in PM2.5 may pose greater risks, considering smaller particles (generally median diameter of 0.2–2.0 μm) can penetrate into lower lung airways (Brunekreef and Holgate, 2002; Chung et al., 2003). Thus, further studies with more size-fractioned measurements are necessary to confirm the observation obtained from this study.
3.3. Associations between Cr(VI) and elements in PM2.5
The concentration of the nine additional elements were determined in co-located PM2.5 filters (N = 53) and the descriptive statistics are provided in Table 2. Spearman correlation coefficients (rs) were calculated for the elements (ng/m3) in PM2.5 filters with Cr(VI) concentrations (ng/m3) in co-located PM2.5 filters (see Table 2). The result showed Cr(VI) had positive correlations with Mn and Pb (p < 0.05). Mn played a crucial role in oxidizing Cr(III) to Cr(VI) in ambient air (Seigneur and Constantino, 1995; Nico and Zasoski, 2000). Pb is one of intermediate elements to promote an oxidation of Cr(III) to Cr(VI) in ambient air (Seigneur and Constantino, 1995). However other elements, including total Cr, were not significantly correlated with ambient Cr-VI concentrations. This implied that ambient Cr(VI) concentrations were not solely determined by the concentration of total Cr in ambient particles. In our previous urban air toxics study in Paterson (NJ), we also found no significant correlation between Cr(VI) and total Cr in PM10 samples (Meng et al., 2011). The overall variability in airborne Cr(VI) was further examined by elements in PM2.5, including total Cr and transitional metals such as Cu, Fe, Ni (reductant of Cr(VI) to Cr(III)), Mn and Pb (oxidizer of Cr(III) to Cr(VI)) in the regression model.
Table 2.
Analyzed elemental concentrations (ng/mg; N = 53) in PM2.5 filters and Spearman correlation coefficients with Cr(VI) concentrations in NJ Meadowlands district.
| Elements | Concentration (ng/m3)
|
Spearman correlation coefficients with Cr(VI) | |||||
|---|---|---|---|---|---|---|---|
| AVG | SD | Min | Med | Max | % Detected | ||
| Cd | 0.16 | 0.11 | 0.01 | 0.13 | 0.56 | 98 | −0.02 |
| Cr | 1.88 | 1.26 | 0.32 | 1.46 | 4.75 | 94 | 0.13 |
| Co | 0.33 | 0.32 | <0.01 | 0.25 | 1.22 | 79 | 0.01 |
| Cu | 12.82 | 14.84 | 0.59 | 8.01 | 98.45 | 98 | 0.13 |
| Fe | 259.12 | 228.73 | 10.39 | 178.15 | 1008.38 | 100 | 0.22 |
| Mn | 7.85 | 4.04 | 0.49 | 8.25 | 19.83 | 100 | 0.45 |
| Ni | 4.80 | 8.33 | 0.09 | 2.25 | 46.76 | 96 | 0.01 |
| Pb | 1.77 | 1.69 | 0.05 | 1.20 | 7.74 | 98 | 0.36 |
| Zn | 70.21 | 28.92 | 19.00 | 66.29 | 206.54 | 100 | 0.06 |
Note: Bold (p < 0.05).
3.4. Effects of vehicular traffic and environmental factors on ambient Cr(VI) concentrations
The effects of vehicular emissions from the adjacent NJTPK and various environmental factors were examined on ambient Cr(VI) concentrations in the NJ ML district. The final six independent explanatory variables are provided in Table 3.
Table 3.
The final multiple linear regression models to predict Cr(VI) concentrations measured in NJ Meadowlands district.
| Parameter estimate | Standardized estimate | P-value | Model/partial R2 | |
|---|---|---|---|---|
| ML (N = 64) | <0.0001 | 0.8080 (0.7829) | ||
| Intercept | −5.7835 | 0 | <0.0001 | – |
| Temperature | 0.0450 | 0.6302 | <0.0001 | 0.6779 |
| Relative humidity | 0.0277 | 0.3076 | 0.0005 | 0.0321 |
| Downwind direction | 0.5689 | 0.2267 | 0.0015 | 0.0311 |
| O3 | 0.0262 | 0.2655 | 0.0119 | 0.0259 |
| Fe | 0.0013 | 0.3328 | 0.0032 | 0.0114 |
| Mn | −0.0692 | −0.3261 | 0.0106 | 0.0296 |
R2 value in parenthesis means the adjusted R2 in the model.
In the NJ ML district, the developed regression model explained approximately 81% of the overall variability in Cr(VI) concentrations. All of the six variables were significant in the model (p < 0.05). The variable of temperature was the most significant and dominant factor (approximately 68%) in explaining the variability of Cr(VI) concentrations measured in the NJ ML district. The standardized estimates also indicated the variable of temperature was the most significant factor for the predicted Cr(VI) concentrations. Previous studies reported a seasonal trend of ambient Cr(VI) concentration, i.e., higher in the summer than in the winter (Nusko and Heumann, 1997; ERG, 2006; NJDEP, 2010; Meng et al., 2011), which is consistent with our findings. In the hot summer season, most chemical reactions are faster at higher temperature; thus photochemical reactions are dominant processes in the atmosphere. We found a positive correlation between Cr(VI) and O3 concentrations (p < 0.01), indicating photochemical reactions might contribute to Cr(VI) in the summer season. Seigneur and Constantino (1995) suggested the possibility of chemical kinetic mechanism for atmospheric Cr under the presence of metals (As, Fe, Mn, V) and SO2 which are common in the atmosphere. Huang et al. (2013) conducted a controlled chamber study for the stability of Cr(VI) on freshly-generated diesel particulate matter (DPM) and secondary organic aerosols (SOA) spiked with 53Cr(VI) and 50Cr(III). The authors found reactive oxygen species (ROS) in SOA could oxidize 50Cr(III) to 50Cr(VI) even in dark conditions. Torkmahalleh et al. (2013a) conducted a chamber study to examine Cr species changes in the presence of O3 and ROS at low relative humidity (RH = 10%). The authors found O3 and ROS led to some oxidation of Cr(III) to Cr(VI) after a few hours and the oxidation of Cr(III) slowed as the temperature decreased. Therefore, high temperature during the summer, implying stronger photochemical reactions in atmosphere, would increase Cr(VI) concentrations in ambient air.
Relative humidity was the second most significant factor (approximately 3.2%) in explaining the variability of Cr(VI) concentrations. The deliquescence of relative humidity was identified as the important factor governing the solubility of Cr(VI) in ambient particles (Torkmahalleh et al., 2012). Huang et al. (2013) also demonstrated the promotion of Cr(III) oxidation with an increase of relative humidity from 40 to 70% for DPM and SOA particles spiked with 50Cr(III) and 53Cr(VI) in the study. At 70% of relative humidity, 50Cr(III) may deliquesce and the resulting water would facilitate 50Cr(III) oxidation to 50Cr(VI); furthermore, aqueous 53Cr(VI) reduction to 53Cr(III) would not occur at that level. Torkmahalleh et al. (2012) showed significant reduction of Cr(VI) to Cr(III) (up to 33%) occurred on the collected particles when the RH was over 96% during the air sampling period (usually after sunset and before sun rise).
The third significant factor was downwind direction (approximately 3.1%), which was associated with primary wind direction for each sampling day. The remaining fourth through sixth variables were O3, Mn and Fe, which represent reactive gases and particles in ambient air (approximately 6.7% combined). These variables are consistent with fundamental knowledge in atmospheric chemistry. O3 was suggested as an oxidizing agent to be likely increasing Cr(VI) concentration by oxidizing Cr(III) to Cr(VI) (Kimbrough et al., 1999). Mn (Seigneur and Constantino, 1995; Nico and Zasoski, 2000) and Fe (Pettine et al., 1998; Goshu et al., 2007) are important intermediates in the oxidation and reduction of Cr species in ambient particles.
Based on multiple linear regression results, traffic-related variables (i.e., downwind direction, vehicle counts, NOx, etc.) had less impacts on Cr(VI) concentrations when compared to meteorological factors (i.e., temperature and humidity) and atmospheric reactions (i.e., O3, Fe and Mn concentrations). These results indicate that the concentration of Cr(VI) in the study area was significantly affected by photochemical reactions as suggested by significantly associated variables of temperature, O3, Fe and Mn in the model. The photochemical reaction, promoted by water vapors in ambient air under humid conditions (i.e., high relative humidity), could facilitate the increase of Cr(VI) concentrations in ambient air.
3.5. Study limitations and future research
This study determined airborne Cr(VI) concentrations, characterized its particle size distribution, and examined the major factors contributing to Cr(VI) in the NJ ML district, a part of the New York-Newark-Jersey City Metropolitan Area. However, this study was limited to small number of samples (30–34 Cr(VI) measurements for each monitoring location and three rounds of Cr(VI) particle size distribution during the summer). Thus, a longer period of Cr(VI) monitoring from more sites as well as a larger number of particle size-fractioned Cr(VI) measurements would be suggested to confirm the study findings drawn from this pilot study results. Furthermore, atmospheric reactions and physicochemical factors governing the interconversion of Cr species in airborne PM are not fully studied. Thus, more research, such as concurrent measurements of solar radiation, ROS, O3, and transitional metals in particles such as As, Fe, Mn, V, etc, that are related to Cr(VI) formation and interconversion, is needed to better understand Cr(VI) behaviors in the atmosphere as well as to verify findings obtained in this pilot study.
4. Conclusions
This study determined airborne Cr(VI) concentration at two locations in NJ ML district in summer and winter seasons. Significant seasonal differences (summer > winter) were observed in NJ ML district, and the site difference was significant (MERI > William) in summer time. The Cr(VI) concentration by particle size indicated that Cr(VI) was more concentrated in PM2.5 than in PM2.5–10. The multiple linear regression analysis confirmed that the Cr(VI) concentrations were significantly affected by temperature and relative humidity as well as by oxidizing agents such as O3 and Mn (i.e., hot summer time) and a reducing agent (e.g., Fe) in ambient air. Overall study findings indicated that Cr(VI) concentrations were more significantly impacted by meteorological factors than traffic from nearby NJTPK. This study provides valuable baseline data to understand Cr(VI) air pollution in the area with mixed Cr(VI) sources, including heavy trafficked highways and historical COPR waste sites. However, to fully characterize Cr(VI) seasonal variations and to clearly understand the factors contributing to Cr(VI) in NJ ML area, further studies are needed with longer monitoring period up to one year. Also a source-receptor modeling (e.g., Chemical Mass Balance analysis) is needed to identify contributing sources in NJ ML area with mixed local Cr(VI) sources.
HIGHLIGHTS.
Cr(VI) concentrations were more concentrated in fine than in coarse size fraction.
Cr(VI) concentrations were significantly affected by temperature and humidity.
Cr(VI) concentrations were more impacted by meteorological factors than traffics.
Acknowledgments
This study is supported by the EPA Agreement # XA-97268501 and XA-97247301, and partially supported by NJ Meadowlands Commission (Contract # MOA-10151) and the NIEHS sponsored Rutgers Center for Environmental Exposures and Disease, Grant # NIEHS P30ES005022.
References
- Ashley K, Howe AM, Demange M, Nygren O. Sampling and analysis considerations for the determination of hexavalent chromium in workplace air. J Environ Monit. 2003;5:707–716. doi: 10.1039/b306105c. [DOI] [PubMed] [Google Scholar]
- ATSDR. Toxicological Profile for Chromium. U.S. Department of Health and Human Services; Atlanta, GA: 2008. [Google Scholar]
- Barceloux DG. Chromium Clin Toxicol. 1999;37:173–194. doi: 10.1081/clt-100102418. [DOI] [PubMed] [Google Scholar]
- Blumthaler M, Ambach W, Ellinger R. Increase in solar UV radiation with altitude. J Photochem Photobiol B. 1997;39:130–134. [Google Scholar]
- Brunekreef B, Holgate ST. Air pollution and health. Lancet. 2002;360:1233–e1242. doi: 10.1016/S0140-6736(02)11274-8. [DOI] [PubMed] [Google Scholar]
- Buerge IJ, Hug SJ. Kinetics and pH dependence of chromium(VI) reduction by iron(II) Environ Sci Technol. 1997;31:1426–1432. [Google Scholar]
- Chen LWA, Watson JG, Chow JC, Magliano KL. Quantifying PM2.5 source contributions for the San Joaquin Valley with multivariate receptor models. Environ Sci Technol. 2007;41:2818–2826. doi: 10.1021/es0525105. [DOI] [PubMed] [Google Scholar]
- Chung A, Brauer M, Avila-Casado MC, Fortoul TI, Wright JL. Chronic exposure to high levels of particulate air pollution and small airway remodeling. Environ Health Perspect. 2003;111(5):714–718. doi: 10.1289/ehp.6042. [DOI] [PMC free article] [PubMed] [Google Scholar]
- Cyrys J, Heinrich J, Hoek G, Meliefste K, Lewne M, Gehring U, Bellander T, Fischer P, Vilet PV, Brauer M, Wichmann HE, Brunekreef B. Comparison between different traffic-related particle indicators: elemental carbon (EC), PM2.5 mass, and absorbance. J Expo Sci Environ Epidemiol. 2003;13:134–143. doi: 10.1038/sj.jea.7500262. [DOI] [PubMed] [Google Scholar]
- EngineeringToolBox. http://www.engineeringtoolbox.com/solar-radiation-absorbed-materials-d_1568.html (accessed 03.18.14.).
- ERG. Collection and Analysis of Hexavalent Chromium in Ambient Air Office of Air Quality Planning and Standards. U.S. Environmental Protection Agency; Research Triangle Park, NC: 2006. [Google Scholar]
- Gertler AW, Gillies JA, Pierson WR. An assessment of the mobile source contribution to PM10 and PM2.5 in the United States. Water Air Soil Pollut. 2000;123:203–214. [Google Scholar]
- Goshu IV, Tsarev V, Kostrov VV. Study of chromium(VI) reduction in the presence of metal salt additives. Russ J Appl Chem. 2007;80(12):2024–2027. [Google Scholar]
- Hitchins J, Morawska L, Wolff R, Gilbert D. Concentrations of sub-micrometer particles from vehicles emissions near a major road. Atmos Environ. 2000;34:51–59. [Google Scholar]
- Huang L, Fan Z, Yu CH, Hopke PK, Lioy PJ, Buckley BT, Lin L, Ma Y. Interconversion of chromium species during air sampling: effects of O3, NO2, SO2, particle matrices, temperature, and humidity. Environ Sci Technol. 2013;47:4408–4415. doi: 10.1021/es3046247. [DOI] [PMC free article] [PubMed] [Google Scholar]
- Huang L, Yu CH, Hopke PK, Lioy PJ, Buckley BT, Shin JY, Fan Z. Measurement of soluble and total hexavalent chromium in the ambient airborne particles in New Jersey. Aerosol Air Qual Res. 2014 doi: 10.4209/aaqr.2013.10.0312. http://dx.doi.org/10.4209/aaqr.2013.10.0312, advance online publication. [DOI] [PMC free article] [PubMed]
- Hughes LS, Cass GR, Gone J, Ames M, Olmez I. Physical and chemical characterization of atmospheric ultrafine particles in the Los Angeles area. Environ Sci Technol. 1998;32:1153–1161. [Google Scholar]
- Janssen NAH, Mansom DFMV, Jagt KVD, Harssema H, Hoek G. Mass concentration and elemental composition of airborne particulate matter at street and background locations. Atmos Environ. 1997;31:1185–1193. [Google Scholar]
- Jung KH, Artigas F, Shin JY. Seasonal gradient patterns of polycyclic aromatic hydrocarbons and particulate matter concentrations near a highway. Atmosphere. 2011;2:533–552. [Google Scholar]
- Kimbrough DE, Cohen Y, Winer AM, Creeman L, Mabuni C. A critical assessment of chromium in the environment. Crit Rev Environ Sci Technol. 1999;29:1–46. [Google Scholar]
- Kotas J, Stasicka Z. Chromium occurrence in the environment and methods of its speciation. Environ Pollut. 2000;107:263–283. doi: 10.1016/s0269-7491(99)00168-2. [DOI] [PubMed] [Google Scholar]
- Marple VA, Rubow KL, Behm SM. A microorifice uniform impactor (MOUDI): description, calibration, and use. Aerosol Sci Technol. 1991;14:434–446. [Google Scholar]
- Meng Q, Fan Z, Buckley B, Lin L, Huang L, Yu CH, Stiles R, Bonanno L. Development and evaluation of a sampling and analytical method for the measurement of hexavalent chromium in ambient air. Atmos Environ. 2011;45:2021–2027. [Google Scholar]
- MERI Continuous Air Monitoring Program. http://meri.njmeadowlands.gov/projects/continuous-air-monitoring-program/ (accessed 03.18.14.).
- MERI GIS Website. http://meri.njmeadowlands.gov/gis/meri_gis/ (accessed 03.18.14).
- Nico PS, Zasoski RJ. Importance of Mn(II) availability of Cr(III) oxidation on d-MnO2. Environ Sci Technol. 2000;38:5253–5260. [Google Scholar]
- Nico PS, Kumfer BM, Kennedy IM, Anastasio C. Redox dynamics of mixed metal (Mn, Cr, and Fe) ultrafine particles. Aerosol Sci Technol. 2009;43:60–70. doi: 10.1080/02786820802482528. [DOI] [PMC free article] [PubMed] [Google Scholar]
- NJDEP. Final Report to New Jersey Department of Environmental Protection. Trenton, NJ: 2008a. Chromium Exposure and Health Effects in Hudson County: Phase I. http://www.state.nj.us/dep/dsr/chromium/chromium_final_report_hudson_county_phase1.pdf. [Google Scholar]
- NJDEP. Final Report to New Jersey Department of Environmental Protection. Trenton, NJ: 2008b. The Distribution of Chromium Species as a Function of Particle Size for Chromium Waste Laden Soils. http://www.state.nj.us/dep/dsr/chromium/cr%20speciation%20rpt-09262008-final.pdf. [Google Scholar]
- NJDEP. Final Report to New Jersey Department of Environmental Protection. Trenton, NJ: 2010. Urban Community Air Toxics Monitoring Project, Paterson City, NJ (UCAMPP) http://www.state.nj.us/dep/dsr/paterson-study/paterson-report.pdf. [Google Scholar]
- Nusko R, Heumann KG. Cr(III)/Cr(VI) speciation in aerosol particles by extractive separation and thermal ionization isotope dilution mass spectrometry. Fresenius’ J Anal Chem. 1997;357:1050–1055. [Google Scholar]
- Pettine M, D’ottone L, Campanella L, Millero FJ, Pasino R. The reduction of chromium(VI) by iron(II) in aqueous solutions. Geochim Cosmochim Acta. 1998;62(9):1509–1519. [Google Scholar]
- Pettine M, Capri S. Digestion treatments and risks of Cr(III)-Cr(VI) in-terconversions during Cr(VI) determination in soils and sediments-a review. Anal Chim Acta. 2005;540:231–238. [Google Scholar]
- Roorda-Knape M, Janssen NAH, Hartog JJD, Vliet PHNV, Harssema H, Brunekreef B. Air pollution from traffic in city districts near major motorways. Atmos Environ. 1998;32:1921–1930. [Google Scholar]
- Seigneur C, Constantino E. Chemical kinetic mechanism for atmospheric chromium. Environ Sci Technol. 1995;29:222–231. doi: 10.1021/es00001a029. [DOI] [PubMed] [Google Scholar]
- Svenningsson IB, Hansson HC, Wiedensohler A, Ogren JA, Noone KJ, Hallberg A. Hygroscopic growth of aerosol particles in the Po Valley. Tellus B. 1992;44:556–569. [Google Scholar]
- Torkmahalleh MA, Lin L, Holsen TM, Rasmussen DH, Hopke PK. The impact of deliquescence and pH on Cr speciation in ambient PM samples. Aerosol Sci Technol. 2012;46:690–696. [Google Scholar]
- Torkmahalleh MA, Lin L, Holsen TM, Rasmussen DH, Hopke PK. Cr species changes in the presence of ozone and reactive oxygen species at low relative humidity. Atmos Environ. 2013a;71:92–94. [Google Scholar]
- Torkmahalleh MA, Yu CH, Lin L, Fan Z, Swift JL, Bonanno L, Rasmussen DH, Holsen TM, Hopke PK. Improved atmospheric sampling of hexavalent chromium. J Air Waste Manag Assoc. 2013b;63(11):1313–1323. doi: 10.1080/10962247.2013.823894. [DOI] [PMC free article] [PubMed] [Google Scholar]
- US Census. Patterns of Metropolitan and Micropolitan Population Change: 2000 to 2010, 2010 Census Special Reports. US Census Bureau; Washington DC: 2012. http://www.census.gov/prod/cen2010/reports/c2010sr-01.pdf. [Google Scholar]
- US EPA. 2011 National Monitoring Program Annual Report (UATMP, NATTS, CSATAM) EPA 454/R-13-007a. US Environmental Protection Agency, Office of Air Quality Planning and Standards Air Quality Assessment Division; Research Triangle Park, NC: 2013. p. 27711. [Google Scholar]
- Wang YF, Li CT, Mi HH, Luo JH, Tsai PJ. Emissions of fuel metals content from a diesel vehicle engine. Atmos Environ. 2003;37:4637–4643. [Google Scholar]
- Werner M, Nico P, Guo B, Kennedy I, Anastasio C. Laboratory study of simulated transformations of chromium in ultrafine combustion aerosol particles. Aerosol Sci Technol. 2006;40:545–556. [Google Scholar]
- Wu Y, Hao J, Fu L, Wang Z, Tang U. Vertical and horizontal profiles of airborne particulate matter near major roads in Macao, China. Atmos Environ. 2002;36:4907–4918. [Google Scholar]
- Zhang H. Light and iron(III)-induced oxidation of chromium(III) in the presence of organic acids and manganese(II) in simulated atmospheric water. Atmos Environ. 2000;34:1633–1640. [Google Scholar]
- Zhu Y, Hinds WC, Shen S, Sioutas C. Seasonal trends of concentration and size distributions of ultrafine particles near major highways in Los Angeles. Aerosol Sci Technol. 2004;38:5–13. [Google Scholar]