

Abstract
We have developed a micromechanics based model for chemically active saturated fibrous media that incorporates fiber network microstructure, chemical potential driven fluid flow, and micro-poromechanics. The stress-strain relationship of the dry fibrous media is first obtained by considering the fiber behavior. The constitutive relationships applicable to saturated media are then derived in the poromechanics framework using Hill’s volume averaging. The advantage of this approach is that the resultant continuum model accounts for the discrete nature of the individual fibers while retaining a form suitable for porous materials. As a result, the model is able to predict the influence of micro-scale phenomena, such as the fiber pre-strain caused by osmotic effects and evolution of fiber network structure with loading, on the overall behavior and in particular, on the poromechanics parameters. Additionally, the model can describe fluid-flow related rate-dependent behavior under confined and unconfined conditions and varying chemical environments. The significance of the approach is demonstrated by simulating unconfined drained monotonic uniaxial compression under different surrounding fluid bath molarity, and fluid-flow related creep and relaxation at different loading-levels and different surrounding fluid bath molarity. The model predictions conform to the experimental observations for saturated soft fibrous materials. The method can potentially be extended to other porous materials such as bone, clays, foams and concrete.
Keywords: Poromechanics, micromechanics, osmotic pressure, fiber, drained stress-strain behavior, creep
1 Introduction
Fluid saturated fibrous natural and synthetic materials are ubiquitous and of interest in diverse fields. These materials are found in nature as soft biological tissues or synthesized as polymeric hydrogels or form at the interfaces where the water in biological tissues interacts with synthetic polymeric materials. Their mechanical behavior is of interest in wide areas of biomechanics, such as growth mechanobiology [1, 2], function of heart valves and other cardiovascular tissues [3–5], temporomadibular disc and condylar cartilage [6–8], tissue engineering scaffolds [9, 10], and the hybrid layer of dentin-adhesive interfaces [11]. The presence of chemical activity and material non-linearity in addition to the fluid-solid mechanical interaction makes the theoretical analysis of such materials a challenging problem. These materials can be described as porous solids and modeled using principles of poromechanics pioneered by Biot [12, 13], who developed the stress-strain relationships for infinitesimal and finite deformations of elastic soil under three-dimensional consolidation. Biot also extended his theory to viscoelastic solid matrices [14] and his approach has since been extended to include chemical activity, material microstructure, and solid matrix non-linearity. In contrast to nonporous materials, porous media require additional material properties, termed as poromechanics parameters, in order to define their mechanical behavior. The poromechanical parameters, denoted in this paper by Bij and Γ, are necessary to account for the additional degrees of freedom viz. the fluid pressure and the change of fluid content. For linear isotropic materials, parameters Bij and Γ correspond to the constants α and 1/Q introduced by Biot [12]. An alternative method for modeling saturated fibrous network is by the use of continuum mixture theory [15]. However, it has been shown [16, 17] that the Biot’s poromechanics constitutive equations can be recovered from the mixture theory.
Numerous researchers have investigated the behavior of chemically active porous media using either poromechanics or mixture theory. These efforts have addressed several issues of significance to these type of materials including: chemical potential driven fluid-flow [18, 19]; separation of intra and extrafibrillar waters in articular cartilage [20, 21]; fibril reinforcement in cartilage [22–25]; collagen network structure and non-linearity [26–30]; porous continuum for describing bone growth/resorption [31–33]; dual-porosity poroelasticity of bone [34]; physico-chemical forces between solid and fluid components in swelling clays [35]; solid matrix dilatation under loading [36]; poroelasticity and viscoporoelasticity of polymeric gels [37, 38]; and second-gradient effects in porous media [39–41]. In particular, the numerical simulation of second-gradient effects and microstructure on bio-mechanical coupling and bone remodeling has been carried out by [32]. As evident, a large number of these works have focused on biological soft tissues owing to the need for constitutive models which could replicate their complex material behavior and aid in modeling and interpretation of experimental studies on tissue engineering and tissue growth [42]. We note, however, that the varieties of porous media and the number of references are too numerous to include here so we have limited ourselves to cite a selection; the reader should be able to reconstruct the literature by following the references cited therein.
Although the above cited modeling efforts incorporate a broad range of factors that affect the poromechanical behavior of chemically active fiber networks, a number of issues need further attention. For example, a kinematic assumption is used to distribute the strain between the solid and fluid phases. Further, though some of the models have incorporated microstructure, its effect on the evolution of the poromechanical parameters Bij and Γ has not been explicitly considered. These parameters also affect the pore pressures and chemical potentials generated during loading which drive the fluid flow. The fluid flow, in turn, has been found to be a common denominator governing the transport of nutrients or contaminants which affect important properties such as (a) growth and repair in tissues such as articular cartilage and (b) failure of landfills and foundations for engineering structures like roads, buildings, and runways. On the other hand, in micromechanics based approach to derive the overall poroelastic behavior, the effects of the solid phase deformation on the poromechanics parameters can be are explicitly incorporated [43–46]. Such an approach was used to model articular cartilage as an anisotropic poroelastic material and used to simulate cyclic loading [47]. However, the approach did not model the evolution of anisotropy resulting from microstructural changes to the fiber network during loading.
The present work addresses some of the issues stated above by developing a model that incorporates fiber microstructure, chemical potential driven fluid flow, and micro-poromechanics. In particular we (1) account for the discrete nature of the individual fibers through micromechanics based homogenization, (2) relate the fiber network description to a poromechanics description, and (3) solve for rate-dependent behavior under confined and unconfined conditions and under varying chemical environments. The approach used for fiber network homogenization is conceived within the framework of granular micromechanics [48, 49]. The fiber element in this approach represents the effective behavior of the fibrous reinforcement and its surrounding interacting matrix. In the absence of well-defined local composition and microstructure that define the fiber-matrix interaction, suitable empirical fiber element constitutive laws need to be postulated. In this paper, we have assumed a slender fiber element only active under tensile loads. Such a fiber element is particularly suitable for cartilage-type soft materials that can be described as composed of a soft hydrogel matrix intimately integrated with the stiff collagen fiber network into a complex microstructure. For stiffer matrix, the fiber element behavior may be modified to incorporate compressive and non-central or shear components. In the subsequent discussion, we first derive the stress-strain relationship for a fiber network using kinematically driven granular micromechanics methodology [48–50]. We then superpose the homogenized network with the fluid phase to derive the overall constitutive relationship, including expressions for the poromechanical parameters Bij and Γ. Then, we formulate the necessary transport laws for the chemical potential driven fluid flow. Finally, we simulate steady state as well as rate-dependent mechanical behavior under varying conditions of confinement and external bath molarity. We find that the model predictions show qualitatively and quantitatively similar behavior as that observed in experimental data for articular cartilage under varying load and chemical environment. We also find that the poromechanical parameter Bij can deviate upto 10% or more from unity, while parameter Γ can vary significantly for these highly compressible materials during creep and relaxation, particularly at small strains. The evolution of Bij and Γ, as well as that of the fiber network stiffness strongly depends on the changes in fiber microstructure during loading as well as fluid drainage.
2 Micromechanical model
We consider a porous material whose solid matrix is a fibrous network as shown schematically in Fig. 1, which depicts the microscopic and continuum scales of dry and saturated fibrous porous media. In general saturated chemically active porous media have a nonlinear behavior accompanied by large strains. Therefore, we seek incremental form of Biot’s constitutive equations for this media. Since linearity can be assumed for small increments in stress and strain, superposition is used to derive the incremental constitutive behavior. To proceed, we consider the general loading increment to be a superposition of two cases. In case 1, we apply an increment of Green-Lagrange strain while the increment of interstitial fluid pressure is held zero denoted as . In case 2, we hold the increment of Green-Lagrange strain to be zero while we apply an increment of interstitial fluid pressure denoted as . Similar superposition has been used for modeling porous media previously [44, 51, 52].
Fig. 1.

(a) Schematic of dry fibrous network at the microscale. (b) Schematic of saturated fibrous network at microscale by zooming in to a homogenized representative volume element at the macroscale.
2.1 Case 1:
2.1.1 Fiber network stress
We first write the macroscopic Cauchy stress, σij, of a representative volume element (RVE) of the dry fiber network as the volume average of microscopic stresses
| (1) |
where V denotes the RVE and is the stress in infinitesimal volume dV. Using Signorini’s theorem [53] and applying Gauss’ divergence rule, Eq. (1) can be written as (see [54])
| (2) |
In the absence of body forces and inertial effects, , thus we get
| (3) |
where the traction vector , the position vector xi = Ri + ri, the centroid of the RVE is denoted by Ri, xi is the position vector of one end of the intercepted collagen fiber and ri is the radius vector of the spherical RVE. Equation (3) can now be simplified as
| (4) |
since for centro-symmetrical RVE. Further, the force acting on the infinitesimal area dA, defined as is given by
| (5) |
as the product of (1) the force in the fiber, Afσfni, where Af is the fiber area, σf is the fiber stress, and ni is a unit normal vector expressed in spherical coordinates as the triad 〈cos θ, sin θ cos ϕ, sin θ sin ϕ〉, and (2) the number of fibers intersecting the infinitesimal area, dA = sin θdθdϕ, given by Nξ(θ, ϕ) sin θdθdϕ, where ξ(θ, ϕ) is the probability density of the fiber distribution along (θ, ϕ), and N is the total number of fibers. Since the average length of a fiber is given as r, the total volume of fibers in the RVE is NAfr. Expressing fiber volume in terms of the fiber volume fraction, γf, we get
| (6) |
Combining Eqs. (4), (5), and (6), we obtain the following relationship for the RVE Cauchy stress
| (7) |
We now obtain the relationship for the increment of the RVE Cauchy stress, , as follows from Eq. (4):
| (8) |
where the terms with over dot (˙) denote incremental quantities throughout the paper. From the definition of the Second Piola Kirchhoff stress, , where the force expressed with respect to the current configuration is related to the force expressed with respect to the undeformed configuration through the deformation gradient, Fik. Thus
| (9) |
Further, from the definition of the deformation gradient, , we get
| (10) |
where is the position vector in the undeformed configuration. Equation (8) can now be written as follows
| (11) |
where V0 is the undeformed volume of the RVE, J is the Jacobian of the deformation gradient such that V = JV0, and . We note that the Cauchy stress defined in Eq. (4) can be expressed in terms of the Second Piola Kirchhoff stress as follows
| (12) |
Thus, Eq. (11) can be written as
| (13) |
Using the spatial velocity gradient defined as , and increment of Jacobian given as , Eq. (13) can be written as
| (14) |
From whence we obtain the well-known Truesdell stress increment
| (15) |
The Truesdell stress increment can be further simplified analogous to Eq. (7) as follows
| (16) |
where the fiber stress increment, , can be related to the fiber strain increment by the following 1-dimensional nonlinear constitutive equation considering a slender fiber element
| (17) |
where Cf is a constant and exponent α ≥0. Further, the fiber strain increment, ėf, can be expressed in terms of the overall RVE strain increment, , using the following kinematic assumption
| (18) |
Thus the tangential stress-strain relationship for the RVE can be written as follows
| (19) |
where , and the probability density of the fiber distribution, ξ(θ, ϕ) is described in the Appendix. The derived relationship has similarities with those obtained using the virtual internal bond and granular micromechanics methods [48–50, 55, 56]. The approach presented here can also be applied to obtain higher-order stiffness tensors of relevance to second- and higher-gradient theories [39–41, 57–59].
2.1.2 Volumetric water content
For case 1 loading increment, since the fluid pressure increment is held zero, the incremental change in volumetric water content is same as the incremental change in volume of pore space, thus
| (20) |
where is the incremental change in volumetric water content, ϕ is the pore volume fraction (porosity), and is the increment of average pore space strain. We note here that the fiber volume fraction, γf, and porosity, ϕ, satisfy the relationship γf + ϕ = 1. Further, the incremental average pore space strain can be expressed in terms of the average incremental Green-Lagrange strain of the RVE as follows:
| (21) |
where is the strain concentration tensor for the pore space. The average incremental fiber strain can also be expressed in terms of the average incremental Green-Lagrange strain of the RVE as follows:
| (22) |
Following Hill’s volume averaging principle expressed as
| (23) |
we obtain the following identity.
| (24) |
Noting that the increment of the pore stress is zero, the volume average incremental stress for the RVE can be written as
| (25) |
Now, using the constitutive relationship for the fiber material, written as , and combining Eqs. (19), (22), and (25) we find
| (26) |
Further, using Eqs. (20), (21), (24), and (26), the incremental change in volumetric water content, , can be expressed in terms of the average incremental Green-Lagrange strain of the RVE as
| (27) |
2.2 Case 2:
Since the incremental strain is held zero during case 2 loading, we consider the increment of Cauchy stress given as
| (28) |
where is the increment of the pore fluid pressure and Bij is the poromechanical parameter. Further, the incremental change in volumetric water content is given as
| (29) |
where the first term in Eq. (29) arises from the volume change of the pore spaces and the second term is contributed by the fluid compressibility. In addition, the volume average incremental stress for the RVE can be written as
| (30) |
Since the fiber material is expected to be considerably (order of magnitude) stiffer than the RVE such that it suffers small deformations, we assume , which leads to the following relationship in light of Eq. (28)
| (31) |
Now, using Eq. (23) for this case, we get
| (32) |
Thus from Eq. (29), the incremental change in volumetric water content is obtained as,
| (33) |
2.3 Superposition of Case 1 and Case 2
Case 1 and 2 results, given in Eqs. (19), (27), (28), and (33), are now superposed to obtain the incremental stress-strain relationship for the general case of applied loading, , as follows
| (34) |
| (35) |
where is the effective stress obtained from accretion of Eq. (14) and
| (36) |
It now remains to define Bij , to which end we consider the following second-order virtual work expression
| (37) |
where 〈〉. represents volume averaged quantities, and superscripts represents cases 1 and 2. In light of Eqs. (28), (30), and (31), Eq. (37) becomes
| (38) |
It is straightforward to show that first term of the right-hand-side vanishes, that is , by considering the second-order virtual work . Now, using Eq. (21) we simplify the second-order virtual work expression in Eq. (38) as follows
| (39) |
Since Eq. (39) must hold for all virtual strain increments, , we obtain the following expression for Bij, using Eqs. (24) and (26),
| (40) |
Thus Eqs. (34)–(36) can be written as follows
| (41) |
| (42) |
| (43) |
3 Transport model and chemical potential
When saturated chemically active fibrous media are immersed in an ionic solution, they either imbibe or exude fluid depending upon the fixed charges within the fibrous media, the molarity and the ion valencies of the surrounding fluid bath. The flow of fluid and ions can be described using the concept of electrochemical potential for ionic solutions introduced in [60]. The constitutive equation for the diffusion of fluid with respect to the solid matrix can be expressed as (see also [61] for a general constitutive equation for convection-diffusion of fluids and ions):
| (44) |
where subscript w refers to the fluid, j is the mass flux, ρ is the mass density, μ is the chemical potential, D is the diffusion coefficient expressed in dimensions of area per unit time, and R and T are the universal gas constant and temperature, respectively. Equation (44) assumes that the diffusive flux of the ions through the fluid is much faster than the diffusive flux of the fluid through the porous medium so that ionic equilibrium is instantaneously established as compared to chemical equilibrium of the fluid phase [62]. For a single RVE of the porous medium, Eq. (44) can be approximated as follows
| (45) |
where the flux is assumed to be isotropic hence expressed as a scalar, and l, representing the length scale over which the diffusion occurs, is the RVE size. We note that the fluid flow is in general, not isotropic for such porous media and is likely to undergo changes during loading. The diffusion coefficient and its anisotropy can be expected to change with strain state, chemical potential and induced structural anisotropy (see for example [63]). In our examples, we have assumed isotropic flow and a constant diffusion coefficient for ease of calculation and interpretation of the results.
The difference in fluid chemical potential which drives the flow of the fluid is written as follows [60, 64]
| (46) |
where p is the pore pressure. po is the external bath pressure, xw is the mole fraction, νw is the partial molar volume, and p is the partial pressure. For dilute solutions, the above equation may be simplified as follows [64] incorporating a correction factor χR
| (47) |
where and are the concentrations of the Na+ cations and Cl− anions inside the porous material, respectively, while Co is the concentration of either ion in the surrounding fluid bath. Since the ionic equilibrium is instantaneously established, equating the chemical potentials of the sodium and chloride ions and applying the Donnan equilibrium condition [64] gives the following
| (48) |
The concentrations of ions in the surrounding fluid bath are assumed to be constant since its volume is much larger compared to the porous medium. Electroneutrality inside the porous material can now be written as follows
| (49) |
where CF is the fixed charge density of the porous material. Using Eqs. (48) and (49), Eq. (47) can be simplified as
| (50) |
Taking the pressure in the surrounding fluid bath po = 0, the chemical potential difference can be rewritten as
| (51) |
where pc is identified as the Donnan’s osmotic pressure given by
| (52) |
Hence, Eq. (45) can be written as follows
| (53) |
where is an effective mass transfer coefficient. We observe that the chemical potential difference for the fluid phase at any time during the deformation is proportional to the difference between fluid pressure and osmotic pressure corresponding to the fixed charge density at that particular deformed state. Further, the incremental change in volumetric water content, , can be written in terms of the fluid flux with respect to the fiber network as follows
| (54) |
where A and V are the area and volume of the RVE and ρw is the density of fluid at the pressure of the external bath and the flux, jw is obtained from Eq. (53).
4 Results and discussion
In the subsequent discussion, we present results from model calculations for RVE behavior under a variety of loading and drainage conditions that reflect typical laboratory tests. We then discuss these results both in the context of experimental observations and insights available through parametric analysis. In particular, we focus on the behavior under the following loading and drainage conditions: (1) unconfined drained monotonic uniaxial compression under different surrounding fluid bath molarity, (2) fluid-flow dependent related creep at different unconfined and confined uniaxial stress-levels and different surrounding fluid bath molarity, and (3) fluid-flow dependent related stress-relaxation at different strain-levels for unconfined uniaxial loading at different surrounding fluid bath molarity.
4.1 Loading conditions and model parameters
For the examples discussed hereafter, the RVE is subjected to loading in two separate phases: the free-swell phase followed by either drained or undrained loading under uniaxial stress conditions. In the free-swell phase, the RVE undergoes pre-strain due to swelling caused by water migration in response to the chemical potential difference between the material and the surrounding fluid bath under an overall stress-free condition. The phenomenon results in an osmotic pore pressure in the RVE fluid phase, which at equilibrium, where chemical potential difference vanishes, that is Δμw = 0, can be obtained from Eqs. (51) and (52). The strain and pore pressure increments can now be obtained from Eqs. (41) and (42) by setting the stress increment to zero, such that
| (55) |
where the incremental volumetric water content is specified using suitable step-size. The incremental strains are accumulated to obtain the pre-strain corresponding to the equilibrium osmotic pore pressure.
During undrained loading, there is no ingress or egress of water and the incremental volumetric water content, , is set to zero. Thus from Eqs. (41) and (42), we get
| (56) |
| (57) |
Further, the volume fractions of the constituents change during loading. From Eq. (29), the incremental change of porosity is given as
| (58) |
The volume fraction of the fiber is calculated from the identity, γf + ϕ = 1, and the increment of fixed charge density is given as
| (59) |
During drained loading, ingress or egress of water is permitted such that when equilibrium is reached for an applied load, the pore pressure is same as the osmotic pore pressure. In this case Eqs. (41) and (42) apply directly. Further, the incremental change of porosity is obtained from Eq. (58) and the increment of fixed charge density is given by Eq. (59).
The parameters used for the calculations described below are taken to be as follows: 1–d constitutive law for fiber – α = 0.5, Cf = 1200 MPa, a20 = 0, fiber volume fraction in the reference state γf = 0.55, porosity in the reference state, ϕ = 0.45, fixed charge density in the reference state CF = 330 eq/m3, fiber material properties – Young’s modulus = 200 MPa, and Poisson’s ratio = 0.2, bulk modulus of water Kf = 2200 MPa. The diffusion coefficient, Dw, for fluid transport is taken as 10−4 m2/sec [65]. For the cases of creep and relaxation, the results are displayed from a time of t = 0+ i.e. after the instantaneous (so called “elastic”) deformation has been completed. We clarify that for Figs. 2 to 6, the term “osmotic pressure” as used here denotes the osmotic pressure that would exist for the fixed charge density at that instant of time; this does not mean that the material is in equilibrium.
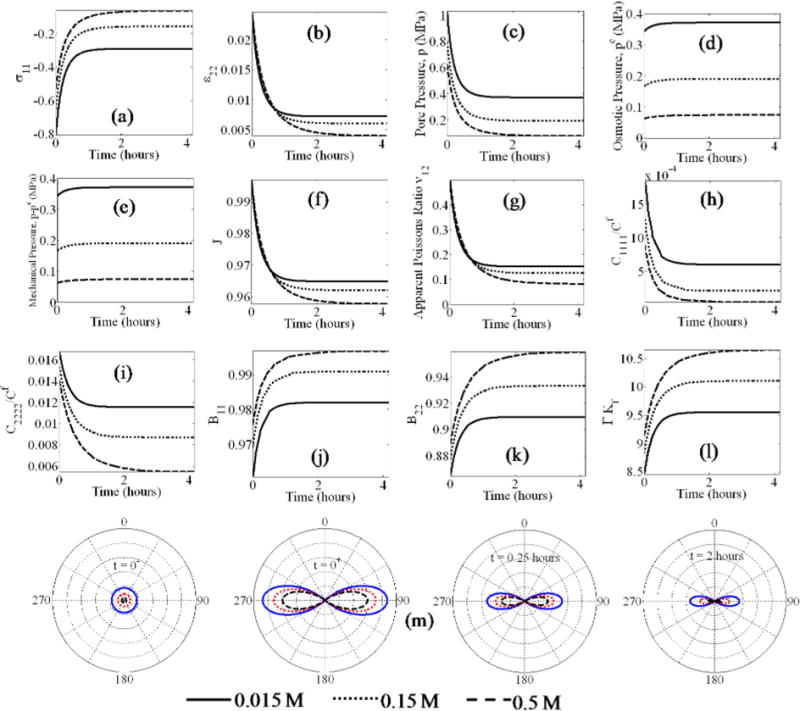
Fig. 2.

Unconfined uniaxial drained monotonic compression: stress-strain behavior under varying external bath molarity (a, b and d), evolution of pore pressure (c), volume change (e), porosity (f), material properties (g–l), and the fiber stress distributions (m).
Fig. 6.
Unconfined stress relaxation under different external bath molarities: axia stress (a), lateral strain (b), pore pressures (c–e), volume change (f), material properties (g–l), and the fiber stress distributions (m).
4.2 Unconfined drained monotonic compression
To demonstrate the applicability of the model to steady-state material behavior, the compressive stress-strain behavior of the free-swollen porous material is studied under external salt molarity of 0.015 M, 0.15 M, and 0.5 M and compared to experimental results for articular cartilage.
Figures 2(a) through 2(g) show the evolution of the stresses, strains, porosity, and fluid pressures associated with the porous material. The porous material shows an initially stiff response, followed by softening, which transitions to a monotonic response with increasing strain. It is observed that both the initial and the post-softening stiffness depend upon the molarity of the bath. In the free swelling phase, during which water is free to drain, an isotropic tensile pre-strain of 1.28%, 0.8%, and 0.4% develops under bath molarity of 0.015 M, 0.15 M, and 0.5 M, respectively. As the uniaxial compression is applied, the tensile strain in the fibers decreases and the fiber network softens. Consequently, the effective stress decreases rapidly and asymptotes (Fig. 2(b)). The magnitude of strain at which the material response transitions from the initially stiff to the post-softening regime increases with the pre-strain, or decreases with the external bath molarity. After the fiber network softens, and the effective stress decreases to a minimum, the osmotic pressure (Fig. 2(c)) becomes the primary load carrying mechanism in the direction of load application. In the lateral direction, the increasing osmotic pressure is balanced by the fiber network stress (Fig. 2(d)). The osmotic pressure increases with applied strain due to an increase in the fixed charge density as the material densifies (as shown by decrease of the overall volume in Fig. 2(e)), caused by a decrease in porosity (Fig. 2(f)). The softening of the fiber network in the direction of loading coupled with its stiffening in the lateral direction causes the apparent Poisson’s ratio (Fig. 2(g)) to decrease with applied strain. We also note that the osmotic pressures (Fig. 2(c)) and apparent Poisson’s ratio (Fig. 2(g)) are smaller at higher external bath molarity. The osmotic pressure decreases with external salt concentration, by virtue of a decreased chemical potential difference. Accordingly, the loss of stiffness in the loading direction increases with salt concentration, thereby resulting in a lower value of the apparent Poisson’s ratio. We note that the predicted stress-strain and apparent Poisson’s ratio behavior are comparable to experimental results for articular cartilage under unconfined drained compression [66]. The following correspondences can be readily observed between the experimental data and the presented results (a) the presence of initially stiff and post-softening regimes (b) the order of material stiffness 0.015 M>0.15 M>0.5 M, and (c) the decrease in apparent Poisson’s ratio with loading.
Figures 2(h) to 2(l) show the evolution of material properties with loading. The loss of fiber network stiffness in the loading direction is shown in Fig. 2(h). Owing to the fiber non-linearity, C1111 is stiffer and asymptotes at a larger magnitude of applied strain at lower bath molarities. The lateral stiffness C2222 also decreases with applied strain due to overall softening of the fiber network; however the values of C2222 are significantly higher at lower bath molarities both due to higher pre-strain and the less significant effect of fiber unloading in the lateral direction as compared to the loading direction. It is also interesting to note that the poromechanical parameter B differs appreciably from unity. As shown in Figs. 2(j) and 2(k), both B11 and B22 are higher at higher bath molarity, thus showing that the contribution of fluid pressure to the load bearing increases with bath molarity. Further, it is observed that B11 and B22 monotonically increase with applied compressive strain. It is seen that the values of B11 and B22 deviate significantly from unity especially for cases of low bath molarity and need to be explicitly accounted for to obtain an accurate estimate of the load carried by fluid. Fig. 2(l) shows the evolution of poromechanical parameter Γ, which represents the effective fluid-solid material compressibility. The parameter Γ, is found to increase with both bath molarity and applied strain and is found to be a multiple of water compressibility. We note that the bulk modulus measurements reported for cartilage under large loading rates and confined or unconfined conditions are typically a fraction of the water bulk modulus [67, 68], which agrees with our prediction that parameter Γ is a multiple of water compressibility. The evolution of the poromechanical parameters B and Γ can be attributed to stiffness of the fiber network, which decreases with bath molarity and applied loading and exhibits loading induced anisotropy.
Fig. 2(m) shows the fiber stress distribution with orientation and its evolution with applied strain. We observe that (a) before the loading commences at 0% strain, the fiber network experiences isotropic pre-strain, which decreases with bath molarity; (b) at 0.5% applied strain, the fibers oriented closer to the loading direction (0° or 180°) are still active for bath molarities of 0.015 M and 0.15 M while they have unloaded for the bath molarity of 0.5 M; and (c) in the post-softening regime at 1.5% and 5% applied strain, the fiber stress magnitude in the lateral direction follows the order 0.015 M > 0.15 M > 0.5 M, due to the difference in osmotic pressure. The fiber stress distribution can be directly associated with the effective stress as well as the fiber network stiffness.
4.3 Creep response at different stress-levels
To illustrate the applicability of the model to rate-dependent behavior, we consider the fluid-flow dependent creep of the material under the following applied stress-levels: 0.1, 0.2, and 0.4 MPa, for 0.15 M external bath molarity. In Figs. 3(a) through 3(g), we show the predicted evolution of the strains and fluid pressures. From Fig. 3(a), the creep strains at equilibrium are found to be 0.7%, 8.7%, and 26.6% at 0.1 MPa, 0.2 MPa, and 0.4 MPa, respectively, indicating that the creep response is highly non-linear as the load increases from 0.1 to 0.4 MPa. We note from the steady-state stress-strain behavior for the case of 0.15 M external bath (Fig. 2(a)) that at a stress of 0.1 MPa, the response lies within the initially stiff regime while at 0.2 MPa and 0.4 MPa, the response lies in the post-softening regime, thus requiring a large increase in strain to equilibrate to a drained state of loading. When the applied stress lies within the initially stiff regime, the contribution of the fiber network in supporting the load is significant, thereby decreasing the pore pressure rise caused by loading. On the other hand, when the applied stress is in the post-softening regime, the pore pressure is high while the fiber network has softened; this leads to large creep strains at equilibrium.
Fig. 3.

Creep response under different axial stress: strain (a, and b), pore pressures (c–e), volume change (f), material properties (g–l), and the fiber stress distributions (m).
It is also observed that in the case of 0.1 MPa, the creep strain asymptotes in about an hour as compared to several hours for the higher loads (Figs. 3(a) and 3(b)). However, the rate of creep is highest for 0.4 MPa due to the larger chemical potential difference between the material and the bath. The lateral strain (Fig. 3(b)) is governed both by the Poisson’s effect as well as the shrinkage (Fig. 3(f)) of the material with drainage. The drainage is the governing factor at loads below the softening stress, but the lateral strains at higher loads are found be governed by the Poisson’s effect. It is also interesting to note that a majority of the pore pressure equilibrates in less than an hour (Fig. 3(c)) as the decreasing mechanical pore pressure (Fig. 3(e)) and increasing osmotic pressure (Fig. 3(d)) balance each other. However the creep keeps increasing substantially up to 10 hours (Figs. 3(a) and 3(b)) due to the decrease in the mechanical pore pressure. We further observe that for the loads of 0.2 MPa and 0.4 MPa, the shrinkage of the material is substantial as seen from Fig. 3(f). This corresponds to the increasing creep strains in the axial direction and the decreasing apparent Poisson’s ratio. On the other hand, for a load of 0.1 MPa which is in the initial stiff regime, the decrease in apparent Poisson’s ratio as well as the magnitude of creep strain is not significant, resulting in negligible shrinkage.
The low creep strain observed at 0.1 MPa applied load is further corroborated by the fiber network stiffnesses Cijkl (Figs. 3(h) and 3(i)), which are generally higher and undergo little change as compared to those at the applied loads of 0.2 MPa and 0.4 MPa, in which cases the fiber network stiffnesses drop significantly and asymptote to a small value. As a result, B11 increases and approaches unity (Fig. 3(j)), while B22 increases and approaches a value less than unity (Fig. 3(k)) at equilibrium. Following the changes in Cijkl , the changes in Bij are small when the applied load is 0.1 MPa but significant for the higher loads. Thus, we see that at higher loads, the contribution of the pore pressure in supporting the load increases not only because of the fiber network softening, but also from an increase in B. Similarly, there is little change in Γ for an applied stress of 0.1 MPa, but a significant change is observed for the other two cases.
The variation in the fiber network stiffness can be understood based on the fiber stress distribution with orientation (Fig. 3(m)). Since all the loading cases are performed in a bath of the same molarity, the fiber stress distribution before loading is the same. After the instantaneous deformation, active fibers in the direction of loading remain when the applied stress is 0.1 MPa; however, all the fibers close to the loading direction have unloaded for the cases of 0.2 and 0.4 MPa applied load. As equilibrium is reached within an hour for the 0.1 MPa case of loading, there is no difference between the fiber stress distributions at 1 hour and at 6 hours. On the other hand, for the 0.2 and 0.4 MPa cases, we see that the fiber network stress is progressively transferred to fibers oriented close to the lateral direction; thus imparting induced anisotropy to the material along with significantly reduced stiffness in the loading direction.
4.4 Creep response under varying bath molarity
We further evaluate the rate-dependent behavior of the material by investigating creep under varying external bath concentration. In this case, we apply a constant stress of 0.4 MPa and study the creep response when the material is immersed in bath concentrations of 0.015 M, 0.15 M, and 0.5 M. Figures 4(a) to 4(g) show the evolution of the strains and fluid pressures. Fig. 4(a) shows the increase in rate of creep and equilibration time with the external salt concentration. The rate of creep increases with the external bath molarity because a smaller osmotic pressure generates a larger chemical potential difference for the same applied load. The larger creep strain at equilibrium follows from the equilibrium strain at steady state behavior (Fig. 2(a)). The lateral creep strain is shown in Fig. 4(b), and is a complex phenomenon that depends on the material shrinkage as well as the Poisson’s effect. The contribution of the shrinkage is not significant for the lower bath concentrations of 0.015 M and 0.15 M (Fig. 4(f)). However, in the case of the 0.5 M bath, the material is subjected to a high chemical potential difference due to the low osmotic pressure, and therefore, drains and shrinks substantially. Consequently, the lateral strain rises and then drops down to an equilibrium asymptote. As described in the previous section, the pore pressure (Fig. 4(c)) experiences a majority of its decrease in the first hour, but equilibrium is achieved only when it equals the osmotic pressure, shown in Fig. 4(d), that is the mechanical pressure (Fig. 4(e)) becomes zero. It is noteworthy that though the material starts at a low osmotic pressure for the 0.5 M case, at equilibrium the osmotic pressure has increased significantly due to the material shrinkage (Fig. 4(f)). Due to the higher creep strains in the loading direction associated with higher bath molarity, the apparent Poisson’s ratio (Fig. 3(g)) decreases with external bath molarity. The results obtained can be qualitatively compared to indentation creep experiments on articular cartilage [69] and condylar cartilage [70] in 2 M and 0.15 M PBS solutions. The trends for increase in creep rate and creep magnitude with bath molarity are correctly predicted by the model.
Fig. 4.
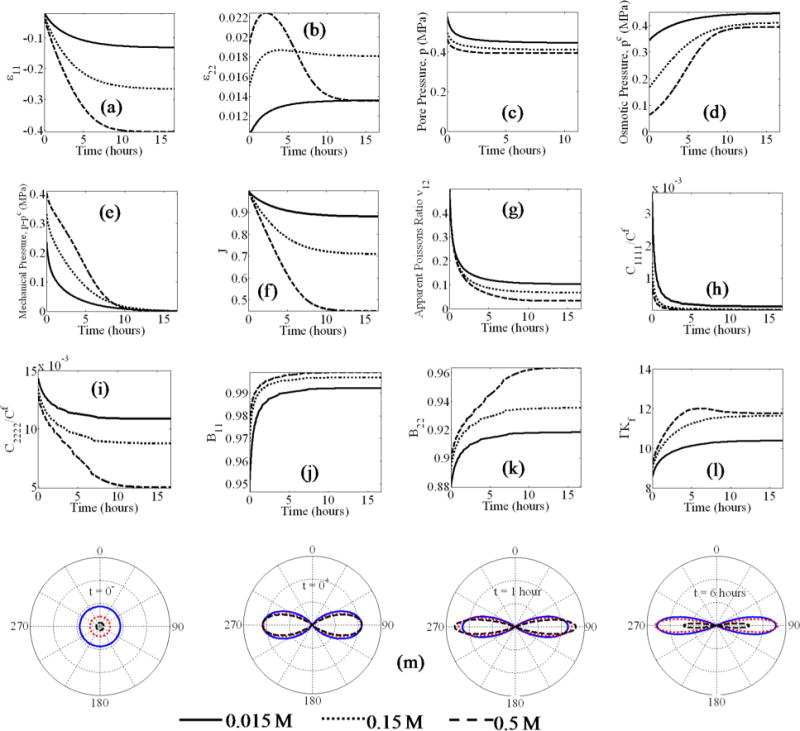
Creep response under different external bath molarities: strain (a, and b), pore pressures (c–e), volume change (f), material properties (g–l), and the fiber stress distributions (m).
We further describe the behavior in the three cases by considering the evolution of the material parameters during loading. Since the applied load of 0.4 MPa lies in the post-softening regime under all the bath molarities, there is significant softening of the fiber network, resulting in C1111 (Fig. 4(h)) tending to zero for all the cases. The value of C2222 (Fig. 4(i)) depends on the bath concentration; clearly when the bath molarity is lower, the material retains a majority of its stiffness in the lateral direction, due to higher contribution from the osmotic pressure in maintaining the fiber network stiffness. Therefore, for lower bath molarities, the values of B11 and B22 (Figs. 4(j) and 4(k)) are also lower, indicating the decreased contribution of pore pressure to load bearing. Similarly, the fluid-solid compressibility Γ (Fig. 4(l)) is also lower, indicating that it is more difficult to exude fluid under mechanical loading in the case of a lower bath molarity.
The decrease in the fiber network stiffness with loading and bath molarity can be understood from the fiber stress distribution (Fig. 4(m)). In an unloaded state, there is an isotropic pre-strain in the fiber network whose magnitude depends on the external bath molarity. For this reason, the instantaneous elastic deformation leaves behind a larger number of active fibers in the direction of loading when the bath molarity is lower. Finally, it is interesting to note that, as the material approaches equilibrium, the fiber stress in the lateral direction decreases due to drainage of fluid and the associated loss of pore pressure. This effect is most prominently seen for the case of 0.5 M bath molarity.
4.5 Effect of confinement on creep behavior
Confinement is an important factor that influences the load distribution between the fiber network and the fluid. Figure 5(a) shows the difference in creep behavior between confined and unconfined conditions under an applied load of 0.4 MPa and an external bath molarity of 0.15 M. The instantaneous elastic strains as well as the creep strains are lower in the confined case (Fig. 5(a)), due to the greater lateral resistance provided under confinement. However, the lateral resistance provided by confinement is only minimally higher than the resistance provided by the fiber network under unconfined conditions; hence the difference in creep strains is small. The major effect of the confinement is on the effective stress. The effective stress in the loading direction (Fig. 5(b)) decreases much more rapidly in the confined case because of the absence of contribution from lateral fibers. Correspondingly, the pore pressure (Fig. 5(c)) equilibrates much faster in the confined case. The lack of lateral fiber deformation in the confined case also causes the effective stress to be much smaller (Fig. 5(d)). The osmotic pressure is marginally higher for the confined case (Fig. 5(e)) because of a marginally smaller porosity or water volume fraction in the confined case of loading (Fig. 5(f)). However, it is interesting that the volume change is nearly the same in both cases (Fig. 5(g)).
Fig. 5.

Comparison of creep response under confined and unconfined conditions for same applied stress and external bath molarity: strain and effective stress (a, b and d), pore pressures (c and e), porosity (f), volume change (g), material properties (h–l), and the fiber stress distributions (m).
Figures 5(h) to 5(l) display the evolution of the material constants associated with the creep behavior described above. Due to confinement, the lateral fibers do not participate in balancing the osmotic pressure and C2222 drops rapidly in the confined case (Fig. 5(i)). Consequently, we observe that B11 approaches unity in both the cases (Fig. 5(j)), while B22 is significantly smaller for the unconfined case of loading (Fig. 5(k)). Similarly, the lateral fiber contribution results in a smaller compressibility for the unconfined case (Fig. 5(l)). The fiber stress distribution (Fig. 5(m)) shows the significant difference in the fiber stresses between the unconfined and confined cases, particularly in the lateral direction, though both the cases have the same distribution before loading.
4.6 Stress relaxation under variable external bath molarity
Finally, we compare the relaxation behavior of the material under varying external bath molarities at an applied strain of 5%. The relaxation happens due to drainage of pore fluid and consequent reduction in the overall stress. From Fig. 6(a), the stress relaxation is faster and equilibrium stress is lower at higher bath molarities due to higher chemical potential difference. The model prediction agrees with experimental observations that stress relaxation proceeds faster under higher bath molarity for cartilage under unconfined uniaxial compression [71]. As the relaxation proceeds, the lateral strain ε22 decreases as the fluid drains and the material shrinks (Figs. 6(b) and 6(f)). With fluid drainage, the pore pressure decreases (Fig. 6(c)), however, the decrease in pore pressure increases with the bath molarity due to an increase in chemical potential difference. In contrast to the creep response, the stress and the pore pressure equilibrate at similar times. In stress relaxation, since the axial strain is held constant, the shrinkage of the material is minimal (Fig. 6(f)), therefore the osmotic pressure does not vary much during relaxation. Consequently, after stress relaxation, the osmotic pressure still follows the order 0.015 M > 0.15 M > 0.5 M (Fig. 6(d)). Similarly, there is a small variation in the mechanical pore pressure, which also remains close to its initial values. Figure 6(g) shows the decrease in apparent Poisson’s ratio caused primarily by the softening of the fiber network, that is, a decrease in C1111 in the direction of loading (Fig. 6(h)). We observe that the softening is smaller at lower bath molarity, thus resulting in a higher apparent Poisson’s ratio. C2222 undergoes a similar decrease with time. We also note that both C1111 and C2222 decrease at a slower rate but reach equilibrium earlier at lower bath molarity. In Figs. 6(j) to 6(l) we observe that both B and Γ increase as the material softens. Figure 6(m) shows the evolution of fiber stress during the relaxation process. During the relaxation phenomenon, the variation in the fiber network stress with time is primarily due to the decrease in ε22, resulting in a decrease of fiber stress in the lateral direction. The fiber stresses are observed to decrease faster in the case of high bath molarity contributing to the faster relaxation observed in Fig. 6(a).
4.7 Quantitative comparison with experimental data
We further demonstrate the applicability of the derived model by a direct comparison with experimental measurements from literature [66,69]. The correction factor χr in Eq. (52) is obtained as follows to fit experimental measurements of the osmotic pressure [72] as shown in Fig. 7(a)
| (60) |
We first simulate the steady state unconfined compression of articular cartilage under varying external bath molarity using experimental data from [66]. The experiments were performed on cubic specimens excised from bovine cartilage and the loading was applied in the direction of fiber alignment. The model parameters are determined from the data for 0.015 M bath molarity and used to predict the data for 0.15 M and 2 M. The parameters are α = 2.5, Cf = 3500 MPa, a20 = 1 to represent fiber alignment in the direction of loading, fiber volume fraction in the reference state γf = 0.55, porosity in the reference state, ϕ = 0.45, fixed charge density in the reference state CF = 200 eq/m3, fiber material properties – Young’s modulus = 200 MPa, and Poisson’s ratio = 0.2. The stress-strain curves are shown in Fig. 7(b) and the corresponding apparent Poisson’s ratios are shown in Fig. 7(c). It is seen that the predictions match well for both 0.15 M and 2 M bath molarities. The predicted apparent Poisson’s ratio shows a similar decreasing trend as the measured values with compressive strain. The difference in absolute magnitudes could be because of difference between the actual 3-d collagen fiber orientation distribution and that indicated by the split-lines used to determine fiber orientation [66].
Fig. 7.

Comparison with experimental data: (a) Calibration of osmotic pressure measurements [72], (b) Monotonic stress-strain behavior of articular cartilage under compression [66], (c) apparent Poissons ratio of articular cartilage under monotonic compression [66]. (d) Experimental data for creep of articular cartilage [69], and e) Model prediction for creep of articular cartilage.
We then compare the model simulation to creep experiments performed by [69] under two different external bath molarities of 0.15 M and 2 M. The model parameters are as follows: α = 0.5, Cf = 55 MPa, a20 = 0, fiber volume fraction in the reference state γf = 0.85, porosity in the reference state, ϕ = 0.15, fixed charge density in the reference state CF = 225 eq/m3, fiber material properties – Young’s modulus = 70 MPa, and Poisson’s ratio = 0.2. The model parameters are determined using the creep data for 0.15 M bath molarity and used to predict the creep curve for the 2 M bath molarity. The diffusion coefficient D is 12.5 × 10⁻⁴ m2/sec for Co = 0.15 M and 3.5 × 10⁻⁴ m2/sec for Co = 2 M. The experimental data is shown in Fig. 7(d) and the model simulations are shown in Fig. 7(e). We have not attempted a one-to-one comparison since the experiment represents a boundary value problem of indentation, while our simulation is carried out using a single RVE. However, the relative magnitudes and shapes of the creep curves compare well.
5 Summary and conclusions
We have derived a poromechanical theory of fluid-saturated chemically active fibrous media by considering the fiber network microstructure, chemical potential driven fluid flow, and micro-poromechanics. In the derived theory, the dry fiber network is modeled using the framework of granular micromechanics. The micro-poromechanics method based upon Hill’s volume averaging principles is then utilized to derive expressions for the poromechanical parameters Bij and Γ. The derived equations are formulated in an incremental form to account for fiber nonlinearity, large deformations, and rate of fluid-flow. A chemical potential gradient driven transport model is incorporated, which at chemical equilibrium between the material and the surrounding fluid bath yields Donnan’s osmotic pressure. In the resultant model: (1) the fiber network tangent stiffness, Cijkl, is obtained in terms of the fiber mechanical properties and fiber directional distribution, (2) the poromechanical parameters, Bij and Γ are obtained in terms of the relative stiffness of the fiber network with respect to the fiber material, and (3) the influence of the evolution of tangent stiffness and poromechanical parameters on the fluid flow is obtained through their effect on the chemical potential. The fluid-flow and the pore pressure develop both due to chemical activity and mechanical loading. Thus the derived theory provides a method determining the contributions of the mechanical aspects and chemical aspects to the load bearing abilities as well as rate-dependent behavior of these materials. The applicability of the model is demonstrated by comparison with the experimentally observed behavior as well as through parametric studies for confined/unconfined uniaxial loading conditions and a variety of surrounding fluid bath molarity. The proposed model is found to be particularly suitable for cartilage-type soft materials that can be described as composed of a hydrogel matrix of low stiffness reinforced by a network of stiff collagen fibers. The charged proteoglycan assemblies in the hydrogel matrix are imbedded into the collagen fiber network to form a complex microstructure [73]. Furthermore, the interaction of collagen network and the hydrogel forms the main load bearing component as demonstrated by the experimental result that articular cartilage loses ~ 84% of its stiffness when the collagen fiber network has been digested using collagenase while its loses ~ 63% of its stiffness when proteoglycans are digested with trypsin [74]. In this case, the effective behavior of the collagen fiber-gel interaction can be expeditiously represented by the fiber element as shown by our results.
The model predictions are found to show similar trends of stress-strain behavior as experimentally observed for articular cartilage. For example, the model predicts the apparent yield observed under drained conditions and the change of stiffness with surrounding fluid bath molarity. The model also (1) exhibits the post-yield stiffening behavior and the reduction in Poisson’s ratio in the drained conditions; and (2) shows the influence of fiber pre-strain and evolution of fiber network structure with loading on the overall behavior and the poromechanical parameters and thus models the phenomenon of induced anisotropy. Traditionally, the constitutive laws used to describe these materials have assumed poromechanical parameter Bij to be unity and Γ to be zero. In the theory presented here, the poromechanical parameters can be calculated under a given set of loading conditions. The evolution of the poromechanical parameters with loading is critical for investigating the solid-fluid interaction in load bearing and deformation. The poromechanical parameter Bij is found to deviate by up to 10% or more from unity, while Γ is found to be a multiple of water compressibility which agrees with the measured bulk modulus of cartilage. Particularly in the cases of low surrounding fluid bath molarity and small strains, trivial assumptions for poromechanical parameters might lead to erroneous conclusions. Finally we note that in this paper, we have presented results for monotonic quasi-static loading under drained conditions as well as fluid flow-dependent creep and relaxation behavior. The model can also be utilized to obtain the rate-dependent behavior of poromechanical materials, such as cartilage which exhibit primarily poromechanical characteristics as opposed to viscoelasticity as shown by the significant sensitivity in equilibration times to specimen size [75]. The derived model provides a method for determining the load sharing between the fiber network and the pore-fluid which is necessary for describing the transient behavior of these materials.
The results of our simulation show that confinement plays an important role in determining the contribution of the fiber network to load bearing. Therefore, the confining stress can be critical for determination of matrix failure in soft tissues, although these simulations were not presented in this paper. Further, we have only described the cases of creep and relaxation of an initially isotropic fiber network. The model can be used to study mechanical behavior under varying loading rates as well as incorporate inherent fiber anisotropy using fabric tensors [50]. We note that the analysis presented here is focused on a system where the solid matrix is composed of a fibrous network. Since the presented methodology relates the effect of micro-scale interactions on the chemo-poro-mechanical macro-scale behavior, we believe it is relevant to the rate-dependent behavior of different types of porous media such as cement paste, hydrogels, granular soils, rocks and hydrophilic polymers, each of which incorporate grain-grain or molecular interactions and chemical activity at a smaller scale. For these materials as well as for the fibrous materials, the inherent rate-dependence due to grain-interaction or fiber viscous effects and degradation or damage can be potentially incorporated as discussed in [48]. Furthermore, we note that for the porous materials of the type considered here, the behavior may be affected by other micro-scale phenomena, such as capillarity, as well as by occurrence of thin boundary layers which are best modeled using higher-gradient approaches [40, 41, 58]. The present methodology can be potentially applied to obtain the relevant constitutive parameters for these higher-gradient poromechanical theories.
Acknowledgments
This research is supported in part by: United States USPHS Research Grant NIH/NIDCR DE014392 (PS), NIH/NIDCR DE022054 (PS) and United States National Science Foundation grant CMMI-1068528(AM).
Appendix. Fiber orientation density function
The fiber orientation density function expressed in spherical coordinates, ξ(θ, ϕ), is written in a discrete form as follows:
| (61) |
where, M is the total number of fibers, δ(n−nj) = δ(θ−θj)δ(ϕ− ϕj)/sin θ, δ refers to the Dirac delta, and the superscript j refers to the observed fiber directions. The observed discrete directional density of the type given by Eq. (61) can be modeled as spherical harmonic expansions [50, 76]. Other forms of smooth orientation distribution functions, particularly exponential forms that appear as extensions of von Mises or Fisher distributions may be used. For practical calculations, transversely isotropic fiber orientation can be expressed as
| (62) |
where a20 = the anisotropy factor. The isotropic fiber orientation can be expressed as a20 = 0.
References
- 1.Shraiman BI. Mechanical feedback as a possible regulator of tissue growth. Proc Natl Acad Sci USA. 2005;102(9):3318–3323. doi: 10.1073/pnas.0404782102. [DOI] [PMC free article] [PubMed] [Google Scholar]
- 2.Ateshian GA, Humphrey JD. Continuum mixture models of biological growth and remodeling: past successes and future opportunities. Annu Rev Biomed Eng. 2012;14:97–111. doi: 10.1146/annurev-bioeng-071910-124726. [DOI] [PubMed] [Google Scholar]
- 3.Cowin SC, Humphrey JD. Cardiovascular Soft Tissue Mechanics. Springer; Berlin, Heidelberg, New York: 2002. [Google Scholar]
- 4.Sacks MS, Merryman WD, Schmidt DE. On the biomechanics of heart valve function. J Biomech. 2009;42(12):1804–1824. doi: 10.1016/j.jbiomech.2009.05.015. [DOI] [PMC free article] [PubMed] [Google Scholar]
- 5.Holzapfel GA, Ogden RW. Biomechanics of Soft Tissue in Cardiovascular Systems. Springer; Berlin, Heidelberg, New York: 2003. [Google Scholar]
- 6.Detamore MS, Athanasiou KA. Structure and function of the temporomandibular joint disc: Implications for tissue engineering. J Oral Maxillofacial Surg. 2003;61(4):494–506. doi: 10.1053/joms.2003.50096. [DOI] [PubMed] [Google Scholar]
- 7.Kuboki T, Shinoda M, Orsini MG, Yamashita A. Viscoelastic properties of the pig temporomandibular joint articular soft tissues of the condyle and disc. J Dental Res. 1997;76(11):1760–1769. doi: 10.1177/00220345970760110701. [DOI] [PubMed] [Google Scholar]
- 8.Singh M, Detamore MS. Tensile properties of the mandibular condylar cartilage. J Biomech Eng Trans ASME. 2008;130(1) doi: 10.1115/1.2838062. [DOI] [PubMed] [Google Scholar]
- 9.Luo Y, Shoichet MS. A photolabile hydrogel for guided three-dimensional cell growth and migration. Nature Materials. 2004;3(4):249–253. doi: 10.1038/Nmat1092. [DOI] [PubMed] [Google Scholar]
- 10.Nowak AP, Breedveld V, Pakstis L, Ozbas B, Pine DJ, Pochan D, Deming TJ. Rapidly recovering hydrogel scaffolds from self-assembling diblock copolypeptide amphiphiles. Nature. 2002;417(6887):424–428. doi: 10.1038/417424a. [DOI] [PubMed] [Google Scholar]
- 11.Misra A, Spencer P, Marangos O, Wang Y, Katz JL. Parametric study of the effect of phase anisotropy on the microme-chanical behaviour of dentin-adhesive interfaces. J R Soc Interface. 2005;2(3):145–157. doi: 10.1098/rsif.2005.0029. [DOI] [PMC free article] [PubMed] [Google Scholar]
- 12.Biot MA. General theory of three-dimensional consolidation. J Appl Phys. 1941;12(2):155–164. [Google Scholar]
- 13.Biot MA. Theory of finite deformations of porous solids. Indiana Univ Math J. 1972;21(7):597–620. [Google Scholar]
- 14.Biot MA. Theory of deformation of a porous viscoelastic anisotropic solid. J Appl Phys. 1956;27(5):459–467. [Google Scholar]
- 15.Truesdell C, Toupin R. The Classical Field Theories. Springer; Berlin, Heidelberg, New York: 1960. [Google Scholar]
- 16.Bowen RM. Compressible porous media models by use of the theory of mixtures. Int J Eng Sci. 1982;20(6):697–735. [Google Scholar]
- 17.Coussy O, Dormieux L, Detournay E. From mixture theory to Biot’s approach for porous media, Int. J Solids Struct. 1998;35(34):4619–4635. [Google Scholar]
- 18.Lai WM, Hou JS, Mow VC. A triphasic theory for the swelling and deformation behaviors of articular cartilage. J Biomech Eng. 1991;113(3):245–258. doi: 10.1115/1.2894880. [DOI] [PubMed] [Google Scholar]
- 19.Mow VC, Kuei SC, Lai WM, Armstrong CG. Biphasic creep and stress relaxation of articular cartilage in compression: Theory and experiments. J Biomech Eng. 1980;102(1):73–84. doi: 10.1115/1.3138202. [DOI] [PubMed] [Google Scholar]
- 20.Huyghe JM. Intra-extrafibrillar mixture formulation of soft charged hydrated tissues. J Theor Appl Mech. 1999;37(3):519–536. [Google Scholar]
- 21.Loret B, Simoes FMF. Articular cartilage with intra- and extrafibrillar waters: a chemo-mechanical model. Mech Mater. 2003;36(5–6):515–541. [Google Scholar]
- 22.Fortin M, Soulhat J, Shirazi-Adl A, Hunziker EB, Buschmann MD. Unconfined compression of articular cartilage: nonlinear behavior and comparison with a fibril-reinforced biphasic model. J Biomech Eng. 2000;122(2):189. doi: 10.1115/1.429641. [DOI] [PubMed] [Google Scholar]
- 23.Korhonen RK, Laasanen MS, Toyras J, Lappalainen R, Helminen HJ, Jurvelin JS. Fibril reinforced poroelastic model predicts specifically mechanical behavior of normal, proteoglycan depleted and collagen degraded articular cartilage. J Biomech. 2003;36(9):1373–1379. doi: 10.1016/s0021-9290(03)00069-1. [DOI] [PubMed] [Google Scholar]
- 24.Wilson W, Donkelaar CCV, Rietbergen BV, Ito K, Huiskes R. Stresses in the local collagen network of articular cartialge: a poroviscoelastic fibril-reinforced finite element study. J Biomech. 2004;37(3):357–366. doi: 10.1016/s0021-9290(03)00267-7. [DOI] [PubMed] [Google Scholar]
- 25.Wilson W, Donkelaar CCV, Rietbergen BV, Ito K, Huiskes R. A fibril-reinforced poroviscoelastic swelling model for articular cartilage. J Biomech. 2005;38(6):1195–1204. doi: 10.1016/j.jbiomech.2004.07.003. [DOI] [PubMed] [Google Scholar]
- 26.Ateshian GA, Rajan V, Chahine NO, Canal CE, Hung CT. Modeling the matrix of articular cartilage using a continuous fiber angular distribution predicts many observed phenomena. J Biomech Eng. 2009;131(6):1–10. doi: 10.1115/1.3118773. [DOI] [PMC free article] [PubMed] [Google Scholar]
- 27.Bursac P, McGrath CV, Eisenberg SR, Stamenovic D. A Microstructural model of elastostatic properties of articular cartilage in confined compression. J Biomech Eng. 2000;122(4):347–353. doi: 10.1115/1.1286561. [DOI] [PubMed] [Google Scholar]
- 28.Farquhar T, Dawson PR, Torzilli PA. A microstructural model for the anisotropic drained stiffness of articular cartilage. J Biomech Eng. 1990;112(4):415–425. doi: 10.1115/1.2891205. [DOI] [PubMed] [Google Scholar]
- 29.Federico S, Herzog W. Towards an analytical model of soft biological tissues. J Biomech. 2008;41(16):3309–3313. doi: 10.1016/j.jbiomech.2008.05.039. [DOI] [PubMed] [Google Scholar]
- 30.Quinn TM, Morel V. Microstructural modeling of collagen network mechanics and interactions with the Proteoglycan gel in articular cartilage. J Biomech Model Mechanobiol. 2007;6(1–2):73–82. doi: 10.1007/s10237-006-0036-z. [DOI] [PubMed] [Google Scholar]
- 31.Grillo A, Federico S, Wittum G. Growth, mass transfer, and remodeling in fiber-reinforced, multi-constituent materials. Int J Non-Linear Mech. 2012;47(2):388–401. doi: 10.1016/j.ijnonlinmec.2011.09.026. [DOI] [Google Scholar]
- 32.Madeo A, George D, Lekszycki T, Nierenberger M, Rémond Y. A second gradient continuum model accounting for some effects of micro-structure on reconstructed bone remodelling. C.R. Mécanique. 2012;340(8):575–589. [Google Scholar]
- 33.Madeo A, Lekszycki T, dell’Isola F. A continuum model for the bio-mechanical interactions between living tissue and bio-resorbable graft after bone reconstructive surgery. C.R. Mecanique. 2011;339(10):625–640. doi: 10.1016/j.crme.2011.07.004. [DOI] [Google Scholar]
- 34.Cowin SC. Bone poroelasticity. J Biomech. 1999;32(3):217–238. doi: 10.1016/s0021-9290(98)00161-4. [DOI] [PubMed] [Google Scholar]
- 35.Bennethum LS, Murad MA, Cushman JH. Modified Darcy’s law, Terzaghi’s effective stress principle and Fick’s law for swelling clay soils. Comput Geotech. 1997;20(3):245–266. [Google Scholar]
- 36.Sciarra G, dell’Isola F, Hutter K. A solid-fluid mixture model allowing for solid dilatation under external pressure. Contin Mech Thermodyn. 2001;13(5):287–306. [Google Scholar]
- 37.Wang X, Hong W. A visco-poroelastic theory for polymeric gels. Proc R Soc Lond A, Math Phys Eng Sci. 2012;468(2148):3824–3841. doi: 10.1098/rspa.2012.0385. [DOI] [Google Scholar]
- 38.Yoon J, Cai S, Suo Z, Hayward RC. Poroelastic swelling kinetics of thin hydrogel layers: comparison of theory and experiment. Soft Matter. 2010;6(23):6004–6012. [Google Scholar]
- 39.dell’Isola F, Guarascio M, Hutter K. A variational approach for the deformation of a saturated porous solid. A second-gradient theory extending Terzaghi’s effective stress principle. Arch Appl Mech. 2000;70(5):323–337. doi: 10.1007/s004199900020. [DOI] [Google Scholar]
- 40.Madeo A, dell’Isola F, Ianiro N, Sciarra G. A variational deduction of second gradient poroelasticity II: An application to the consolidation problem. J Mech Mater Struct. 2008;3(4):607–625. doi: 10.2140/jomms.2008.3.607. [DOI] [Google Scholar]
- 41.Sciarra G, dell’Isola F, Ianiro N, Madeo A. A variational deduction of second gradient poroelasticity part I: General theory. J Mech Mater Struct. 2008;3(3):507–526. doi: 10.2140/jomms.2008.3.507. [DOI] [Google Scholar]
- 42.Petite H, Viateau V, Bensaid W, Meunier A, de Pollak C, Bourguignon M, Oudina K, Sedel L, Guillemin G. Tissue-engineered bone regeneration. Nature Biotechnol. 2000;18(9):959–963. doi: 10.1038/79449. [DOI] [PubMed] [Google Scholar]
- 43.Cheng AHD. Material coefficients of anisotropic poroelasticity. Int J Rock Mech Mining Sci. 1997;34(2):199–205. [Google Scholar]
- 44.Dormieux L, Molinari A, Kondo D. Micromechanical approach to the behavior of poroelastic materials. J Mech Phys Solids. 2002;50(10):2203–2231. [Google Scholar]
- 45.Hoang SK. Poroviscoelasticity and Analytical Solutions of Selected Problems in Engineering. The University of Oklahoma; Oklahoma: 2011. [Google Scholar]
- 46.Quiligotti S, Maugin GA, dell’Isola F. An Eshelbian approach to the nonlinear mechanics of constrained solid-fluid mixtures. Acta Mech. 2003;160(1–2):45–60. doi: 10.1007/s00707-002-0968-z. [DOI] [Google Scholar]
- 47.Hoan SK, Abousleiman YN. Correspondence principle between anisotropic poroviscoelasticity and poroelasticity using micromechanics and application to compression of orthotropic rectangular strips. J Appl Phys. 2012;112:044907. doi: 10.1063/1.4748293. [DOI] [Google Scholar]
- 48.Misra A, Singh V. Micromechanical model for viscoelastic materials undergoing damage. Contin Mech Thermodyn. 2012;25(2–4):343–358. [Google Scholar]
- 49.Misra A, Yang Y. Micromechanical model for cohesive materials based upon pseudo-granular structure. Int J Solids Struct. 2010;47(21):2970–2981. [Google Scholar]
- 50.Chang CS, Misra A. Packing structure and mechanical properties of granulates. J Eng Mech. 1990;116(5):1077–1093. [Google Scholar]
- 51.Misra A, Marangos O, Parthasarathy R, Spencer P. Micro-scale analysis of compositional and mechanical properties of dentin using homotopic measurements. Lect Notes Comput Vis Biomech. 2012;20(3):245–266. [Google Scholar]
- 52.Dormieux L, Lemarchand E, Coussy O. Macroscopic and micromechanical approaches to the modelling of the osmotic swelling in clays. Transport in Porous Media. 2003;50(1–2):75–91. doi: 10.1023/A:1020679928927. [DOI] [Google Scholar]
- 53.Signorini A. Sollecitazioni iperastatiche. Rend Inst Lombardo. 1932;2(65):1–7. [Google Scholar]
- 54.Chang CS, Misra A. Theoretical and experimental study of regular packings of granules. J Eng Mech. 1989;115(4):704–720. [Google Scholar]
- 55.Gao HJ, Klein P. Numerical simulation of crack growth in an isotropic solid with randomized internal cohesive bonds. J Mech Phys Solids. 1998;46(2):187–218. doi: 10.1016/S0022-50969700047-1. [DOI] [Google Scholar]
- 56.Misra A, Chang CS. Effective elastic moduli of heterogeneous granular solids. Int J Solids Struct. 1993;30(18):2547–2566. [Google Scholar]
- 57.dell’Isola F, Sciarra G, Vidoli S. Generalized Hooke’s law for isotropic second gradient materials. Proc R Soc Lond A, Math Phys Eng Sci. 2009;465(2107):2177–2196. doi: 10.1098/rspa.2008.0530. [DOI] [Google Scholar]
- 58.dell’Isola F, Madeo A, Seppecher P. Boundary conditions at fluid-permeable interfaces in porous media: A variational approach. Int J Solids Struct. 2009;46(17):3150–3164. doi: 10.1016/j.ijsolstr.2009.04.008. [DOI] [Google Scholar]
- 59.Yang Y, Misra A. Micromechanics based second gradient continuum theory for shear band modeling in cohesive granular materials following damage elasticity. Int J Solids Struct. 2012;49(18):2500–2514. doi: 10.1016/j.ijsolstr.2012.05.024. [DOI] [Google Scholar]
- 60.Guggenheim EA. The conceptions of electrical potential difference between two phases and the individual activities of ions. J Phys Chem. 1929;33(6):842–849. [Google Scholar]
- 61.Loret B, Simoes FMF. Articular cartilage with intra-and extrafibrillar waters – mass transfer and generalized diffusion. Eur J Mech A, Solids. 2007;26(5):759–788. [Google Scholar]
- 62.Lanir Y. Biorheology and fluid flux in swelling tissues. 1. Bicomponent theory for small deformations, including concentration effects. Biorheology. 1987;24(2):173–187. doi: 10.3233/bir-1987-24210. [DOI] [PubMed] [Google Scholar]
- 63.Greene GW, Zappone B, Söderman O, Topgaard D, Rata G, Zeng H, Israelachvili JN. Anisotropic dynamic changes in the pore network structure, fluid diffusion and fluid flow in articular cartilage under compression. Biomaterials. 2010;31(12):3117–3128. doi: 10.1016/j.biomaterials.2010.01.102. [DOI] [PubMed] [Google Scholar]
- 64.Overbeek JT. The Donnan equilibrium. Prog Biophys Biophys Chem. 1956;6(1):57–84. [PubMed] [Google Scholar]
- 65.Kulmala KAM, Korhonen RK, Julkunen P, Jurvelin JS, Quinn TM, Kroger H, Toyras J. Diffusion coefficients of articular cartilage for different CT and MRI contrast agents. Med Eng Phys. 2010;32(8):878–882. doi: 10.1016/j.medengphy.2010.06.002. [DOI] [PubMed] [Google Scholar]
- 66.Chahine NO, Wang CCB, Hung CT, Ateshian GA. Anisotropic strain dependent material properties of bovine articular cartilage in the transitional range from tension to compression. J Biomech. 2004;37(8):1251–1261. doi: 10.1016/j.jbiomech.2003.12.008. [DOI] [PMC free article] [PubMed] [Google Scholar]
- 67.Milentijevic D, Torzilli PA. Influence of stress rate on water loss, matrix deformation and chondrocyte viability in impacted articular cartilage. J Biomech. 2005;38(3):493–502. doi: 10.1016/j.jbiomech.2004.04.016. [DOI] [PubMed] [Google Scholar]
- 68.Oloyede A, Flachsmann R, Broom ND. The dramatic influence of loading velocity on the compressive response of articular cartilage. Connective Tissue Res. 1992;27(4):211–224. doi: 10.3109/03008209209006997. [DOI] [PubMed] [Google Scholar]
- 69.Lu XL, Sun DDN, Guo XE, Chen FH, Lai WM, Mow VC. Indentation determined mechanoelectrochemical properties and fixed charge density of articular cartilage. Ann Biomed Eng. 2004;32(3):370–379. doi: 10.1023/b:abme.0000017534.06921.24. [DOI] [PubMed] [Google Scholar]
- 70.Lu XL, Mow VC, Guo XE. Proteoglycans and mechanical behavior of condylar cartilage. J Dental Res. 2009;88(3):244–248. doi: 10.1177/0022034508330432. [DOI] [PMC free article] [PubMed] [Google Scholar]
- 71.June RK, Mejia KL, Barone JR, Fyhrie DP. Cartilage stress-relaxation is affected by both the charge concentration and valence of solution cations. Osteoarthritis and Cartilage. 2009;17(5):669–676. doi: 10.1016/j.joca.2008.09.011. [DOI] [PMC free article] [PubMed] [Google Scholar]
- 72.Chahine NO, Chen FH, Hung CT, Ateshian GA. Direct measurement of osmotic pressure of Glycosaminoglycan solutions by membrane osmometry at room temperature. Biophys J. 2005;89(3):1543–1550. doi: 10.1529/biophysj.104.057315. [DOI] [PMC free article] [PubMed] [Google Scholar]
- 73.Horkay F. Interactions of cartilage extracellular matrix macromolecules. J Polymer Sci B, Polymer Phys. 2012;50(24):1699–1705. doi: 10.1002/polb.23191. [DOI] [PMC free article] [PubMed] [Google Scholar]
- 74.Huang Y-P, Wang S-Z, Saarakkala S, Zheng Y-P. Quantification of Stiffness change in degenerated articular cartilage using optical coherence tomography-based air-jet indentation. Connective Tissue Res. 2011;52(5):433–443. doi: 10.3109/03008207.2011.555824. [DOI] [PubMed] [Google Scholar]
- 75.McCutchen C. Cartilage is poroelastic, not viscoelastic (including and exact theorem about strain energy and viscous loss, and an order of magnitude relation for equilibration time) J Biomech. 1982;15(4):325–327. doi: 10.1016/0021-9290(82)90178-6. [DOI] [PubMed] [Google Scholar]
- 76.Kanatani KI. Distribution of directional-data and fabric tensors. Int J Eng Sci. 1984;22(2):149–164. [Google Scholar]