Abstract
Several environmental pollutants, including metals can induce toxicological effect on aquatic animal species. Most studies to understand the toxicity of arsenic compounds were performed in mammalian cells; however, the study of the arsenic toxicity to the aquatic animals’ species, including fish, is limited. So the objective of this study was first to investigate the effects of As2O3 induced toxicity particularly on apoptosis and necrosis mediated cell death in fish cell PLHC-1 as compared to the mechanism of toxicity from known mammalian cell lines, secondly to relate in vitro effects in fish to those demonstrated by in vivo systems. To conduct this study, PLHC-1 cells were exposed to various concentrations of As2O3 (0–100μM) for 10, 20 and 40 h. The results indicate that As2O3 exposure promoted apoptotic and necrotic mediated cell death in a concentration and time dependent manner. Cell death (apoptotic and necrotic) induced by As2O3 was further confirmed by changes in various phases of cell cycle, DNA fragmentation (necro- comet and apo-comet) in the comet assay, alteration in mitochondrial membrane potential and formation of increased reactive oxygen species (ROS). Apoptotic mediated cell death was confirmed further by observing the increased caspase-3 activity and elevated expression of p53, cytochrome c and Bax proteins levels in the same experimental conditions. PLHC-1 cells were shown to be a good model for evaluating biochemical/cytotoxic effects following exposure to various reference chemicals and environmental contaminants. In vitro data obtained from this study provides a comprehensive approach for the elucidating the actual molecular mechanism for As2O3 induced toxicity particularly apoptosis and necrosis mediated cell death in PLHC-1 cell line.
Keywords: arsenic trioxide, PLHC-1, apoptosis, necrosis, p53, reactive oxygen species, Δψm
1. Introduction
Anthropogenic activities have increased the level of arsenic released into aquatic environment (Bhattacharya and Bhattacharya, 2007). Arsenic exists in both organic and inorganic forms, with the inorganic forms more toxic than organic (Gochfeld, 1995). In the aquatic environment, inorganic arsenic exists predominately in trivalent (As3+) and pentavalent (As5+) forms with the trivalent exhibiting more toxic effects than the pentavalent compound (Cervantes et al., 1994). Fish have been proven to be valuable test species to study the effects of toxicant uptake and bioaccumulation on metabolic activities and other functions. The acute lethality test has been used to characterize the toxicity of arsenic in several fish species as LC50, the dose of arsenic fatal to 50% of the individuals exposed (Buhl, 2002). The use of whole fish in metabolic studies is inconvenient, time consuming, expensive, and requires sacrificing organisms (Wang et al., 2004). Additionally, measurable endpoints in whole organism evaluation, such as condition indices, may be less sensitive than cellular changes.
In vitro assays have been developed to serve as an alternative or a supplementary bioassay for toxicity ranking of chemicals (Fent, 2001). The use of in vitro assays in ecotoxicological studies not only provides the opportunity for exploration from in vitro to in vivo systems, but also generates information on biological responses at a relatively high level of biological organization (Castano et al., 2003). Fish cell lines are appropriate for in vitro assays since they are believed to retain fish-specific traits in their metabolism of chemicals like arsenic. This paper reports for the first time the use of Poeciliopsis lucida hepato cellular cell line (PLHC-1) as test system to evaluate the cytotoxic effects of arsenic trioxide. PLHC-1 was selected for this study because (i) it retains the liver properties which is useful because liver is a major target organ of arsenic toxicity, (ii) it has metabolic activities, (iii) it is easy to propagate in culture at room temperature, (iv) the PLHC-1 cell line has proven a versatile test system for evaluating cytotoxic effect of various compounds (Pichardo et al., 2005; Caminda et al., 2006).
Wang et al. (2004) compared toxicity of subacute and acute levels of As2O3 in the fish cell lines JP and T0-2 using colony forming assay, morphological changes, apoptotic mediated cell death confirmed by DNA fragmentation and increased cell cycle arrest at subG1 phase. The purpose of the present study was to further characterize the adverse effects of As2O3 induced toxicity in PLHC-1 cell line using specific bioassays to characterize the mechanism of toxicity and compare this mechanism with results described in mammalian cell lines. Several techniques were used including i) Annexin V/PI staining to determine the amount of early apoptosis, late apoptosis and necrosis, (ii) Flow cytometry to evaluate progress of cell cycle, (iii) Comet assay to assess the pattern of DNA fragmentation, (iv) Expression of apoptosis associated regulatory proteins by immunoblotting and, (v) DEVD-AFC, DCDF-DA and JC-1 staining to determine caspase-3 activity, production of reactive oxygen species (ROS) and changes in mitochondrial membrane potential (Δψm) respectively. A second objective was to determine the cytotoxic concentration (IC50) of arsenic to relate in vitro adverse effect levels in the fish cell lines to those demonstrated by in vivo systems.
2. Materials and methods
2.1. Materials
As2O3 was purchased from Alfa Aesar (Ward Hill, MA); JC-1 Mitochondrial Membrane Potential Detection Kit from Cell Technology (Mountain View, CA); OxiSelect™ ROS Assay Kit from Cell Bio Labs, Inc. (San Diego, CA); Comet assay™ kit from Trevigen, Inc (Gaithersburg, MD; USA); Caspase-3 Fluorometric Assay Kit from Bio-Vision Research Products (Mountain View, CA); Annexin V-FITC/PI Kit System from Beckman Coulter (Brea, CA,USA); Lonza PAGE* Gold precast Gels from (Lonza Group Ltd, Switzerland); ECL Western Blotting Detection Reagent & Membrane from GE* Health Care Amersham*(Piscataway, NJ); X-ray Film from (Thermo Scientific); All primary and secondary antibodies from Santa Cruz Biotechnology, Inc (Delaware Avenue, CA); Positive Control Proteins, Biotinylated ladder and anti-biotined antibody from Cell Signaling Technology, Inc. (Danvers, MA); Pre-stained SDS-PAGE standards from Bio-Rad Life Science (Hercules, CA). All other tissue culture reagents and products were purchased from BD (Franklin Lakes, NJ).
2.2. Cell line
PLHC-1 cells (ATCC CRL-2406) were grown in 25 cm2 cell culture flasks at 30°C with 5% CO2 in Minimum Essential Medium containing 2mM/l- glutamine, 1% Pen/Strep (10,000 units’ penicillin and 10 mg streptomycin/ml) and supplemented with 5% of fetal bovine serum.
2.3. Determination of cytotoxicity dose 50 (IC50 of As2O3)
Concentrated stock of As2O3 (10 M) was prepared fresh each time in 0.1 N NaOH to minimize the oxidation of the chemical then serially diluted in PBS to desired concentrations and added to the growth media. The acute cytotoxicity dose (IC50 of arsenic) was determined by MTT assay (Mosmann, 1983).
2.4. Propagation of PLHC-1 cells
PLHC-1 cells (1×10⁵/ml) were grown in 24, 12 and 6 wells tissue culture plates for 2 or 3 days until 70–80% confluent. Once the desired cell density was reached, the culture medium was replaced with the fresh medium containing different doses of As2O3 (0–100 μM) for intervals of 10, 20 and 40 h. Negative control cells were treated with media and 100 μl PBS.
2.4.1. Cell proliferation study
Cells were seeded in 12-well plates, grown to 80% confluence and treated with various concentration of As2O3 at various time points as mentioned in the experimental conditions. The cell proliferation was assessed based on MTT assay (Mosmann, 1983).
2.4.2. Observation of morphological alterations of cells
Cells were seeded in 12-well plates, grown to 80% confluence and treated with As2O3 under the aforementioned experimental conditions. Cell morphology was observed (10X) and photographed using an inverted microscope (Olympus, Japan).
2.4.3. LDH leakage assay
Lactate dehydrogenase (LDH) activity in the extracellular medium (an indicator of membrane leakage) was measured by ELISA plate reader using a LDH assay kit (Biovision Research Products, USA) following manufacture’s specification.
2.4.4. Induction of apoptosis and necrosis by As2O3
Detection of apoptosis and cell necrosis was performed with Annexin V-FITC and PI staining assay. Following treatment with As2O3, cells were harvested by trypsin, labeled with Annexin V-FITC and PI (Beckman Coulter, Fullerton CA, USA) and then examined by flow cytometry (Becton Dickinson FACSCalibur™) using 488 nm excitation and band pass filters of 530/30nm (for FITC detection) and 585/42nm (for PI detection). A total of 10,000 cells were analyzed from each sample with the extent of early apoptosis, late apoptosis, and necrosis determined from the percentages of bound annexin V+/PI−, annexin V+/PI+, and annexin V−/PI+, respectively.
2.4.5. Determination of cell-cycle progress by flow cytometry
To determine the progress of cell growth under treatment conditions, cultures were treated with As2O3 and their DNA content was estimated by the method of Wang et al. (2004) with minor modifications. Briefly, trypsinized cells were first washed twice with PBS containing 1% serum and then fixed overnight at 4° C with 70% ethanol-PBS. Once fixed, cells were stained for 30 min at 37° C with a propidium iodide (1 mg/ml) PBS solution whose content included RNase A (10 mg/ml). Ten thousand cells were analyzed from each sample, using FACS to monitor DNA content (Accuri® C6 Flow Cytometer, Ann Arbor, MI). Data acquisition and percentages of cells in sub-G1, G1, S and G2/M phases of cell cycle were determined with CellQuest software (Becton Dickenson).
2.4.6. DNA damage by comet assay to differentiate apoptotic and necrotic mediated cell death
DNA damage was determined quantitatively according to the manufacturer’s specification using Comet assay™ kit from Trevigen, Inc (Gaithersburg, MD; USA). Detail methods in (supplementary material) Three comet slides were prepared per As2O3 dose and 50 SYBR Green stained cells were scored per slide with a fluorescence microscope (Olympus) connected with an HCC color camera system and analyzed using Perceptive Comet IV assay software analysis system (Haverhill, Suffolk; UK).
2.4.7. Determination of reactive oxygen species (ROS)
The levels of reactive oxygen species (ROS) were determined quantitatively and qualitatively by 2, 7-dichlorodihydrofluorescein diacetate (DCFH-DA) using the OxiSelect™ kit from Cell Bio Labs (San Diego, CA). For quantitative analysis, cells were separated and adjusted to 1×10⁵ cells/ml. Aliquots from each cell suspension (100 μl) were then gently mixed with a 1X solution of DCFH-DA reagent (100 μl) and incubated at 37°C for 1h. Following this incubation period, cells were lysed according to the manufacturer’s specifications and the reading from each cell suspension was measured with a florometric plate reader (Spectramax, Gemini EM) at excitation and emission wavelengths of 480 and 530 nm, respectively. Qualitative measurement of dye uptake by cells was performed according to the manufacturer’s protocol. All images were captured using an EVOSfl fluorescence microscope equipped with a GFP filter (470 nm excitation, 525 nm emission).
2.4.8. Evaluation of mitochondrial membrane potential damage (Δψm)
The extent of (Δψm) damage was determined by the JC 1 dye both quantitatively and qualitatively (Cell Technology, Mountain View, CA) according to the manufacturer’s specification and the overall fluorescence was measured with a fluorometric plate reader (Spectramax, Gemini EM) at excitation and emission wavelengths allowing the quantification of green (485 nm and 535 nm) and red fluorescence (550 nm and 600 nm). In dead or apoptotic cells, the ratio of red to green fluorescence is decreased compared to healthy cells - a finding which correlates to the integrity and functional status of the mitochondria. Qualitative assessment of JC-1 uptake by mitochondria was performed microscopically (EVOSfl fluorescence microscope) to detect fluorescent red J-aggregates at excitation and emission wavelengths of 531 nm and 593 nm, respectively.
2.4.9. Analysis of caspase-3 activity
The levels of caspase-3 activity were determined quantitatively using the Caspase-3 Fluorometric Assay Kit from Bio-Vision Research Products (Mountain View, CA) according to the manufacturer’s protocol, but with the following modifications: After treatment to arsenic, cells were separated and adjusted to 1×10⁵ cells/ml. Next, each cell suspension (100 μl) was centrifuged at 2000 rpm for 10 minutes and pellets were re-suspended in chilled cell lysis buffer (50 μl) containing protease inhibitor. These were then incubated on ice for 10 min. After incubation, 50 μl of 2X reaction buffer and 5 μl of 1mM DEVD-AFC were added to each tube and incubated at 37°C for 60 minutes. Caspase-3 activity in cell lysates was then measured with a fluorometric plate reader (Spectramax, Gemini EM) at excitation and emission wavelengths of 400 nm and 505 nm, respectively
2.4.10. Preparation of protein extract for western blot analysis
As2O3 treated cells from each plate were washed with cold PBS, removed with trypsin and centrifuged at 2000 rpm for 10 min. Cell were lysed with lysis buffer (25mM HEPES pH 7.5, 5mM MgCl2, 5mM EDTA, 5mM DTT, 2mM PMSF supplemented with protease inhibitors) and incubated on ice for 30 min. To ensure complete lysis of the cells from the previous step, the suspensions were subjected to brief sonication and then centrifuged at 14000 rpm at 4° C for 15 min. The supernatants were collected and the protein contents from each were then estimated with Bradford reagent using bovine serum albumin as the standard. Fifty μg of total protein per well was then subjected to electrophoresis using 10% and 15% precast SDS-PAGE gels sodium dodecyle sulfate poly acrylamide gel electrophoresis (Lonza).
2.4.10.1. Visualization and quantification of protein bands by western blotting (supplementary material)
2.5. Statistical analysis
All experiments were performed in triplicate and all values were expressed as mean ± standard deviation (SD) or standard error of the mean (SEM). Statistical significance was determined by a one way ANOVA using SigmaStat (Aspire Software International, Auburn VA).
3. Results
3.1. Determination of cytotoxicity dose 50 (IC50 of As2O3) values
Fig. 1A shows the data of the MTT assay to determine the cytotoxicity dose (IC50 of As2O3) value. The IC50 values for As2O3 were found to be approximately 80–100 μM. Based on these IC 50 values, the decision was made to vary the concentrations of As2O3 from 2–100 μM for further studies.
Fig. 1.
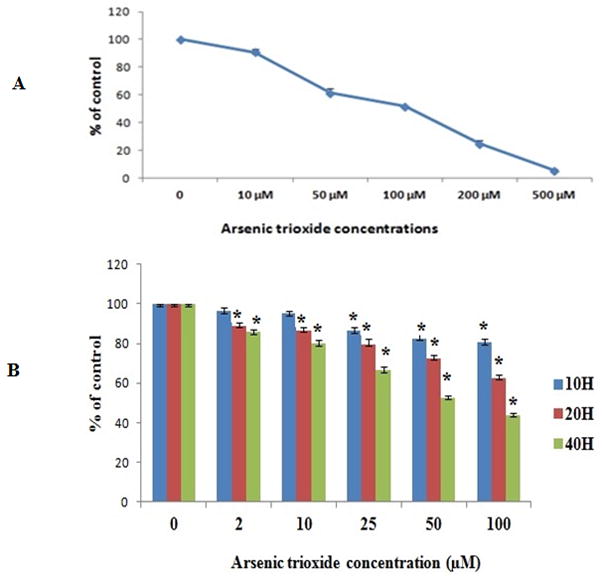
A. Cytotoxicity of arsenic trioxide to PLHC-1”. Cells were treated with an indicated concentration of As2O3 (0–500 μM) for 24 h to determine the acute cytotoxicity dose (IC50 of As2O3). All values are represented as percentage of (n = 3) ± SEM. B MTT assay to determine cell proliferation at various time points against various concentrations of As2O3. All values are represented as percentage of (n = 3) ± SEM. Asterisks indicate significant different from control (*p < 0.05)
3.2. Dose-and time- dependent cell proliferation study
As shown in Fig. 1B, the inhibition of cell survival by As2O3 was time and concentration dependent with the survival rate decreasing when the cells were exposed for longer periods compared with control cells. At 10 h, only higher concentrations (≥25 μM) interfere with cell proliferation significantly (p<0.050), whereas at 20 and 40 h exposures, cells showed significant (p<0.050) difference in all concentrations compared to control cells.
3.3. Morphological effects of As2O3
Morphological changes produced by As2O3 were investigated for 40 h. Untreated control cells retain normalmorphology and attach firmly to the culture plates with random orientation (Fig. S1 - A), whereas 2, 10, 25, 50 and 100 μM concentrations of As2O3 cells showing remarkable cell damage: decreases in cell number, rounding effects, reduction in cell size, detachment from the substratum, hydropic degeneration of cytoplasm and more apoptotic bodies depending on the concentration of As2O3 (Fig. S1 B– F).
3.4. Measurement of LDH activity
As shown in Fig. S2, LDH leakage due to As2O3 was time and concentration dependent; LDH leakage started as early as at 10 h but the significant (p<0.050) variation was observed ≥25 μM. however, at 20 and 40 h exposed cells showing significant (p<0.050) reduction ≥10 μM compared to control cells.
3.5. Effect of As2O3 on apoptosis and necrosis
To investigate whether As2O3 induced apoptosis or necrosis mediated cell death, we used annexin V and PI double staining to detect cell membrane changes. Fig. 2A shows representative flow cytograms of cells exposed under 40 h. Arsenic exposure for 10, 20 or 40 h caused a time and a dose dependent increase in the number of cells expressing both stages of apoptosis as well as necrosis. Necrotic data obtained by flow cytometry using PI staining agrees with cell membrane damage data obtained by LDH assay (Fig. S2). Fig. 2C and D show cells exposed for 20 and 40 h demonstrate statistically significant differences in cell number at As2O3 concentrations from 2–100 μM at all three cell death categories (p<0.05).
FIG. 2.
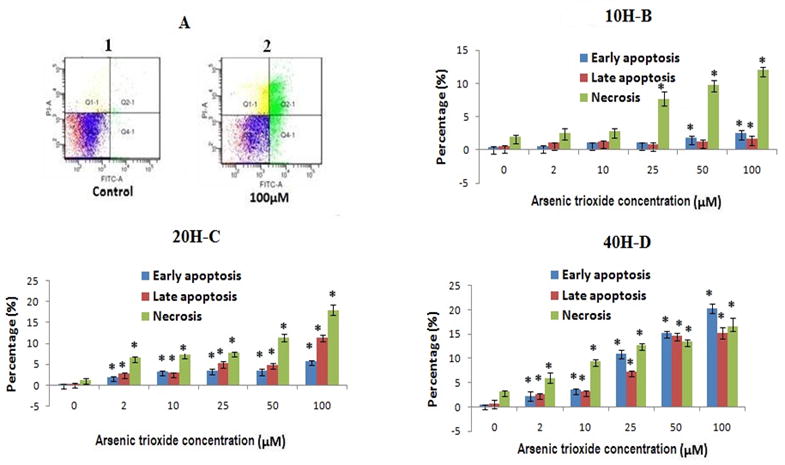
A Shown the representative cytogram of PLHC-I cell treated with As2O3 for 40 h: The apoptotic and necrotic cell death was assessed by measuring the exposure of phosphatidylserine residues on the cell surface as described under the “Material and Methods” (double staining with annexinV/FITC and PI). Legend for cytogram : the lower left quadrant includes the viable cells, which are negative for annexinV/FITC binding (annexin V−) and exclude PI (PI−); the lower right quadrant include early apoptosis cells, which are positive for annexin V/FITC biniding (annexin V+) but PI−; the upper right quadrant represent the late apototic cells, which are annexin V+ and show PI uptake (PI+); the upper left quadrant represents necrotic cells, which are annexin V−/PI+.
FIGS. 2B, C and D. Percentage (%) of early apoptotic, late apoptotic and necrosis cells. All values are represented as percentage of (n = 3) ± SEM. Asterisks indicate significant different from control (*p < 0.05)
3.6. Effect of As2O3 on the cell cycle
We performed PI staining to investigate cell cycle phases to confirm the apoptotic mediated cell death detected by annexin V and PI staining. Fig. 3A shows representative cytograms of PI stained DNA from PHLC-1 cells treated with As2O3. Fig. 3B show the sub-G1 (apoptotic) population at 40 h. Flow cytometric analysis demonstrated that the proportion of cells in the sub-G1, G1 and S stages increased while the G2/M stage decreased as As2O3 concentration increased. Complete data on the Cell Cycle response experiments is presented in Table. S1. At 10 h, there is a gradual increase in G1 stage and a decrease in the G2/M stage with increasing As2O3 concentrations, which becomes significant at the highest concentrations used. At 20 h this trend remains and the S phase also increases its proportion with increasing As2O3 concentrations, again becoming significant at the highest concentrations. At 40 h, the overall cell numbers begin to decline for all cell stages except sub G1 (apoptotic) phase, whose overall numbers increase with increasing As2O3 concentration. These observations suggested that arsenic arrested the cell cycle at G1 and S phase and induce apoptotic mediated cell death.
FIG. 3.
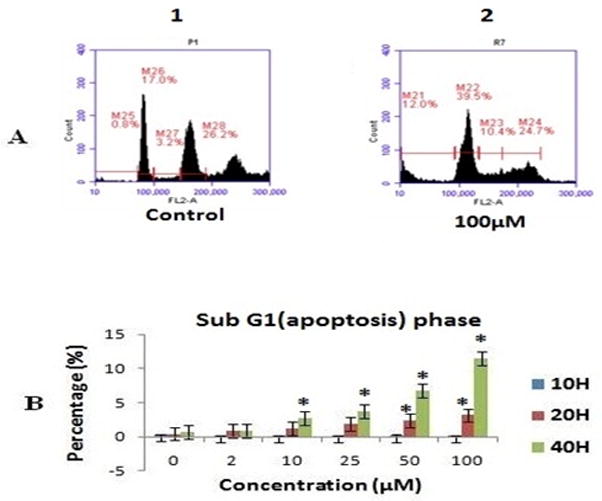
Shown the effect of As2O3 treatment on the cell cycle distribution in PLHC-1 cells was monitored by treating exponentially growing cells with an indicated concentration of As2O3 of (0–100 μM) for 10, 20 and 40 h. A representative cytogram of cell cycle distribution in PLHC-1 cultures cells at 40 h samples, B flow cytometry analysis showed that As2O3 increased the apoptotic (sub G1) population in the cell cycle in a dose and time dependent manner in PLHC1 cells. All values are represented as percentage of (n = 3) ± SEM. Asterisks indicate significant different from control (*p < 0.05)
3.7. Induction of nucleosomal DNA fragmentation
We performed the alkaline comet assay to assess DNA strand breaks after arsenic exposure. The nuclear DNA of untreated cells is perfectly round and retains a highly organized association with matrix proteins in the nucleus Fig. 4A(i). The nuclear DNA of arsenic-treated cells lose their compact structure, relax and show a range of DNA damage ranging from low to high (Fig. 4Aii–iv). Two qualitative changes in the pattern of DNA fragmentation are the necro-comet and apo-comet (Fig 4A(v–vi). DNA damage was determined by measuring tail length, tail moment, and % tail intensity. At 40 h all concentrations show increased tail length, tail moment and % tail intensity, which resulted in statistically significant results (p<0.050) (Fig. 4B). At 10 hr no significant DNA damage was measured while at 20 hr, higher concentrations significantly damaged DNA (data not shown). We scored apo-comets (hedgehog comet) separately to confirm cells undergo apoptosis after arsenic exposure. The extensive DNA fragmentation present in apoptotic cells allows most of DNA migrates, leaving only a small amount in the comet head (Fig. 4A(vi). Fig. 4C illustrates that statistically significant (p<0.05) increase in apo-comets is observed with increasing As2O3 concentrations.
FIG. 4.
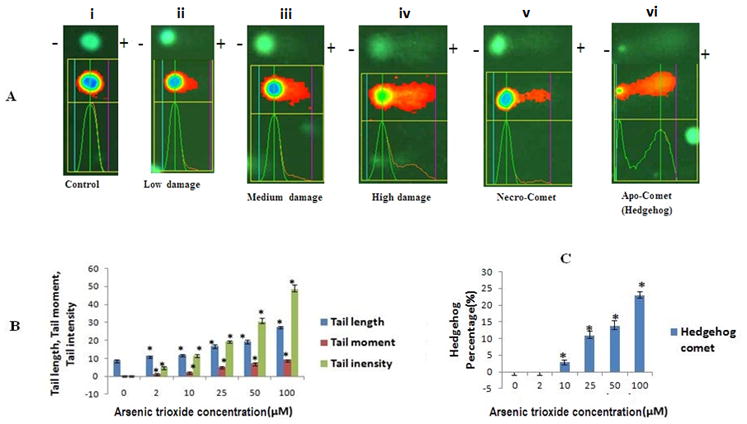
Shown the typical fluorescence microscopic image of comets cells (10X) due to DNA stand breaks observed after alkaline gel electrophoresis. The plus and minus signs indicate the anode and cathode during the electrophoresis (negatively charge DNA migrates towards the anode). All values are represented as percentage of (n = 3) ± SEM. Asterisks indicate significant different from control (*p < 0.05)
3.8. Generation of reactive oxygen species (ROS)
In As2O3 exposure, significant changes in relative ROS were observed at 10 and 20 h when As2O3 levels were at 25–100 μM at 10 h and 10–100 μM at 20 h (Fig. 5A). No increases in fluorescent intensity were observed at 40 h, possibly due to induced apoptotic and necrotic cell death (Fig. 2). In a qualitative assay, cells treated with DCFH-DA were microscopically assayed for fluorescent staining. The uptake of the DCFH-DA substrate and its increased levels of hydrolysis by cells occurred at 20 h. Fig. 5B demonstrate changes in fluorescent intensity at 10–100 μM. These findings were in agreement with the levels of ROS determined quantitatively (Fig. 5A).
FIG. 5.
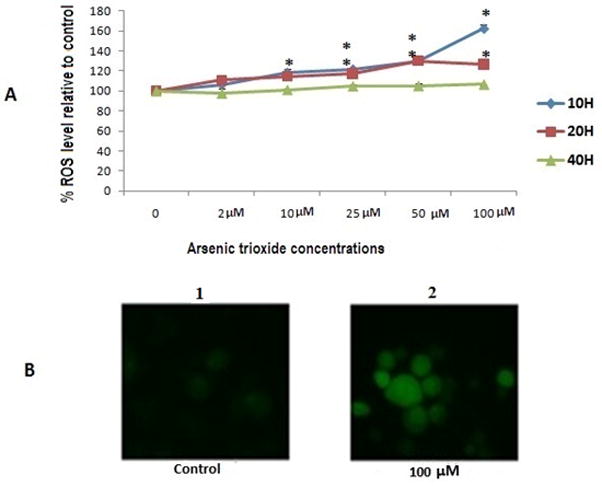
Generation of reactive oxygen species (ROS) was evaluated with PHCL-1 cell line using the fluorescent probe DCFH-DA. A Quantitative analysis. B Fluorescence microscopic image. All values are represented as percentage of (n = 3) ± SEM. Asterisks indicate significant different from control (*p < 0.05)
3.9. Analysis of mitochondrial membrane potential (Δψm) damage
ROS production usually precedes or accompanies the loss of mitochondrial membrane potential (Δψm,). Fig. 6A compares Δψm in untreated control cells with cells treated with As2O3 at various concentrations and exposure times. Significant changes in Δψm were observed in cells exposed to As2O3 at all three time points and all concentrations (except 2 μM at 10 h) (Fig. 6A). Since mitochondrial membrane potential damage occurred as early as 10 h, this may be a very sensitive cytotoxicity marker. When Δψm levels were assessed qualitatively with JC-1 dye using fluorescence microscopy, there was strong agreement between qualitative and quantitative data (Fig. 6A and B) with decrease in red fluorescence with higher As2O3 concentrations.
FIG. 6.
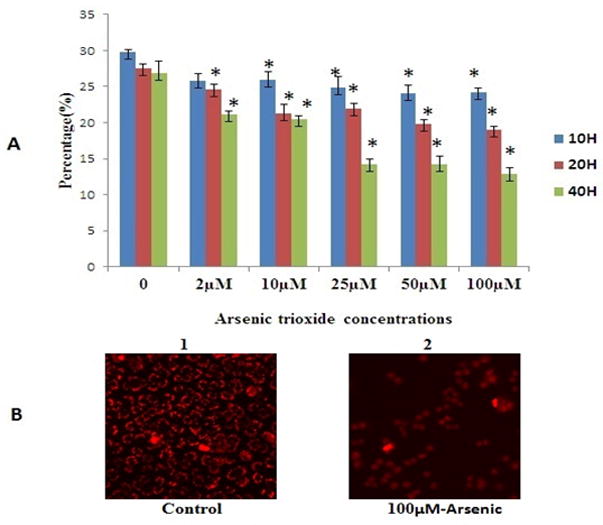
Mitochondria membrane potential (Δψm) damage was evaluated with PLHC-1 cell line using the fluorescent dye JC-1. A Quantitative analysis. B Fluorescence microscopic image. All values are represented as percentage of (n = 3) ± SEM. Asterisks indicate significant different from control (*p < 0.05)
3.10. Analysis of caspase-3 activity
Fig. S3. shows caspase-3 activity in untreated control cells (set at 100%) and with cells treated with As2O3 at various concentrations and exposure times. At 10 h exposure, capase 3 activity reached maximum when arsenic concentration was set at 25–100 μM. At longer exposure periods (e.g., 20 and 40 h), caspase-3 activity reached maximal levels at lower concentrations of arsenic (Fig. S3). In all cases, there was a strong dose dependent caspase-3 response. Our results indicated rapid response to As2O3 in PLHC-1 cells in caspase-3 activity.
3.11. Expression of apoptosis associated regulatory proteins
Fig. 7 shows the Western blots for four proteins (p53, Bax, Bcl-2 and Cytochrome-c) under As2O3 exposure conditions at the treatment time where the most pronounced response was observed. Significant increases were seen in p53 and Bax expression with increasing arsenic concentrations at 10 h exposure, although expression decreased at 20 and 40 h to levels similar to controls (data not shown). Cytochrome c levels increased at various concentrations of arsenic at 20 h exposure and remained elevated at 40 h (data not shown). Bcl-2 levels decreased in cells exposed to arsenic for 40 h versus control cells.
FIG. 7.
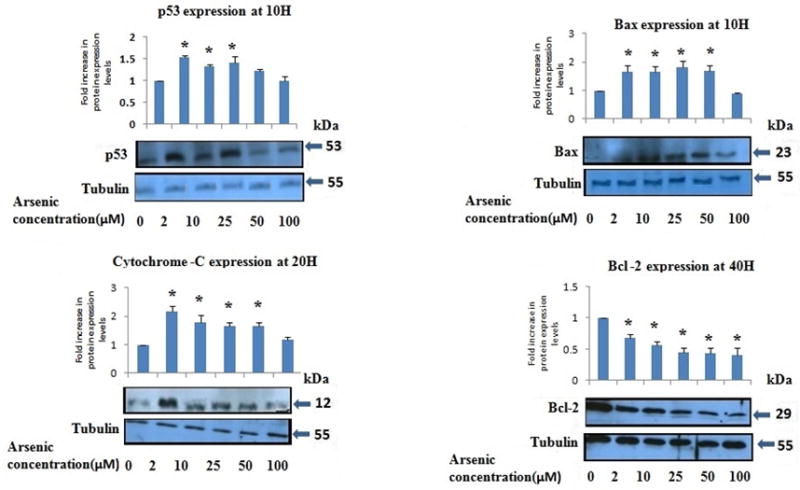
Expression of apoptosis associated regulatory proteins in PLHC-1 cultures with increasing As2O3”. All values are represented as percentage of (n = 3) ± SEM. Asterisks indicate significant different from control (*p < 0.05)
4. Discussion
In the in vivo literature, arsenic concentrations are expressed as mg/l compound or mg/l dissolved arsenic rather than as μM concentrations for in vitro studies. Table. S2 illustrate the conversion of these measurements compared with those used in this study. The 96-h LC50 of sodium arsenite for 4.5 g rainbow trout (Oncorhynchus mykiss) is 21.0 mg/l (about 162 μM), and all fish exposed to arsenite concentrations of 9.64 mg/l (about 74.2 μM) over 17 weeks showed inflammation of gall bladder wall, a lesion absent at lower exposure concentrations (Rankin and Dixon, 1994). The toxic concentration of sodium arsenite affecting accumulation of arsenic in Tilapia mossambica under 7-day exposure was 10 mg/l (about 77 μM) (Suhendrayatna et al., 2002). The PLHC1 cell line responded to As2O3 levels similar to the more sensitive taxa described in the in vivo studies above, with 80 – 100 μM (about 16 to 19.78 mg) of As2O3 effectively inducing 50 % cell mortality in fish cell line. Morphological alterations/interference of cell proliferation are considered to be primary indications of cytotoxicity and its underlying mechanism (Wang et al., 2004). We observed interference with cell proliferation in As2O3 treated cells. We also observed concentration dependent severe morphological changes in cultures. These results are in agreement with previous studies in fish cell lines (Wang et al., 2004; Seok et al., 2007).
The range of arsenic concentrations inducing effects in the PHLC1 cell line and the zebra fish liver cells and JP and T0-2 are similar to those found to induce cellular level changes in whole organisms (Abdel-Hameid, 2009). After 9 days of exposure to sub-lethal concentrations of arsenic, the nile catfish showed biochemical and histological changes. However, exposure testing with the PHLC1 cell line was completed in a much shorter time frame and without the need to sacrifice the organisms. These findings suggest that cultured cell lines may be useful in predicting in-stream effects of contaminant exposures and offer a viable alternative to whole organism testing.
Apoptosis and necrosis observed in the present study at lower concentrations than reported for mammalian studies. Our data indicate an effective concentration in the range of 2 to 100 μM as compared with data generated by Wang et al. (2009) in Chang human hepatocytes. In the human cells treated with As2O3 for 24 h a dose response increase was noted in both early and late apoptosis stages. The highest response was at the 30 μM concentration in which 35% of cells were in the early and 12% were in late apoptosis compared with 7% and 1 % in untreated controls. Although As2O3 did not induce apoptosis effectively in the present study at 10 h intervals, survival rates were substantially reduced as indicated by MTT assay. LDH leakage suggests that mortality may result from cells going through necrosis.
As2O3 arrested the cell cycle at G1 and G2/M phase beginning at 10 h. Cell cycle arrest at sub G1 (apopotic) phase occurred when cells were exposed for 40 h. Although arsenic could not induce the apoptosis at 10 and 20 h intervals effectively, it still dramatically reduces their survival rate as revealed by MTT. That may result from cells going through necrosis after cell cycles is disturbed by arsenic. Similar results of necrosis, not apoptosis, following the G2/M arrest in colorectal cancer cells treated with aspirin (Subbegowda and Frommel, 1998). As2O3 has been reported to induce cell cycle arrest in mammalian cell lines at both G1 (Zhang et al., 1998) and G2/M phases (Qu et al., 2009), depending on the cell line used. Wang et al.(2004) report on two fish cell lines (JF and TO-2) exposed to arsenic, which underwent arrest in two different phases-subG1 for JF cells and G2/M arrest for TO-2 cells, which suggests that fish cell lines are also variable in their cell cycle response to As2O3.
The presence of DNA damage in the comet assay may be associated with cytotoxicity in the form of apoptosis or necrosis (Rundell et al, 2003). In the present study, we observed two different patterns of DNA fragmentation including small head and large tail (apo-comet) and large head with thin long tail (necro-comet) in all three time points. The more extensive DNA processing of apoptosis contrasts with more intact DNA in necrotic cell death. At 40 h, we observed more hedgehog or apo-comets when the elevated concentrations of the arsenic were used (≥ 10 μM) (Fig. 4C). The presence of comets in the primary hepatocytes was confirmed earlier in fish Clariasbat rachus L by (Datta et al., 2007) when sub- lethal concentration (0.5 μM) of arsenic was used in vivo method.
Reactive oxygen species (ROS) are generated within the mitochondria and damage mitochondrial components (koizumi et al., 1996). A cytotoxicity assay based on mitochondrial respiration activity would give early signs of cytotoxicity following exposure of a mitochondrial toxicant. Taken together, this suggests a potential mechanism for arsenic induced toxicity whereby arsenic disrupts mitochondria function that leads to an increase in intracellular ROS. Our data also support the conclusion that As2O3 exposure leads to increased levels of ROS and triggering apoptosis through the mitochondrial pathway. At 10 and 20 h exposure, we observed a significant change in mitochondrial membrane potential damage (Δψm), a sensitive marker of cytotoxicity. Changes in mitochondrial membrane potential and the release of cytochrome c from the mitochondria have been reported to occur from increased ROS levels leading to capsase 3 activation in As2O3 treated mammalian cells (Porter and Janicke, 1999; Wang et al., 2009). We also observed mitochondrial membrane potential damage followed by cytochrome c release into the cytosol at 20 and 40 h time points, which were the same conditions under which loss of mitochondrial membrane Δψm was observed. The caspase-3 response we observed began at an earlier time point at a time when ROS levels began to be significantly elevated.
The tumor suppressor p53 has been reported to play a role in regulating both the G1 and G2/M cell cycle checkpoints in human fibroblasts through induction of synthesis of inhibitors of cell cycle dependent kinases like p21/WAF1 (Agarwal et al., 1995). ROS, mitochondrial membrane damage and DNA damage have widely been reported to increase p53 expression in cells exposed to genotoxic agents including As2O3. Once activated, p53 can result in growth arrest or apoptosis. Rau-Embry et al. (2006) observed in PLHC-1 and primary trout cells, that p53 was not induced using model chemotherapeutic agents which triggered apoptosis. They concluded that there was a non-p53 pathway in fish. We observed an increase in p53 protein signal using western blot beginning at 10 h treatment as well as an increase in Bax at 10 h and a decrease in Bcl-2 signal at 40 h (Fig. 7). Based on the positive p53 response to As2O3 exposure in our results, we can conclude that p53 is involved in the response to As2O3 in fish cell lines.
It can be concluded from the present study that As2O3 induces cytotoxicity via apoptosis and necrosis mediated cell death depends on exposure dose and time. Apoptosis mediated cell death occurred more when cells were exposed for longer period (40h), which was closely associated by the activation of p53 pathway and release of other mitochondrial proteins into the cytosol during that period. On the other hands, necrotic mediated cell death caused by arsenic occurred much earlier at 10 h and extended up to 40 h; this may be connected with cell cycle arrest at various stages and changes at mitochondrial membrane potential damage and elevated production of reactive oxygen species, because these are very sensitive markers and an early signs of cytotoxicity. PLHC-1 cells were demonstrated to be a good model for evaluating biochemical/cytotoxic effects following exposure to various reference chemicals and environmental contaminants. Assays for toxicity used in this study can be evaluated in whole fish studies of environmental arsenic exposure to confirm the present results.
The in vitro data obtained from this study provides a new approach for elucidating the toxic effect of arsenic in aquatic ecosystems. The use of in-vitro evaluations using fish cell lines has significant implications for the evaluation of organism and community level effects in aquatic ecosystems. As2O3 frequently occurs in natural systems and anthropogenic discharges. Deposition of As2O3 into a common aquatic environment may cause toxic effects to aquatic animal species. Evaluation of these effects and other discharges at the organism and community levels requires significant field effort and number of animal euthanizations and is subject to significant variability. The use of in vitro techniques to evaluate real world effects is cost effective and practical. These techniques are also significant when rare or endangered species are involved. These findings warrant further investigation in the use of PLHC-1cell lines as they may be also used for evaluating stream and community effects.
Supplementary Material
Highlights.
In vitro data’s relevance to environmental arsenic exposure in whole fish is discussed.
Mechanism of arsenic induced toxicity is similar to that observed in mammalian cell lines.
This study represents a comprehensive approach, with several assays performed for the first time in PLHC-1 cells.
Arsenic trioxide induced cell death is mediated by elevated production of ROS and mitochondrial damage
Arsenic trioxide induces both apoptotic and necrotic DNA damage as shown by comet assay.
Acknowledgments
Support for this research was provided in part by NIH grant 5P20RR016477 and the West Virginia IDeA Network of Biomedical Research Excellence and by grants from HRSA “Center for Bioengineering and Biomanufacturing Commercialization”.
Abbreviations
- MTT
(3-(4, 5-Dimethylthiazol-2-yl)-2, 5-diphenyltetrazolium bromide
- IC50
inhibitory concentration
- FACS
fluorescence-activated cell sorter
- FITC/PI
fluorescein isothiocyanate propidium iodide
- JC-1 dye
5,5′,6,6′-tetrachloro-1,1′,3,3′-tetraethyl-benzamidazolocarbocyanin iodide
- DEVD-AFC
7-amido-4-methylcoumarine derivatives
- GFP
green fluorescent filter
- ECL solution
enhanced chemiluminescence
- DMSO
dimethyl sulfoxide
- μM
micromole
- EBSS
Earle’s balanced salt solutions
- ANOVA
analysis of variation
Footnotes
Publisher's Disclaimer: This is a PDF file of an unedited manuscript that has been accepted for publication. As a service to our customers we are providing this early version of the manuscript. The manuscript will undergo copyediting, typesetting, and review of the resulting proof before it is published in its final citable form. Please note that during the production process errors may be discovered which could affect the content, and all legal disclaimers that apply to the journal pertain.
References
- 1.Abdel-Hameid NAH. A protective effect of calcium carbonate against arsenic toxicity of the nile catfish (Clarias gariepinus) Turk J Fish Aquat Sci. 2009;9:191–200. [Google Scholar]
- 2.Agarwal ML, Agarwal A, Taylor WR, Stark GR. p53 controls both the G2/M and the G1 cell cycle checkpoints and mediates growth arrest in human fibroblasts. Proc Natl Acad Sci. 1995;92:8493–8497. doi: 10.1073/pnas.92.18.8493. [DOI] [PMC free article] [PubMed] [Google Scholar]
- 3.Bhattacharya A, Bhattacharya S. Induction of oxidative stress by arsenic in Clarias batrachus: involment of peroxisomes. Ecotoxicol Environ Saf. 2007;66:178–187. doi: 10.1016/j.ecoenv.2005.11.002. [DOI] [PubMed] [Google Scholar]
- 4.Buhl KJ. Fish and wild service study no: 2F 33–96 20003.84 page. 2002. The relative toxicity of water bone inorganic contaminants to the Rio Grande Silver minnow (Hybrgnathus amarus) and fathead minnow (Pimephales Promelas) in water quality simulating that in the Riograde, New Mexico, final report to U.S. [Google Scholar]
- 5.Caminda D, Escher C, Fent K. Cytotoxicity of pharmaceuticals found in aquatic systems: Comparison of PLHC-1 and RTG-2 fish cell lines. Aquat Toxicol. 2006;79:114–123. doi: 10.1016/j.aquatox.2006.05.010. [DOI] [PubMed] [Google Scholar]
- 6.Castano A, Bols N, Braunbeck T, Dierickx P, Halder M, Isomaa B, Kawahara K, Lee LE, Mothersill C, Part P, Repetto G, Sintes JR, Rufli H, Smith R, Wood C, Segner H. The use of fish cells in ecotoxicology. Alternatives Lab Anim. 2003;31:317–351. doi: 10.1177/026119290303100314. [DOI] [PubMed] [Google Scholar]
- 7.Cervantes C, Ji G, Ramirez JL, Silver S. Resistance to arsenic compounds in microorganisms. FEMS Microbiol Rev. 1994;15:355–67. doi: 10.1111/j.1574-6976.1994.tb00145.x. [DOI] [PubMed] [Google Scholar]
- 8.Datta S, Saha DR, Ghosh D, Majumdar T, Bhattacharya S, Mazumder S. Sub-lethal concentration of arsenic interferes with the proliferation of hepatocytes and induces in vivo apoptosis in Clariasbat rachus L. Comp Biochem Physiol-part-C. 2007;145:339–349. doi: 10.1016/j.cbpc.2007.01.005. [DOI] [PubMed] [Google Scholar]
- 9.Fent K. Fish cell lines as versatile tools in ecotoxicology: assessment of cytotoxicity, cytochrome P4501A induction potential and estrogenic activity of chemicals and environmental samples. Toxicol In Vitro. 2001;15:477–488. doi: 10.1016/s0887-2333(01)00053-4. [DOI] [PubMed] [Google Scholar]
- 10.Gochfeld M. Chemical agents. In: Gochfeld S, Herzstein M, Schenker J, MJ, editors. Environmental Medicine. St. Louis: Mosby; 1995. pp. 592–614. [Google Scholar]
- 11.Koizumi T, Shirakura H, Kumagaib H, Tatsumotoc H, Suzuki KT. Mechanism of cadmium-induced cytotoxicity in rat hepatocytes: cadmium-induced active oxygen-related permeability changes of the plasma membrane. Toxicology. 1996;114:125–134. doi: 10.1016/s0300-483x(96)03477-4. [DOI] [PubMed] [Google Scholar]
- 12.Mosmann T. Rapid colorimetric assay for cellular growth and survival: application to proliferation and Cytotoxicity assays. J Immunol Methods. 1983;65:55–63. doi: 10.1016/0022-1759(83)90303-4. [DOI] [PubMed] [Google Scholar]
- 13.Pichardo S, Jos A, Zurita JL, Salguero M, Camean AM, Repetto G. The use of the fish cell lines RTG-2 and PLHC-1 to compare the toxic effects produced by microcystines LR and RR. Toxicol In Vitro. 2005;19:865–873. doi: 10.1016/j.tiv.2005.06.016. [DOI] [PubMed] [Google Scholar]
- 14.Porter AG, Janicke RU. Emerging roles of caspase-3 in apoptosis. Cell Death Differ. 1999;6:99–104. doi: 10.1038/sj.cdd.4400476. [DOI] [PubMed] [Google Scholar]
- 15.Qu GP, Xiu QY, Li B, Liu YA, Zhang LZ. Arsenic trioxide inhibits the growth of human lung cancer cell lines via cell cycle arrest and induction of apoptosis at both normoxia and hypoxia. Toxicol Ind Health. 2009;25:505–515. doi: 10.1177/0748233709345936. [DOI] [PubMed] [Google Scholar]
- 16.Rankin MG, Dixon DG. Acute and chronic toxicity of waterborne arsenite to rainbow trout (Oncorhynchus mykiss) Can J Fish Aquat Sci. 1994;51:372–380. [Google Scholar]
- 17.Rau Embry M, Brilliard SM, Di Giulio RT. Lack of p53 induction in fish cells by model chemotherapeutics. Oncogen. 2006;25:2004–2010. doi: 10.1038/sj.onc.1209238. [DOI] [PubMed] [Google Scholar]
- 18.Rundell MS, Wager ED, Plewa MJ. The comet assay: Genotoxic or Nuclear fragmentation. Environ Molecul Mutagen. 2003;42:62–67. doi: 10.1002/em.10175. [DOI] [PubMed] [Google Scholar]
- 19.Seok SH, Baek MW, Lee HY, Kim DJ, Na YR, Noh KJ, Park SH, Lee HK, Lee BH, Ryu DY, Park JH. Arsenic induced apoptosis is prevented by antioxidants in zebra fish liver cell lines. Toxicol In Vitro. 2007;21:870–877. doi: 10.1016/j.tiv.2007.02.011. [DOI] [PubMed] [Google Scholar]
- 20.Subbegowda R, Frommel TO. Aspirin toxicity for human colonic tumor cells results from necrosis and is accompanied by cell cycle arrest. Cancer Res. 1998;58:2772–2776. [PubMed] [Google Scholar]
- 21.Suhendrayata Ohki A, Nakajima T, Maeda S. Studies on the accumulation and transformation of arsenic in freshwater organism II. Accumulation and transformation of arsenic compounds by Tilapia Mossambica. Chemosphere. 2000b;46:325–331. doi: 10.1016/s0045-6535(01)00085-6. [DOI] [PubMed] [Google Scholar]
- 22.Wang Y, Xu Y, Wang H, Xue P, Li X, Li B, Zheng Q, Sun G. Arsenic induces mitochondria-dependent apoptosis by reactive oxygen species generation rather than glutathione depletion in Chang human hepatocytes. Arch Toxicol. 2009;83:899–908. doi: 10.1007/s00204-009-0451-x. [DOI] [PubMed] [Google Scholar]
- 23.Wang YC, Chaung RH, Tung LC. Comparison of the cytotoxicity induced by different exposure to sodium arsenite in two fish cell lines. Aquat Toxicol. 2004;69:67–79. doi: 10.1016/j.aquatox.2004.04.007. [DOI] [PubMed] [Google Scholar]
- 24.Zhang W, Ohnishi K, Shigeno K, Fugisawa K, Naito K, Nakamura S, Takeshita K, Takeshita A, Ohno R. The induction of apoptosis and cell cycle arrest by arsenic trioxide in lymphoid neoplasms. Leukemia. 1998;12:1383–1391. doi: 10.1038/sj.leu.2401112. [DOI] [PubMed] [Google Scholar]
Associated Data
This section collects any data citations, data availability statements, or supplementary materials included in this article.


