Abstract
Purpose
Dynamic FDG imaging for prostate cancer characterization is limited by generally small size and low uptake in prostate tumors. Our aim in this pilot study is to explore feasibility of simultaneous PET/MRI to guide localization of prostate lesions for dynamic FDG analysis using a graphical approach.
Methods
Three patients with biopsy-proven prostate cancer underwent simultaneous FDG PET/MRI, incorporating dynamic prostate imaging. Histology and multi-parametric MRI findings were used to localize tumors, which in turn guided identification of tumors on FDG images. Regions-of-interest (ROIs) were manually placed on tumor and benign prostate tissue. Blood activity was extracted from an ROI placed on the femoral artery on PET images. FDG data was analyzed by graphical analysis using the influx constant Ki (Patlak analysis) when FDG binding appeared irreversible, and distribution volume VT [(reversible graphical analysis (RGA)] when FDG binding appeared reversible given presence of washout.
Results
Given inherent coregistration, simultaneous acquisition facilitated use of MRI data to localize small lesions on PET and subsequent graphical analysis in all cases. In two cases with irreversible binding, tumor had higher Ki than benign using Patlak analysis (0.023 vs. 0.006 and 0.019 vs. 0.008 mL/cm3/min). In one case appearing reversible, tumor had higher VT than benign using RGA (0.68 vs. 0.52 mL/cm3).
Conclusion
Simultaneous PET/MRI allows localization of small prostate tumors for dynamic PET analysis. By taking of advantage of inclusion of the femoral arteries in the field-of-view, we applied advanced PET data analysis methods beyond conventional static measures and without blood sampling.
Keywords: prostate cancer, MRI, PET, FDG, dynamic imaging
Introduction
The increased role in prostate cancer management of image guided biopsy and therapy, as well as of active surveillance, has created a critical need for accurate tumor localization using imaging[1–3]. MRI is increasingly being used for this purpose given the impact of multi-parametric imaging for improved diagnostic performance[3, 4], although is still prone to false-positive interpretations from such entities as prostatitis and benign prostatic hyperplasia, as well as false-negative interpretations in some tumors depending on tumor size, grade, and histologic architecture[5, 6]. PET has been explored as a complementary or alternative approach[7]. Much of the existing literature in this regard has performed PET using 18F-FDG, evaluating the standardized uptake ratio (SUV) measured at equilibrium at a single delayed time-point after radiotracer injection[7–11]. However, past studies observed suboptimal performance of standard FDG PET in primary prostate cancer detection and localization, reporting limited sensitivity and specificity compared with other imaging modalities[7–13], such that FDG PET is currently not widely used for this purpose.
An alternative approach is to perform PET in a dynamic fashion, acquiring frames at consecutive serial time-points after injection[14]. While not well evaluated in the prostate, this approach has shown value in isolated studies in cancers of the breast, colon, and liver[15–17]. One challenge of dynamic PET evaluation is that the data has often been assessed using a multicompartment pharmacokinetic model that entails complex and time-consuming computations, potentially requiring arterial blood sampling to provide an input function for the analysis[18, 19]. To greatly simplify the analysis, graphical methods have been described[18, 19]. With such approaches, the time-dependent radiotracer activity is plotted and converted to linear equations that are solved in a model-free non-iterative fashion using linear regression. By not requiring knowledge of the number, orientation, or time-dependence of radiotracer distribution compartments, graphical analysis can more rapidly and easily provide reliable estimates of radiotracer kinetic parameters. These parameters include Ki, the influx transfer rate constant from the plasma into tissue, and VT, the radiotracer distribution volume[18, 20]. The originally described technique for dynamic PET graphical analysis, termed Patlak analysis, can be applied if initial data assessment suggests irreversible binding of radiotracer in at least one tissue compartment[18, 21]. A subsequently developed approach, termed reversible graphical analysis (RGA), can be applied when binding appears reversible[19, 20, 22]. Both Patlak analysis and RGA can be performed without arterial blood sampling provided that a sufficiently large artery supplying the tissue of interest is included in the imaging field-of-view (FOV)[20].
Dynamic imaging using graphical analysis may be able to improve the role of FDG-PET in prostate cancer evaluation compared with static equilibrium imaging. Although having varying pharmacokinetics depending on the given agent, prostate tumors exhibit distinct kinetic properties compared with benign prostate tissue[23, 24], and inclusion of the femoral artery in the FOV provides an imaging-derived input function to facilitate the analysis. Despite this potential, dynamic PET of prostate cancer remains technically challenging. The small size and low radiotracer activity of many tumors, particularly during the early post-injection period, create difficulty in reliably localizing suspicious foci for further quantification. The advent of simultaneous PET/MRI systems may solve this challenge[25, 26]. Such systems provide truly simultaneous spatiotemporal acquisitions, achieving significantly improved alignment between PET and MRI image sets in comparison with separate acquisitions and retrospective fusion[27]. This raises the possibility of employing MRI’s ability to localize small tumors to facilitate identification of such lesions on dynamic PET images for subsequent kinetic analysis. If established, this approach could provide additional metabolic data that may enhance the ability to assess prostate tumors in comparison with current imaging techniques. Therefore, in this pilot study, our aim is to explore the feasibility of using simultaneous PET/MRI to guide localization of focal prostate lesions to allow for dynamic FDG analysis using a graphical approach.
Methods
Subjects
This prospective HIPAA-compliant study received approval from our institutional review board. All patients supplied written informed consent. Three patients with biopsy-proven prostate cancer (age range 59 to 70 years) were included. All patients had Gleason 3+3 tumor on biopsy.
Image acquisition
Patients underwent simultaneous PET/MRI using a clinical system comprising a 3T whole-body MR with an integrated PET detector (Siemens Biograph mMR). MRI was acquired using a pelvic phased-array coil. After a Dixon-based MR attenuation correction scan[28], turbo spin-echo T1-weighted imaging and axial diffusion-weighted imaging were performed. Then, both dynamic 3D gradient-echo T1W dynamic contrast-enhanced (DCE) MRI and dynamic list-mode PET imaging of the prostate were initiated simultaneously. Dynamic T1WI was acquired using a radial compressed-sensing scheme that provides 2.3 sec temporal resolution and 1x1x3 mm spatial resolution[29]. In comparison with the standard approach for administering the MRI and PET agents for clinical PET/MRI, the two injections were administered in this study as follows: 20 sec after the start of the dynamic MR acquisition, 0.1 mmol/kg gadolinium-chelate (Magnevist) was administered as an IV bolus followed by a saline flush, both administered at a rate of 3 cc/s; immediately upon completion of the flush, 8.49±2.04 mCi of 18F-FDG was administered by hand injection, also followed by a saline flush. Dynamic PET was performed for 30 min, with DCE-MRI acquired concurrently during the first 6 min of this period. Additional MR sequences including multiplanar T2W-TSE and large-FOV pelvic imaging, were performed during the remainder of the dynamic PET acquisition. The entire examination was completed in under 1 hour.
Image Reconstruction
Dose-normalized dynamic PET data was reconstructed into dynamic time-points starting with the detection of activity within the list-mode data. Specifically, such data was reconstructed in 5 second bins for 1 minute, followed by 30 second bins for 1 minute, 60 second bins for 3 minutes, 150 second bins for 5 minutes, and then 300 second bins for the remainder of the acquisition.
Image analysis
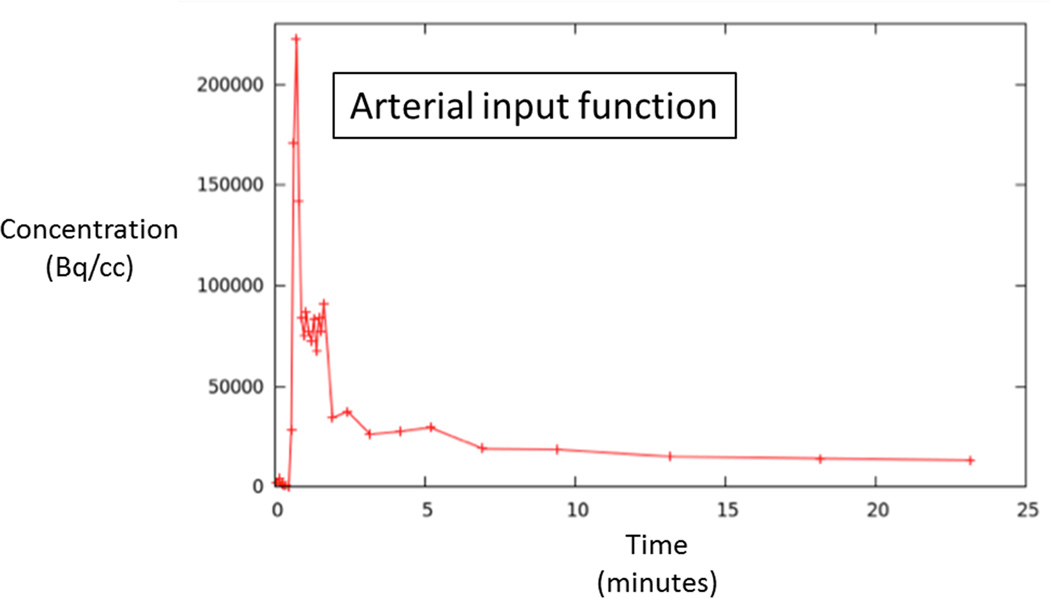
A single radiologist (XX, with six years of experience in prostate MRI) evaluated all MRI sequences (T2WI, DWI, and DCE) in conjunction with histologic findings from biopsy to localize tumors on multi-parametric MRI. This assessment was then used in turn to guide identification of tumors on dynamic FDG images. For each patient, following this joint evaluation of MRI and PET image sets, regions-of-interest (ROIs) were manually placed on PET images both within the tumor and the contralateral peripheral zone in an area benign on biopsy and appearing normal on all sequences. ROIs were placed using MIM™ (MIM Software Inc.). The ROI was made as large as possible within the tumor, while excluding its outer margin. The software generated FDG time-activity curves (TACs) for both the tumor and benign ROIs. In addition, blood activity was extracted from an ROI placed on the femoral artery to provide an image derived input function (IDIF). For this purpose, the ROI was placed on ten consecutive slices in the femoral artery, and top 25 voxels from this ROI were used to define the IDIF.
The dynamic FDG data was analyzed by graphical analysis. For cases in which FDG binding appeared irreversible (i.e., there was no washout on delayed images), Patlak analysis was applied to obtain the influx constant Ki. For cases in which the TAC suggested presence of washout over time and thus reversible tissue binding of FDG binding, RGA was applied to generate the distribution volume VT. To provide a static assessment of overall radioactivity during the imaging acquisition for comparison with dynamic metrics, the area-under-the-curve (AUC) was computed for tumor and benign prostate tissue for each case. The ratio of dynamic and static PET metrics between tumor and benign prostate tissue were compared in the three patients.
Results
Given its inherent coregistration, simultaneous acquisition facilitated use of multi-parametric MRI data to localize small lesions on PET in all three cases. In addition, graphical analysis using the IDIF was successfully performed in all patients.
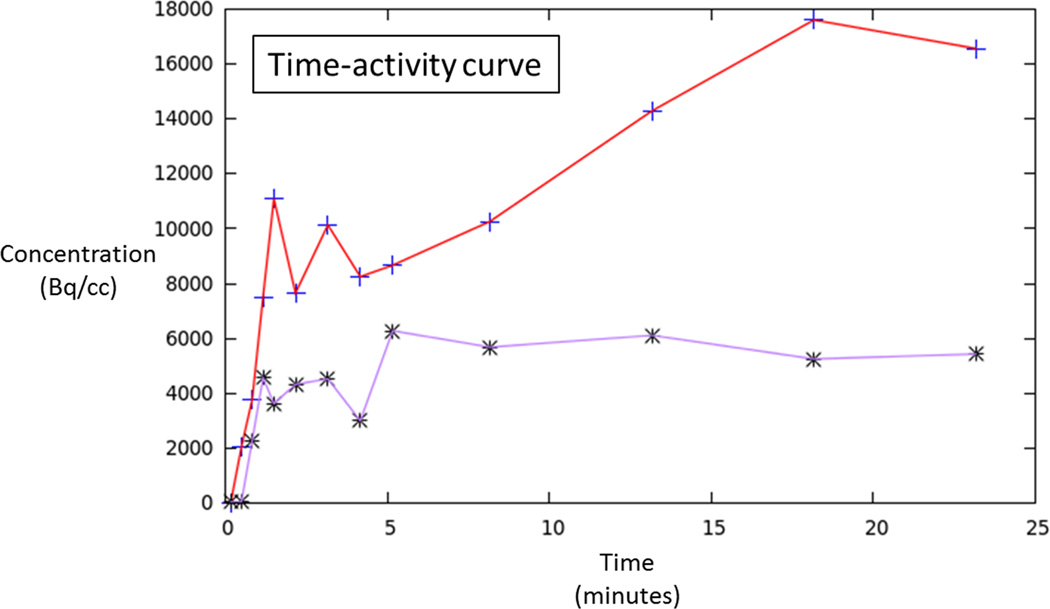
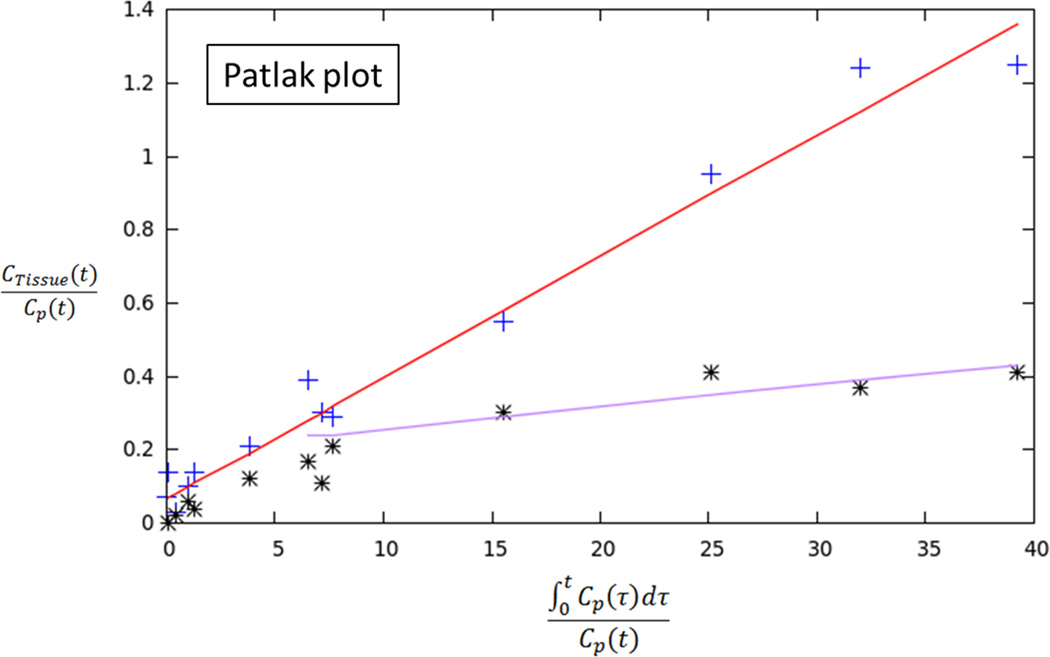
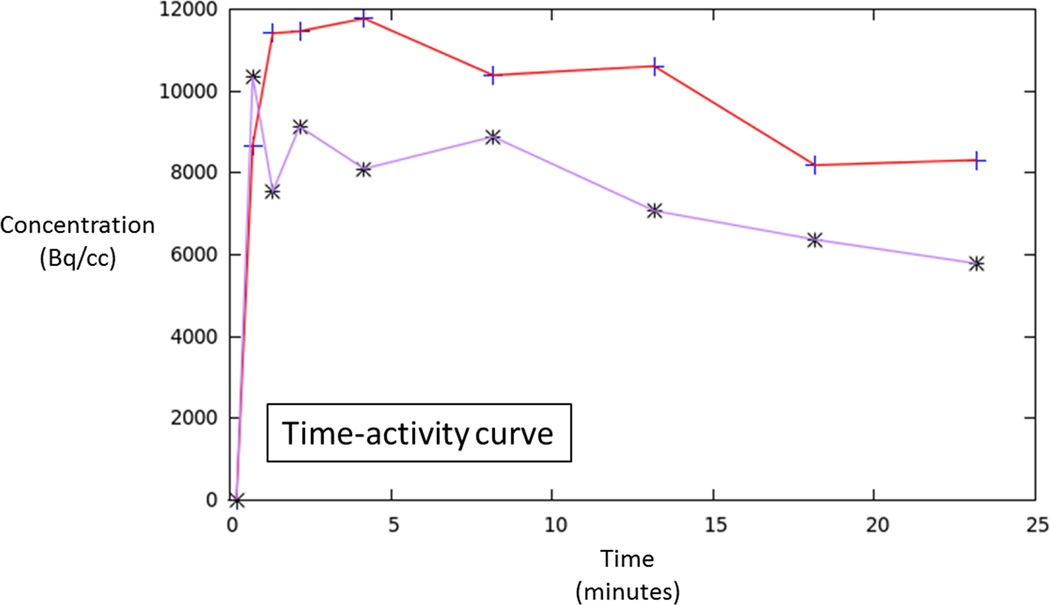
In two patients, the TACs indicated irreversible binding, and a Patlak analysis was performed. In both of these patients, tumor had a higher Ki than benign prostate tissue [0.023 vs. 0.006 and 0.019 vs. 0.008 mL/cm3/min, respectively]. In both of these patients, the ratio of tumor to benign tissue was higher using dynamic metrics than using static AUC (ratios of 3.83 vs. 2.51 and 2.38 vs 1.27, respectively). In the third patient, binding appeared reversible and RGA was performed. In this patient, tumor showed higher VT than benign prostate (0.68 vs. 0.52 mL/cm3, respectively), although the ratio of tumor to benign tissue was similar using dynamic metrics and static AUC (1.31 vs. 1.34, respectively).
Discussion
In this pilot study, we performed dynamic 18F-FDG PET imaging as part of a simultaneous PET/MRI examination in men with localized prostate cancer. In all patients, the computed PET kinetic parameter was different between tumor and benign prostate tissue. This is important given that FDG PET has generally exhibited limited performance in primary prostate cancer evaluation in past studies using static PET imaging[9, 10]. Indeed, in two of the three patients, the dynamic metrics showed a greater difference between tumor and benign tissue in comparison with a static measure of radiotracer activity across the duration of the PET acquisition. Thus, while requiring studies in larger cohorts, our investigation shows potential for dynamic PET evaluation to expand the role for PET imaging in prostate cancer evaluation.
Traditionally, PET tracer uptake in tissue is described by compartmental analysis in which the particular rate constants of the model can be determined by a nonlinear optimization. Alternatively, kinetic measures can be determined using graphical analysis techniques that determine a single parameter, the slope of a line, representing a combination of model parameters. Such graphical analysis is computationally simpler and less time-consuming than a pharmacokinetic mode and was employed in our study for analyzing the dynamic PET data [19]. Using this approach, the uptake rate of tracers that are irreversibly trapped during the time course of the PET experiment can be calculated from a Patlak plot. At the time point when the free tracer in tissue is in a steady state, the plot becomes linear and the slope (Ki) represents the rate of transfer into the trapping compartment; for FDG, the trapping compartment is the phosphorylation of FDG to FDG-6-phosphate. However, due to low trapping of FDG in the prostate in some cases, FDG may alternatively be treated as reversible in such instances. Tracers that exhibit reversible kinetics (observable washout during the course of the acquisition) can be analyzed with RGA to give the distribution volume (VT). Both of these analyses were employed in our initial studies of dynamic FDG PET in prostate cancer patients to distinguish tumor from benign tissue. When using Patlak analysis, a distinct increase in Ki (trapping) was observed relative to the benign tissue. When using RGA, an increase in the distribution volume was observed, suggesting an increase in uptake of FDG with little trapping. In view of our findings, it is anticipated that a combination of both Patlak and RGA analyses will be needed for interpretation of dynamic FDG PET prostate examinations in clinical practice.
The acquisition of dynamic PET data as part of a simultaneous PET/MRI examination is an important aspect of our study. Prostate tumors are often small in size and are expected to indicate low uptake during the initial period following radiotracer injection. Therefore, reliable visualization of the lesions on dynamic PET images is challenging. We used multi-parametric MRI sequences to initially localize abnormalities and define a target for the dynamic PET evaluation. While PET and MRI may readily be performed separately using distinct PET and MRI scanners, the subsequent loss of spatial and temporal simultaneity would introduce imprecisions into the coregistration and undermine efforts to correlate findings between the two modalities[27].
Our findings have the potential to be applied clinically in the management of localized prostate cancer. The differences in kinetic behavior between tumor and benign prostate tissue suggest use of dynamic PET metrics as additional biomarkers in prostate cancer evaluation, to complement data currently provided by multi-parametric MRI or standard static PET. Also important to our study was design of a simultaneous PET/MRI protocol incorporating both DCE-MRI and dynamic PET that is performed within one hour. Thus, through use of the simultaneous MRI data to identify suspicious regions as well as the graphical analysis for data quantification, it is possible to envision the clinical integration of simultaneous PET/MRI. Also, we took advantage of inclusion of the femoral arteries in the FOV to avoid the need for blood sampling, further enhancing the clinical practicality of our approach. Moreover, the simultaneous MRI data facilitates performance of any subsequent image-guided interventions, such as biopsy or treatment, directed to dynamic PET abnormalities.
A number of limitations of our study warrant mention. First, the sample size was small, consistent with our intent of performing a pilot study to establish feasibility of the technique. In addition, while we did demonstrate the ability to successfully perform the dynamic acquisition and obtain the kinetic parameters targeting MRI abnormalities, the clinical and prognostic significance of these kinetic parameters is unknown. The reversed order of MRI contrast agent and PET tracer injection in our study was selected for practical reasons given the desire to minimize the delay between the start of the two injections and the limitations inherent to the manual injection of the PET tracer. While this approach for the injection of the two tracers represents a substantial deviation from the routine clinical protocol for performing PET/MRI, its impact remains unknown given the limited scope of the study. Furthermore, while the dynamic PET metrics showed apparent differences between tumor and benign prostate tissue, it is also unknown whether these metrics are associated with tumor grade. Finally, our study was performed using FDG. While this is the most widely used and investigated agent for oncologic PET imaging, other radiotracers have shown potential in prostate cancer evaluation [7, 11, 30].
In conclusion, we have demonstrated the feasibility of performing simultaneous dynamic FDG PET/MRI of prostate cancer. Following localization of small tumors based on MRI data, Patlak analysis and RGA of dynamic PET data were performed using a PET-based IDIF to generate kinetic PET parameters that showed differences between tumor and benign tissues; static PET metrics showed smaller differences in two of three patients. Future studies in larger cohorts are warranted to validate and better define the potential clinical utility of this novel multi-modality approach to the imaging assessment of primary prostate cancer.
Figure 1.
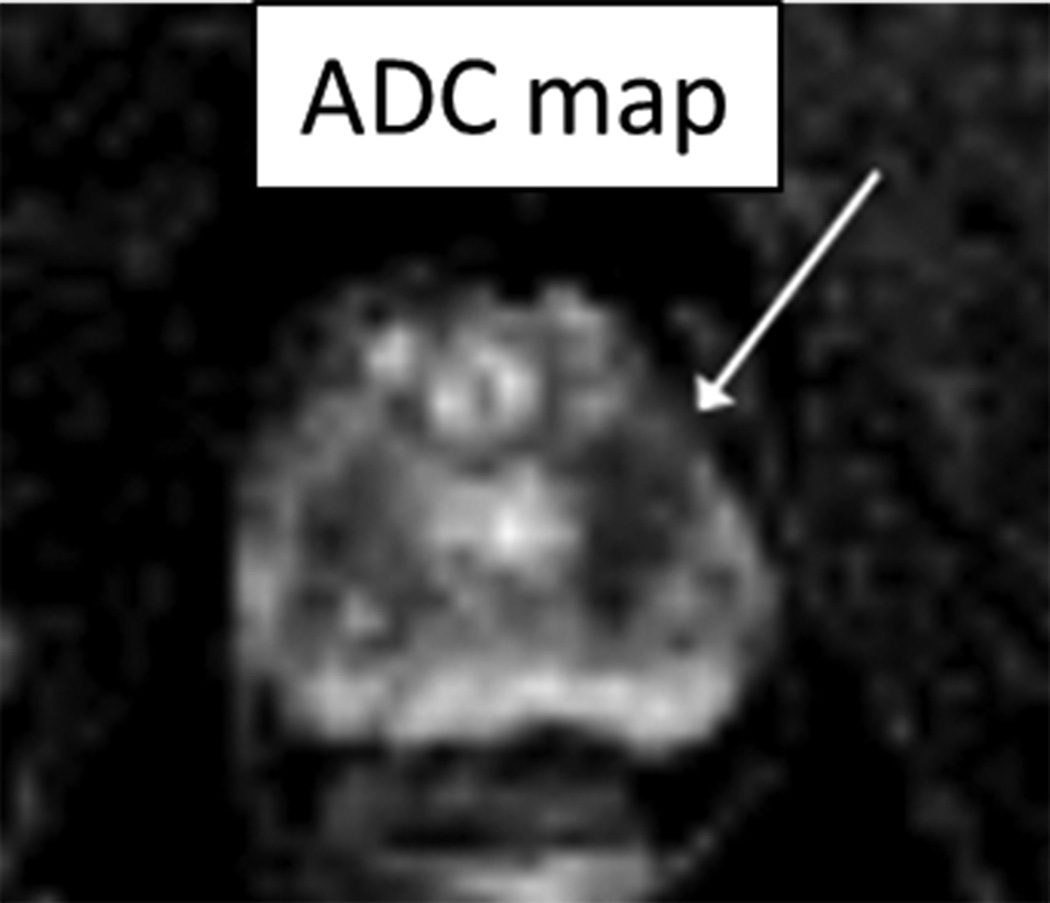
70 year-old man with Gleason 3+3 tumor on biopsy. (A) Axial apparent diffusion coefficient map (ADC) shows visually deceased apparent diffusion coefficient (ADC) in left transition zone (arrow). (B) Fused image from simultaneous 18F-FDG PET/MRI shows corresponding increased PET activity (arrow). (C) Dynamic PET time-activity-curve (TAC) shows radioactivity vs. time in tumor (red) and benign prostate (purple). Lack of washout within tumor suggests irreversible binding. (D) Dynamic PET TAC shows radioactivity in femoral artery, providing image-derived input function. (E) Patlak plots for tumor (red) and benign (purple) prostate tissue obtained from conversion of tissue TACs to linear functions using IDIF TAC. Note higher slope in tumor than in benign tissue, indicating higher Ki in tumor.
Figure 2.
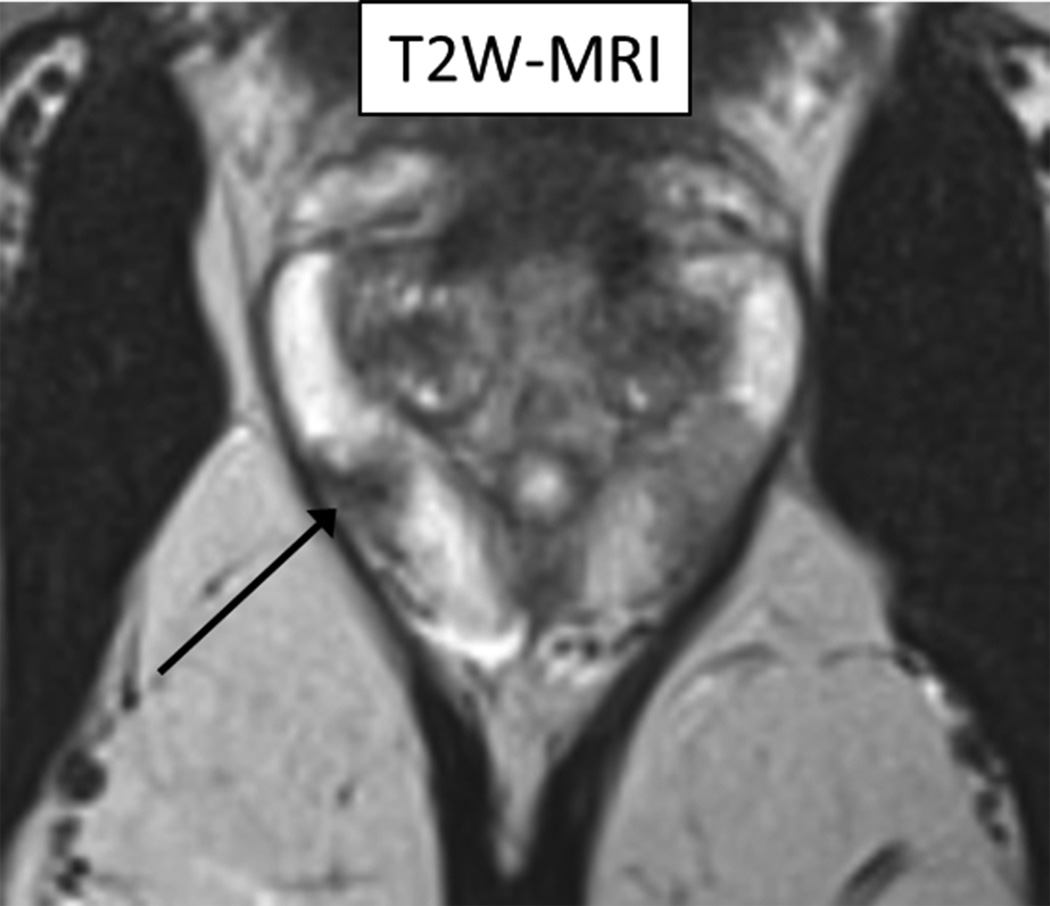
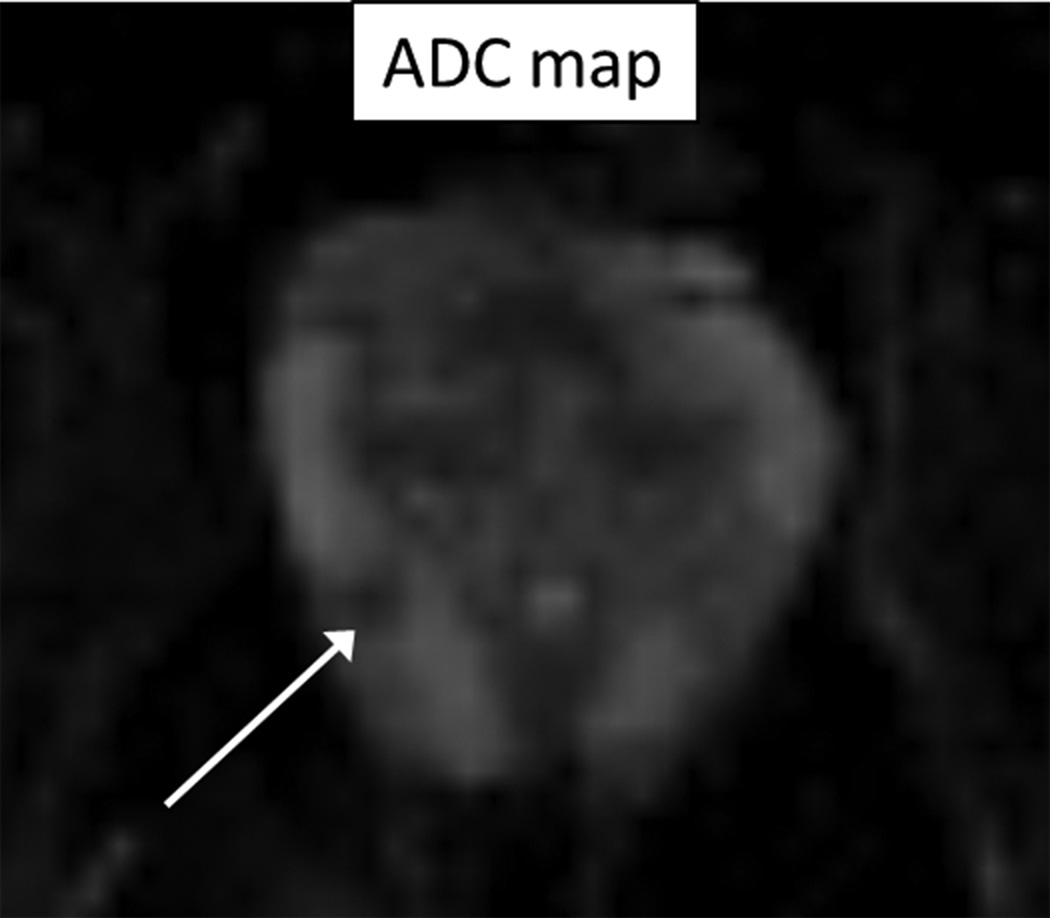
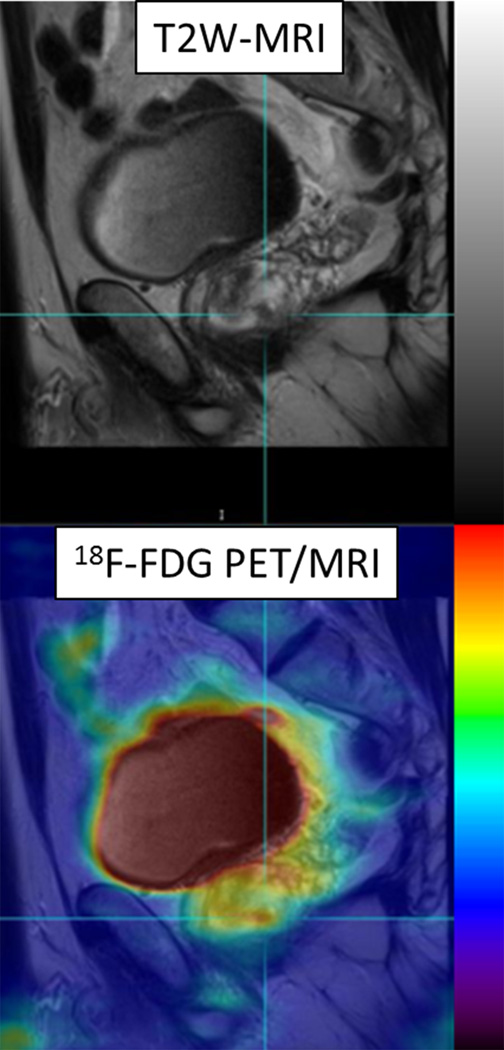
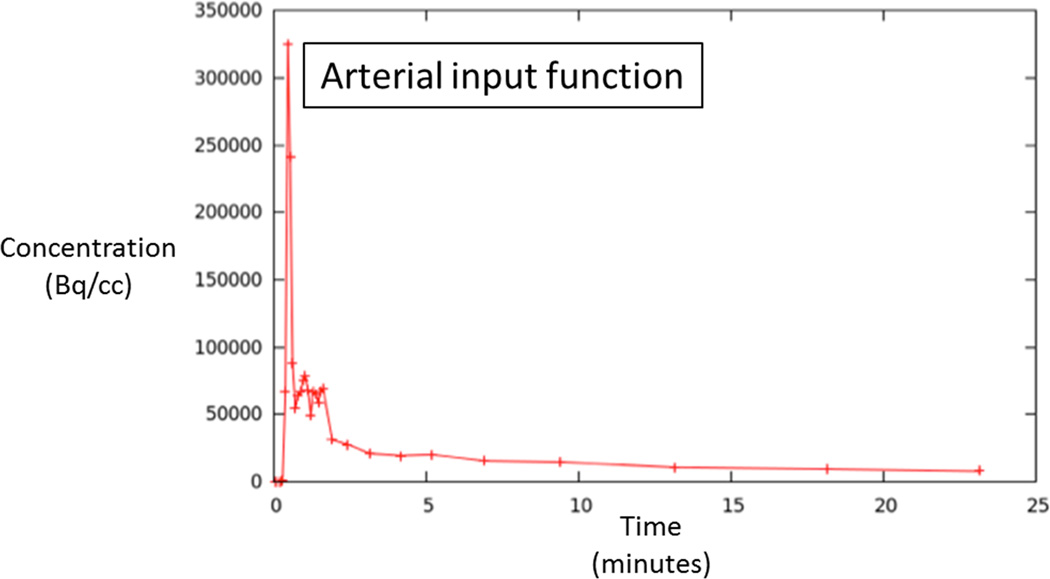
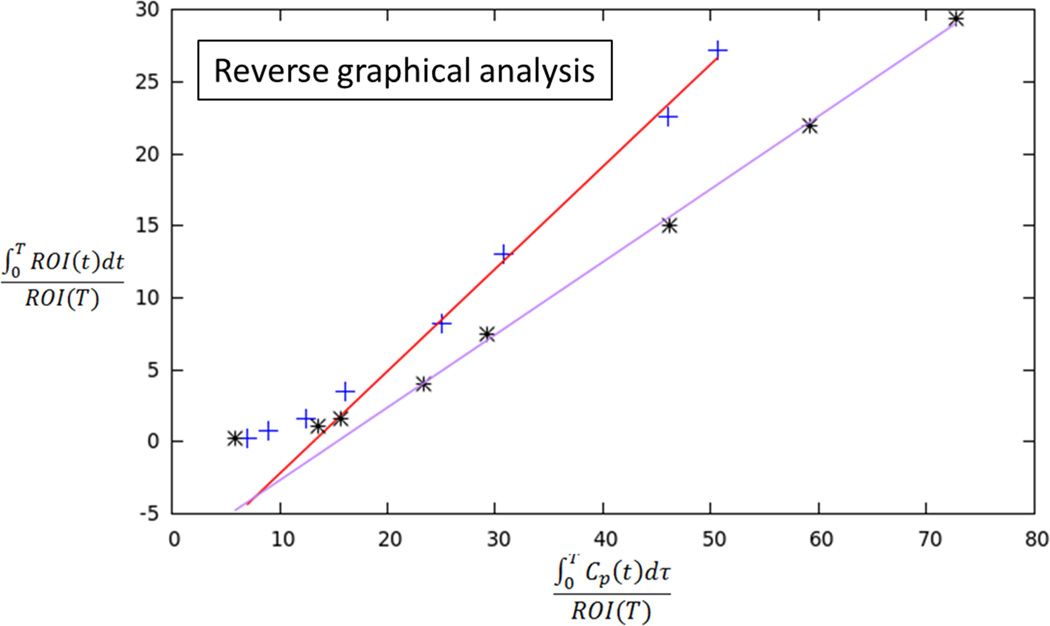
60 year-old man with Gleason 3+3 tumor on biopsy. (A) Axial T2-weighted image (T2WI) shows deceased T2 signal in right peripheral zone (arrow). (B) Axial apparent diffusion coefficient (ADC) map shows corresponding decreased ADC (arrow). (C) Paired sagittal images show correspondence of lesion on T2WI with area of increased PET activity on fused image from simultaneous 18F-FDG PET/MRI. (D) Dynamic PET time-activity-curve (TAC) shows radioactivity vs. time in tumor (red) and benign prostate (purple). Washout suggests reversible binding. (E) Dynamic PET TAC shows radioactivity in femoral artery, providing image-derived input function. (F) Reverse graphical analysis for tumor (red) and benign (purple) prostate tissue obtained from conversion of tissue TACs to linear functions using IDIF TAC. Note higher slope in tumor than in benign tissue, indicating higher VT in tumor.
Table 1.
Static and Dynamic PET Metrics in Three Patients
| Dynamic analysis | Static analysis | ||||||||
|---|---|---|---|---|---|---|---|---|---|
| Patient | Analysis | Metric | Tumor | Benign | Ratio | Metric | Tumor | Benign | Ratio |
| 1 | Patlak | Ki* | 0.023 | 0.006 | 3.83 | AUC | 20.19 | 8.05 | 2.51 |
| 2 | Reverse graphical |
VT** | 0.68 | 0.52 | 1.31 | AUC | 14.82 | 11.1 | 1.34 |
| 3 | Patlak | Ki* | 0.19 | 0.008 | 2.38 | AUC | 11.8 | 9.3 | 1.27 |
Units of mL/cm3/min
Units of mL/cm3
Acknowledgments
Support: 5R01 CA111996-07; The Joseph and Diane Steinberg Charitable Trust
Footnotes
Institution where work was performed: NYU Langone Medical Center
References
- 1.Klotz L, Emberton M. Management of low risk prostate cancer: active surveillance and focal therapy. Curr Opin Urol. 2014;24:270–279. doi: 10.1097/MOU.0000000000000055. [DOI] [PubMed] [Google Scholar]
- 2. BLINDED. [Google Scholar]
- 3.Dianat SS, Carter HB, Macura KJ. Performance of multiparametric magnetic resonance imaging in the evaluation and management of clinically low-risk prostate cancer. Urol Oncol. 2014;32:39. doi: 10.1016/j.urolonc.2013.04.002. e31-10. [DOI] [PMC free article] [PubMed] [Google Scholar]
- 4.Hoeks CM, Barentsz JO, Hambrock T, et al. Prostate cancer: multiparametric MR imaging for detection, localization, and staging. Radiology. 2011;261:46–66. doi: 10.1148/radiol.11091822. [DOI] [PubMed] [Google Scholar]
- 5. BLINDED. [Google Scholar]
- 6.Bratan F, Niaf E, Melodelima C, Chesnais AL, et al. Influence of imaging and histological factors on prostate cancer detection and localisation on multiparametric MRI: a prospective study. Eur Radiol. 2013;23:2019–2029. doi: 10.1007/s00330-013-2795-0. [DOI] [PubMed] [Google Scholar]
- 7.Jadvar H. Molecular imaging of prostate cancer: PET radiotracers. AJR Am J Roentgenol. 2012;199:278–291. doi: 10.2214/AJR.12.8816. [DOI] [PMC free article] [PubMed] [Google Scholar]
- 8.Jadvar H. Imaging evaluation of prostate cancer with 18F-fluorodeoxyglucose PET/CT: utility and limitations. Eur J Nucl Med Mol Imaging. 2013;40(Suppl 1):S5–S10. doi: 10.1007/s00259-013-2361-7. [DOI] [PMC free article] [PubMed] [Google Scholar]
- 9.Salminen E, Hogg A, Binns D, et al. Investigations with FDG-PET scanning in prostate cancer show limited value for clinical practice. Acta Oncol. 2002;41:425–429. doi: 10.1080/028418602320405005. [DOI] [PubMed] [Google Scholar]
- 10.Takahashi N, Inoue T, Lee J, et al. The roles of PET and PET/CT in the diagnosis and management of prostate cancer. Oncology. 2007;72:226–233. doi: 10.1159/000112946. [DOI] [PubMed] [Google Scholar]
- 11.Watanabe H, Kanematsu M, Kondo H, et al. Preoperative detection of prostate cancer: a comparison with 11C-choline PET, 18F-fluorodeoxyglucose PET and MR imaging. J Magn Reson Imaging. 2010;31:1151–1156. doi: 10.1002/jmri.22157. [DOI] [PubMed] [Google Scholar]
- 12.Fox JJ, Schoder H, Larson SM. Molecular imaging of prostate cancer. Curr Opin Urol. 2012;22:320–327. doi: 10.1097/MOU.0b013e32835483d5. [DOI] [PMC free article] [PubMed] [Google Scholar]
- 13.Kelloff GJ, Choyke P, Coffey DS Prostate Cancer Imaging Working G. Challenges in clinical prostate cancer: role of imaging. AJR Am J Roentgenol. 2009;192:1455–1470. doi: 10.2214/AJR.09.2579. [DOI] [PMC free article] [PubMed] [Google Scholar]
- 14.Dimitrakopoulou-Strauss A, Pan L, Strauss LG. Quantitative approaches of dynamic FDG-PET and PET/CT studies (dPET/CT) for the evaluation of oncological patients. Cancer imaging : the official publication of the International Cancer Imaging Society. 2012;12:283–289. doi: 10.1102/1470-7330.2012.0033. [DOI] [PMC free article] [PubMed] [Google Scholar]
- 15.Kristian A, Revheim ME, Qu H, et al. Dynamic (18)F-FDG-PET for monitoring treatment effect following anti-angiogenic therapy in triple-negative breast cancer xenografts. Acta Oncol. 2013;52:1566–1572. doi: 10.3109/0284186X.2013.813634. [DOI] [PubMed] [Google Scholar]
- 16.Schierz JH, Opfermann T, Steenbeck J, et al. Early dynamic 18F-FDG PET to detect hyperperfusion in hepatocellular carcinoma liver lesions. J Nucl Med. 2013;54:848–854. doi: 10.2967/jnumed.112.113936. [DOI] [PubMed] [Google Scholar]
- 17.Strauss LG, Koczan D, Klippel S, et al. Dynamic PET with (18)F-Deoxyglucose (FDG) and quantitative assessment with a two-tissue compartment model reflect the activity of glucose transporters and hexokinases in patients with colorectal tumors. Am J Nucl Med Mol Imaging. 2013;3:417–424. [PMC free article] [PubMed] [Google Scholar]
- 18.Patlak CS, Blasberg RG, Fenstermacher JD. Graphical evaluation of blood-to-brain transfer constants from multiple-time uptake data. J Cereb Blood Flow Metab. 1983;3:1–7. doi: 10.1038/jcbfm.1983.1. [DOI] [PubMed] [Google Scholar]
- 19. BLINDED. [Google Scholar]
- 20. BLINDED. [Google Scholar]
- 21.Patlak CS, Blasberg RG. Graphical evaluation of blood-to-brain transfer constants from multiple-time uptake data. Generalizations. J Cereb Blood Flow Metab. 1985;5:584–590. doi: 10.1038/jcbfm.1985.87. [DOI] [PubMed] [Google Scholar]
- 22. BLINDED. [Google Scholar]
- 23.Korporaal JG, van Vulpen M, van den Berg CA, et al. Tracer kinetic model selection for dynamic contrast-enhanced computed tomography imaging of prostate cancer. Invest Radiol. 2012;47:41–48. doi: 10.1097/RLI.0b013e31821c0ea7. [DOI] [PubMed] [Google Scholar]
- 24.Durmus T, Vollnberg B, Schwenke C, et al. Dynamic contrast enhanced MRI of the prostate: comparison of gadobutrol and Gd-DTPA. Rofo. 2013;185:862–868. doi: 10.1055/s-0033-1335892. [DOI] [PubMed] [Google Scholar]
- 25.Partovi S, Kohan A, Rubbert C, et al. Clinical oncologic applications of PET/MRI: a new horizon. Am J Nucl Med Mol Imaging. 2014;4:202–212. [PMC free article] [PubMed] [Google Scholar]
- 26.Maseeh uz Z, Fatima N, Sajjad Z, et al. Whole body simultaneous PET/MRI: one-stop-shop? J Pak Med Assoc. 2014;64:201–204. [PubMed] [Google Scholar]
- 27.Brendle CB, Schmidt H, Fleischer S, et al. Simultaneously Acquired MR/PET Images Compared with Sequential MR/PET and PET/CT: Alignment Quality. Radiology. 2013;268:190–199. doi: 10.1148/radiol.13121838. [DOI] [PubMed] [Google Scholar]
- 28.Eiber M, Martinez-Moller A, Souvatzoglou M, et al. Value of a Dixon-based MR/PET attenuation correction sequence for the localization and evaluation of PET-positive lesions. Eur J Nucl Med Mol Imaging. 2011;38:1691–1701. doi: 10.1007/s00259-011-1842-9. [DOI] [PubMed] [Google Scholar]
- 29. BLINDED. [Google Scholar]
- 30.Beauregard JM, Williams SG, Degrado TR, et al. Pilot comparison of F-fluorocholine and F-fluorodeoxyglucose PET/CT with conventional imaging in prostate cancer. J Med Imaging Radiat Oncol. 2010;54:325–332. doi: 10.1111/j.1754-9485.2010.02178.x. [DOI] [PubMed] [Google Scholar]


