Abstract
Magnetic nanoparticles (MNPs), referred to as the Dartmouth MNPs, which exhibit high specific absorption rate at low applied field strength have been developed for hyperthermia therapy applications. The MNPs consist of small (2–5 nm) single crystals of gamma-Fe2O3 with saccharide chains implanted in their crystalline structure, forming 20–40 nm flower-like aggregates with a hydrodynamic diameter of 110–120 nm. The MNPs form stable (>12 months) colloidal solutions in water and exhibit no hysteresis under an applied quasistatic magnetic field, and produce a significant amount of heat at field strengths as low as 100 Oe at 99–164 kHz. The MNP heating mechanisms under an alternating magnetic field (AMF) are discussed and analyzed quantitatively based on (a) the calculated multi-scale MNP interactions obtained using a three dimensional numerical model called the method of auxiliary sources, (b) measured MNP frequency spectra, and (c) quantified MNP friction losses based on magneto-viscous theory. The frequency responses and hysteresis curves of the Dartmouth MNPs are measured and compared to the modeled data. The specific absorption rate of the particles is measured at various AMF strengths and frequencies, and compared to commercially available MNPs. The comparisons demonstrate the superior heating properties of the Dartmouth MNPs at low field strengths (<250 Oe). This may extend MNP hyperthermia therapy to deeper tumors that were previously non-viable targets, potentially enabling the treatment of some of the most difficult cancers, such as pancreatic and rectal cancers, without damaging normal tissue.
I. INTRODUCTION
Cancer is a group of diseases characterized by uncontrolled growth and the spread of abnormal cells. According to the American Cancer Society annual report, in 2014, nearly 600 000 Americans are expected to die of cancer, more than 1600 people per day.1 Hyperthermia therapy is a type of cancer treatment in which body tissue is exposed to elevated temperatures (approximately 45 °C) to damage and kill cancer cells.2 In a clinical setting, hyperthermia is predominantly used in conjunction with other forms of cancer therapy, such as radiation therapy and chemotherapy.3–6 Magnetic nanoparticle (MNP) hyperthermia as a cancer therapy operates on the principle that magnetic nanoparticles introduced into a tumor produce heat when subjected to an alternating magnetic field (AMF). There are a number of MNPs with different shapes and magnetic properties for Hyperthermia applications. Their performance depends upon the nanoparticles' properties, such as mean size, magnetic anisotropy (shape), and saturation magnetization, as well as the AMF amplitude and frequency.7 It has been demonstrated, that anisotropic MNPs, such as those with cubically shaped cores, provide superior power loss compared to spherical iron oxide particles of similar size.8
A key characteristic of MNPs used for clinical hyperthermia is a high specific absorption rate (SAR), which depends on the MNPs' size, shape, composition, magnetic interaction, and concentration, as well as the applied magnetic field frequency and strength.9–27 There are a number of types of MNPs available for hyperthermia therapy.12–14,17,28,29 However, most existing MNPs require a high frequency or high AMF strength to deliver an adequate thermal dose to the tumor.
The AMF, which is produced by a coil, penetrates inside tissue and activates MNPs in cancerous tissues, but also generates unwanted eddy currents in the normal tissues.30,31 These induced eddy currents can result in significant heating of normal tissue and impose limitations on the product of magnetic field strength and frequency (H·f) for hyperthermia treatment.32–34 The H·f limitations that clinical test subjects were able to withstand for more than 1 h without major complications have been reported in four independent studies;32,35–37 the limit varies from to or and is summarized in Ref. 38. According to Faraday's law, the power deposition due to the eddy currents in the tissue is proportional to the square of H·f·r, where r is the circular radius of the circular surface exposed to magnetic field. In cases where a coil is close to the surface, r approximately coincides with coil diameter. Thus, one of the ways to exceed the H·f critical product is to design a new coil,38 for the treatment of superficial cancers. However, to achieve a therapeutic effect in deep tumors, such as pancreatic and rectal cancers, it is desirable to develop a MNP which will generate therapeutic temperature within tumors with as low an AMF as possible. To achieve this requirement, we developed a next generation MNP for hyperthermia that consists of non-toxic materials and generates a therapeutic level of heat per particle unit mass at low magnitude AMF (<250 Oe). The particles presented in this paper, henceforth referred to as Dartmouth MNPs, exhibit greatly improved SAR at low AMF as compared to commercially available MNPs.29 These MNPs suggest promising new possibilities for the application of MNP hyperthermia to deep tumors.
To fully leverage the unique properties of these new particles for clinical applications, we must gain deeper insight into the inherent heat generation (power loss) mechanisms and assess how the particle properties and the electromagnetic field parameters may be optimized for cancer therapy.
The conversion of magnetic field energy into heat by nanoparticles can arise through different processes: hysteresis, Néel relaxation, and MNP motion/physical relaxation in a liquid carrier. The MNPs' motion in the suspension can be further broken down into Brownian and applied external magnetic field driven motion/rotation. Brownian motion and rotation of MNPs describes the free random movement/rotations of MNPs in the suspensions39 and is characterized by a relaxation time, i.e., the characteristic time for MNPs to return to a disordered state following excitation by an external magnetic field. The SAR, resulting from MNP free Brownian motion/relaxation, depends on the applied AMF frequency nonlinearly and provides maximum power loss at resonance frequency fb = 1/(2πτ), where τ is the effective relaxation time.40 The applied magnetic field driven motion and rotation, which do not have a characteristic relaxation time, are defined, not as free motion, but rather motion due to induced magnetic forces on the MNPs.41 Specifically, at low frequencies (f < fb), the alternating magnetic field impedes free MNP rotation and particles' dipole moments are aligned along the applied AMF. Conversely, at high frequencies (fb > f), the applied AMF forces particles to rotate fast and as a result a part of the applied alternating field energy is transformed into frictional heat via friction between particles and the surrounding medium.
Overall, the mechanisms which are important for any given set of MNPs depend on the nanoparticles' size, shape, interaction, composition, and concentration.8,9,18–24
Hysteresis loss is electromagnetic field energy that dissipates per cycle of magnetization reversal, and it is proportional to the area of the hysteresis loop.42 This loss depends strongly on the applied field amplitude, particle core size and shape, and domains, as well as the magnetic history. For large multi-domain particles hysteresis loss physics are described in Ref. 43, and a phenomenological model that describes hysteresis losses as a function of the MNP effective size distribution and the applied magnetic field amplitude in the size range from superparamagnetism to magnetic multi-domains— roughly 10–100 nm has been proposed in Ref. 9.
With decreasing particle core size a particle's magnetization behavior transitions from multi-domain to single domain. For iron-oxide particles with sizes larger than ∼30–40 nm, a transition from single to multi-domain structure takes place.44 It has been shown that single domain MNPs in suspension can relax by one of two methods: Brownian relaxation, with a relaxation time τb and Néel relaxation with relaxation time τn. In the case of Néel relaxation,45 the energy barrier for magnetization reversal decreases with decreasing MNP size, enabling thermal fluctuations to lead to relaxation phenomena; the characteristic relaxation time of a nanoparticle system is determined by the ratio of the anisotropy energy to the thermal energy. The second kind of magnetic relaxation in a MNP system is Brownian relaxation, first derived by Debye,46 where thermal fluctuations lead to random transport/rotation of the particles through/within the carrier fluid. In the case of pure Brownian relaxation, a rigid spatial coupling exists between the magnetic moment and the crystallographic structure of the particle. Relaxation takes the form of the physical rotation of the particle within the carrier fluid. In a sample of MNPs in suspension, free movement/rotation of the particles can be inhibited by the application of a magnetic field. The rigidly bound moments of the Brownian particles leads to the magneto-dissipative effect and to rotational viscosity phenomena.47,48 Transition from one type of relaxation regime to the other corresponds to the intersection of the Brownian and Néel relaxation times, i.e., when τb = τn, and depends on the size of the particle core, the hydrodynamic size, the viscosity of the media, and its magnetic anisotropy. A general treatment of the relaxation in ferrofluids based on a Fokker–Planck equation was given by Brown;49 Rosensweig40 used the effective relaxation time (1/τeff = 1/τb + 1/τn) to calculate the power dissipation in a magnetic fluid under an AMF. The frequency dependence of relaxation of the MNP system can be determined experimentally by measuring the spectra of the complex susceptibility50–59 or frequency dependent magnetic field responses from the MNPs.
One more mechanism of power dissipation in MNPs is magnetic friction in solutions, or between particles themselves, namely, for aggregated and magnetically interacting particles. The losses are due to rotation and translation of MNPs under an AMF, and not just by Brownian relaxation, which is driven by the thermal agitation; therefore, this loss type is relevant for both single and multi-domain MNPs, and this phenomenon is known in the literature as “negative viscosity of ferrofluid.”60–65 Each MNP can be characterized with a magnetic polarizability tensor, whose principal components are magnetic dipole moment elements in the MNP coordinate system. The values of the principal components are proportional to MNP volume and depend on their shape/anisotropy. For example, for a spherical MNP all principal elements of magnetic polarizability are equal, whereas for a MNP which is irregularly shaped in three dimensions, all principal values are different. Studies in Ref. 66 have demonstrated the effects of a target's shape, material properties, and anisotropy on the secondary magnetic field, which is proportional to the principal magnetic polarizabilities. Overall the magnetic moments, in the absence of a magnetic field, are distributed randomly in space and orientation due to thermal agitations, and thus the MNP exhibits no net magnetization. When MNPs are placed in an external magnetic field, dipole moments are induced in the MNPs. The dipole moments, which are determined as the product of magnetic polarizability tensors and applied field, are subject to a torque moment under the local AMF. The torque moment forces the MNP to rotate in the solution or in MNP aggregates, which then produces power loss in the system. The MNPs' power losses in a suspension due to viscosity have been demonstrated and analyzed.41,65
In this work, we present measured SAR values for the Dartmouth MNP at different AMF strengths and frequencies. A comparison between the SARs for the Dartmouth MNPs and commercial MNPs is presented. The heat generation observed in the Dartmouth MNPs is analyzed based on the above described four mechanisms.
II. MATERIALS AND METHODS
A. Dartmouth MNP synthesis
Commercially available ferric chloride (FeCl3·6H2O), ferrous sulfate (FeSO4·7H2O), 25 wt. % ammonium hydroxide solution, NaNO3 and NaOH were purchased from VWR. Carboxymethyl-dextran (CM-dextran) 40 kDa was purchased from TdB Consultancy AB. All reactants were used as received without further purification.
Magnetic nanoparticles with CM-dextran embedded in their structure were obtained according to Refs. 12 and 14. Briefly, 10% solutions of salts of Fe(II) and Fe(III) were precipitated by ammonia solution in the presence of excess of polysaccharide. The mixture was placed on a sand bath and heated up to 70 °C. Then NaOH and NaNO3 were added to oxidize Fe(II) and maintain alkali media (pH > 10). The temperature was raised up to 100 °C at a speed of 10 °C/h. The resulting solution was spun at 5000 rpm for 15 min to remove large aggregates. The remaining MNPs were purified using a magnetic column separator.
For comparison of the heating properties BNF-starch and NT-1, magnetic nanoparticles were obtained from Micromod Partikeltechnologie GmbH.13
B. Nanoparticle characterization
Transmission electron micrographs of the nanoparticles were taken using an FEI Technai F20ST field emission gun transmission electron microscope (TEM) operated at 200 kV. Samples were prepared via the drop drying method. 500 magnetic nanoparticles from three different locations on a grid were used to produce particle size histograms. Consistent results were found for various concentrations indicating the drop drying method did not have a significant impact on measured size distribution.
The quasistatic magnetic properties of the nanoparticles were determined (saturation magnetization, Ms; remanent magnetization, Mr; and coercivity, Hc) from hysteresis loop measurements using a Princeton Measurements Corporation vibrating sample magnetometer (VSM) v-3. Both tested samples consisted of Dartmouth MNPs. The sample of MNPs in colloidal suspension contained 161 mg solids, with an Fe concentration of 84.5 mg Fe/ml (approximately 75% iron oxide, 25% CM-dextran) in 1 ml water. The mass of the dry sample was 24.1 mg. The data were collected at room temperature and normalized by the mass of solids.
The Dartmouth MNP structural characterization was performed using a Rigaku DMax rotating anode X-ray diffraction (XRD) system with a Cu target (Rigaku Corporation, Tokyo, Japan). Conditions for XRD were the following tube: Cu Kα = 0.1541 nm, filter: Ni, accelerating voltage: 40 kV, current: 20 mA, and two-theta scan range: 5°–90°.
Heating measurements were performed using a 14-turn, air core, copper solenoid coil (internal diameter 32 mm, length 12 cm) which was powered by a 10 kW TIG 10/300 generator (Hüttinger Elektronik GmbH, Freiburg, Germany) and cooled by running an ethylene glycol solution kept at 20 °C by a closed circuit chiller. A 0.7 mm diameter fiber optic probe (FISO Inc, Quebec, Canada), accurate to 0.1 °C, was used for the temperature measurements. A fiber optic temperature probe was positioned in the sample, close to the center of the coil, to measure temperature in the sample. Experiments were performed over a range of at least 50–440 Oe (4–35 kA/m) at frequencies 98–160 kHz. The maximum field strength of the AMF system is inversely related to the selected operating frequency (highest field strength tested was approximately 800 Oe (64 kA/m) at 98 kHz). Two samples were tested, consisting of colloidal suspensions of Dartmouth MNPs and Micromod BNF MNPs in water, each with a concentration of 5 mg Fe/ml. Micromod NT1 MNPs were also tested, which are identical to BNF MNPs in terms of heating properties, but are made using different manufacturing practices. The coatings of the tested particles are CM-dextran, dextran, and hydroxyethyl starch for the Dartmouth, NT1, and BNF MNP's, respectively. The sample was placed at the center of the coil, where the field strength was most homogeneous. The temperature was recorded electronically at one second intervals throughout the experimental period and monitored using a real-time temperature monitoring system. The SAR was calculated based on the initial temperature rise recorded
| (1) |
where C is the specific heat capacity of the media (in our case, it was water, C = 4180 J/kg K), T is the temperature (K), and t is the time (s). SAR data from Wabler et al. are shown in Sec. III D for comparison. The Fe concentrations for their BNF and Johns Hopkins University (JHU) particle samples were 25.8 mg/ml and 13.7 mg/ml, respectively. Both the BNF and JHU particles consist of a single multicrystalline iron oxide core with a biocompanitble polymer coating.29 The crystals in the BNF core are parallelepiped shaped,52 forming fractal aggregates,53 and the JHU cores are irregularly shaped.54
To understand the Néel and Brownian relaxation power loss contributions in Dartmouth MNP power loss mechanism, we measured the MNP spectra using a wide-band Electromagnetic induction sensor, developed by Geophex, Ltd. (Raleigh, NC, USA). The sensor is an active system and consists of two transmitters (Tx) and a vector receiver (Rx). The Txs produces a primary field that induces a dipole moment within each MNP, which then generates the secondary field that is detected by the Rx coils. It operates from 30 Hz to 96 kHz and measures both the in-phase (which indicates induced dipole's alignment with respect to the applied field) and quadrature component (imaginary component, which indicates the lag between the applied and induced magnetic dipole moments). Frequency dependent measured susceptibilities have been used to estimate the particle size distribution in ferrofluid55 and infer typical effective relaxation times, τeff.56,58 We fitted the Cole-Cole model67 to the measured responses to estimate the characteristic effective time.
III. RESULTS AND DISCUSSION
A. Size, shape, and composition
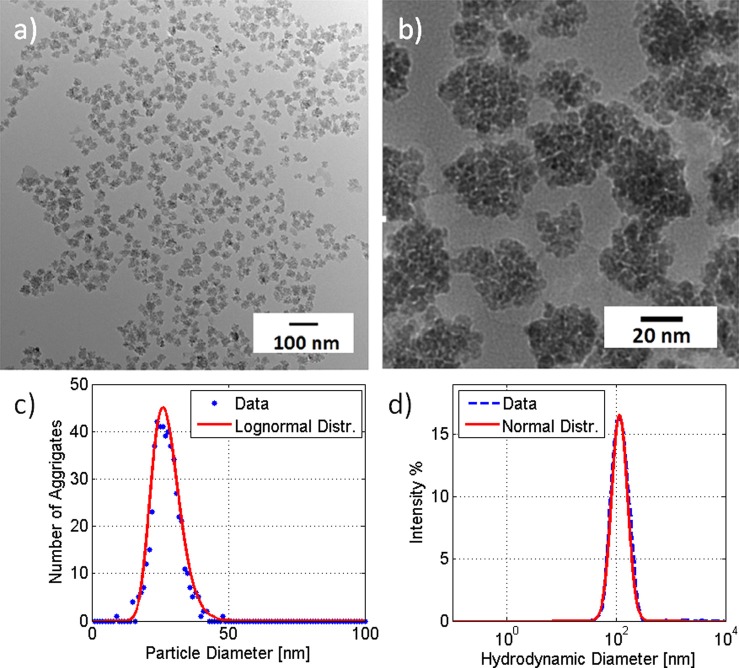
TEM examination showed that the nanoparticles consist of 2–5 nm crystals in 20–40 nm flower like aggregates, see Figures 1(a) and 1(b). Similar flower like iron-oxide MNPs were synthesized by Palchoudhury et al.16 Figures 1(c) and 1(d) show the relative quantity versus the diameter of the aggregates and the Z-size, respectively. The measured aggregate size distribution (Figure 1(c)) was fitted with a log-normal distribution, with mean 27 nm and standard deviation 5.2 nm. The measured hydrodynamic diameter (Z-size, Figure 1(d)) distribution was fitted with a normal distribution, , with mean, , and standard deviation, .
FIG. 1.
(a) and (b) TEM images of flower-like Dartmouth MNPs, (c) dots: aggregate size distribution estimated from TEM images; red line: the measured aggregate size distribution is fitted with a lognormal distribution function, with mean 27 nm, standard deviations 5.2 nm; (d) dashed line: Dartmouth MNPs' measured Z-size (hydrodynamic diameter) distribution; red line: the measured intensity is fitted to a normal distribution function, with mean μ = 110 nm, standard deviation σ = 0.33.
X-ray diffraction data for Dartmouth MNPs are shown in Figure 2. The Dartmouth MNPs show peaks at 30.84°, 36.28°, 44.0°, 57.82°, 63.54°, and 74.86°, which corresponds to peaks for gamma-Fe2O3. The size of the MNPs calculated from XRD data using the Scherrer equation is 28 nm, which matches well with the estimate from TEM data of 27 nm mean aggregate diameter.
FIG. 2.
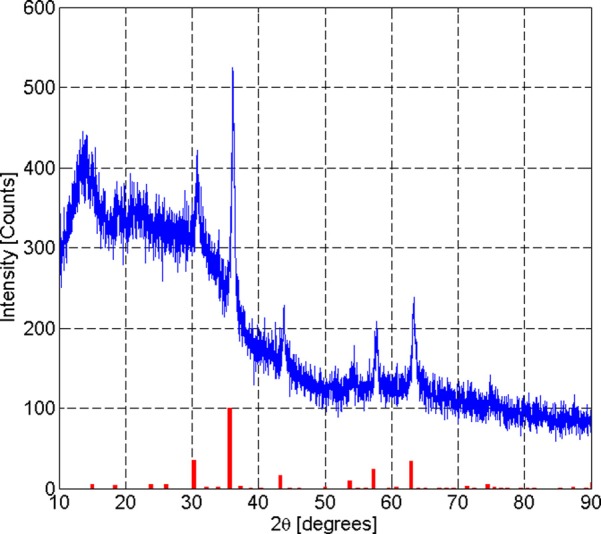
Dartmouth MNP X-ray diffraction intensity versus two-theta. The red bars are standard peaks for gamma Fe2O3.
B. Magnetic properties
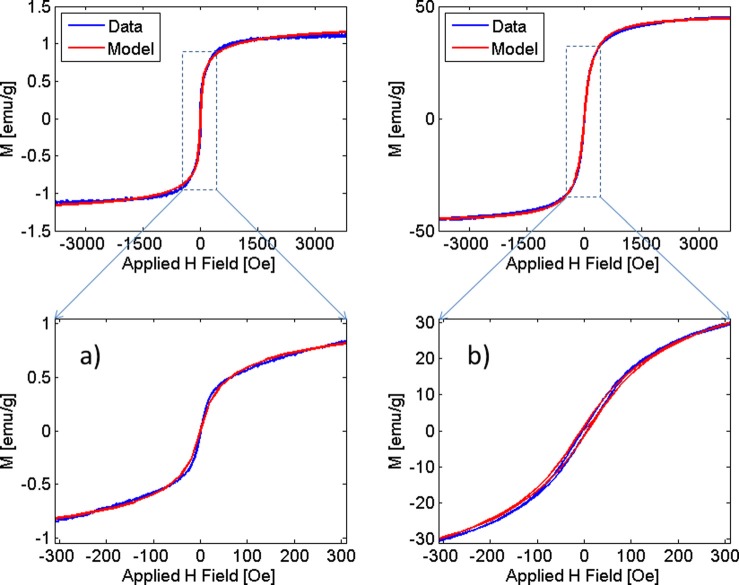
The quasistatic magnetization curves for Dartmouth MNPs in colloidal solution and for dry Dartmouth MNPs are shown on Figure 3 (blue lines). The measured saturation magnetization, remanence, and coercivity are 1.1 emu/g, 0.007 emu/g, and 30 μT, (0.3 G), respectively, for Dartmouth MNPs in solution, and 45 emu/g, 1.15 emu/g, and 568.6 μT (5.69 G), respectively, for the dry Dartmouth MNPs. The dry Dartmouth MNPs exhibit magnetic hysteresis; however, the Dartmouth MNPs in water do not. In addition, the saturation magnetization for the dry MNPs is 60% of the value of the bulk material. In comparison to the values reported by Lu et al.,68 on an individual basis, the dry Dartmouth MNPs have a saturation magnetization equivalent to single crystals of magnetite and/or maghemite which are 3 nm in diameter. This is also similar to that of nanoflowers saturation magnetization reported in Ref. 16.
FIG. 3.
Magnetization curves of MNPs: (a) suspended in water and (b) dried. Measurements were taken at room temperature. Values are normalized by the mass of solids.
To understand observed differences between magnetic properties for the dry and colloidally suspended MNPs, we analyzed the induced magnetic moment per unit volume in MNP. The magnetic moment can be expressed as
| (2) |
where Md is the domain magnetization of the MNP, is the volume fraction of magnetic material in MNP, and is the Langevin function, which asymptotically approaches unity for high magnetic fields , and B = Bap(1 + p) is the total magnetic flux around the MNP, p is an interaction coefficient between MNP aggregates and is estimated empirically by matching modeled hysteresis using Eq. (2) to measured data. From the measured MNP size distribution and susceptibility, we extracted the size and Md, the domain magnetization of MNP and computed the susceptibility. The comparisons between measured data and data modeled using susceptibilities computed via Eq. (2) are illustrated in Figure 3. The results show a good correlation between the experimental and modeled data. For MNPs in water calculations were performed for p = 0, and for dry MNPs, p = 0.2. The modeled results indicate no magnetic dipole interaction for MNP in water, while there is a non-negligible interaction between MNPs when they are in dry, packed conditions. This computational model has also been applied to Micromod BNF type particles.69 To further understand the interactions between the MNPs, we modeled the electromagnetic (EM) field behavior between the MNPs.
One of the potential reasons why the Dartmouth MNPs do not develop hysteresis in solution is a result of the weak or negligible magnetic interactions between particles. The effects of magnetic dipolar interactions on the MNP hysteresis and heating efficiency have recently been studied intensively.17–27,34,39,63 These studies have demonstrated a strong interaction effect between MNP aggregates and have attributed it to the observed MNP hysteresis. However, the detailed mechanism of the power loss in a MNPs assemblies, which exhibit particle-particle, particle-aggregate, and aggregate-aggregate strong and weak interactions, are not yet known. There is a general lack of clear understanding of how MNP interactions affect power loss which has subsequently caused controversial results in the literature concerning SAR's dependence on MNP concentration. In this paper, the interaction effects are analyzed to quantify the Dartmouth's MNPs observed magnetic properties in dry and wet conditions. The study of how the Dartmouth MNPs' concentration affects SAR is not the subject of this paper, but will be presented in a subsequent paper.
C. Modeling magnetic field interaction between MNPs
We based the numerical simulations in this study on the Method of Auxiliary Sources (MAS). The MAS is a robust, easy to implement, and accurate numerical technique developed for solving a large range of electromagnetic radiation and scattering problems. It has been successfully applied to the investigation of waveguide structures, antennas, complex media, etc.66,70,71 In MAS, the boundary value problems are solved numerically using a representation of the electromagnetic field in each domain of the structure of interest by a finite linear combination of analytical solutions of the relevant field equations. These solutions correspond to the fields created by auxiliary EM field sources (individual set for each domain), and are usually chosen to be elementary dipoles (or charges), located on fictitious surfaces that conform to the actual boundaries of the structure of interest. Knowledge of the detailed mesh structure of the modeled objects is not required, which is one of the advantages of the MAS over finite element methods.
There are two layers of auxiliary sources set up for each physical boundary in the problem: the inner layer of sources describes EM fields outside of this boundary, while the outer layer describes the fields in the space confined by the boundary. The only constraint placed on the fields is to satisfy boundary conditions for Maxwell's equations. These conditions can be evaluated at a finite number of collocation points across the object boundaries, leading to a system of linear equations binding together the amplitudes of the auxiliary sources. Thus, the scattering problem is solved once these amplitudes have been found: any other EM parameter of interest can be derived through the fields created by the auxiliary sources. This scheme also provides an easy way of monitoring the accuracy of the solution by observing the boundary condition mismatch in the area between the collocation points.
In this paper, we used the MAS to evaluate the interaction between MNPs and the distribution of the magnetic field inside and outside MNP aggregates as a function of the number of MNPs. We used the axial symmetry of the system to reduce the dimensionality of the problem.
To understand magnetic field interaction phenomena between MNPs, we selected two 5 nm diameter magnetic isotropic spheres, with equal relative permeability, μr = 100, for detailed analysis of magnetic field couplings. The spheres were exposed to a time varying AMF at 160 kHz. The calculations were performed for four separation distances: h = 0.1, 1, 5, and 15 nm. The accuracy of our simulations was controlled by monitoring the matching of boundary conditions of the MAS simulation. For all simulations in this paper, the boundary mismatch of the tangential components of electric E and magnetic H fields were kept below 1%. The magnetic field distributions for two spheres oriented vertically under a 10 cm radius Tx loop, and for two spheres oriented horizontally, are illustrated in Figures 4 and 5, respectively. The simulated results in Figure 4 show that the magnetic field between two vertically oriented spheres increases by an order of magnitude when the distance between spheres decreases from 15 nm to 0.1 nm. The results for horizontally oriented spheres in Figure 5 demonstrate opposite trends, i.e., the field between the spheres decreases as the distance between the spheres decreases. Thus, in both cases, we see significant magnetic interactions between MNPs; namely, MNPs oriented along the applied AMF produce local field enhancements, while MNPs oriented horizontally to the AMF decrease the effective local field around the MNP. These interaction effects strongly depend on the distance between MNPs and become negligible for separations more than three particle diameters (see Figures 4 and 5). Similar results were reported by Serantes et al.19 and Woińska et al.23 These interactions can be used to explain the magnetization curves in Figure 3; for MNPs in water, the distance between MNPs is higher than in the case of packed, dry MNPs. Thus, in case of Dartmouth MNPs in water, there are weak or negligible interactions between MNPs, and as a result these particles do not produce hysteresis. The absence of the hysteresis loop for MNPs in solution could also be related to their free whole rotation by the applied field in colloids. However, some MNPs exhibit hysteresis in colloidal solutions,22,69 which are due to magnetic interactions between MNPs. These interactions have a significant role in understand the magnetic properties of the dry, packed MNPs. Namely, for magnetization measurements of the dry MNPs, the particles are physically blocked and they only interact magnetically with nearby particles. These interactions change the MNP local magnetic field (see Figures 4 and 5) and their anisotropy energy. The balance between the magnetic anisotropy and applied AMF energies causes hysteresis.
FIG. 4.
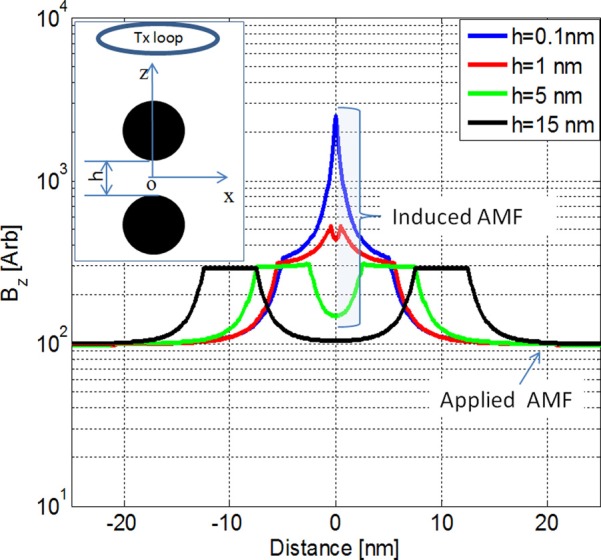
Total magnetic field versus distance along the z axis for two vertically orientated 5 nm diameter spheres separated by h = 0.1 nm, 1 nm, 5 nm, and 15 nm. The inset shows a schematic representation of the Tx loop and spheres in a coordinate system. The y axis is in plane. The Tx loop is placed at x = y = 0, z = 3 cm.
FIG. 5.
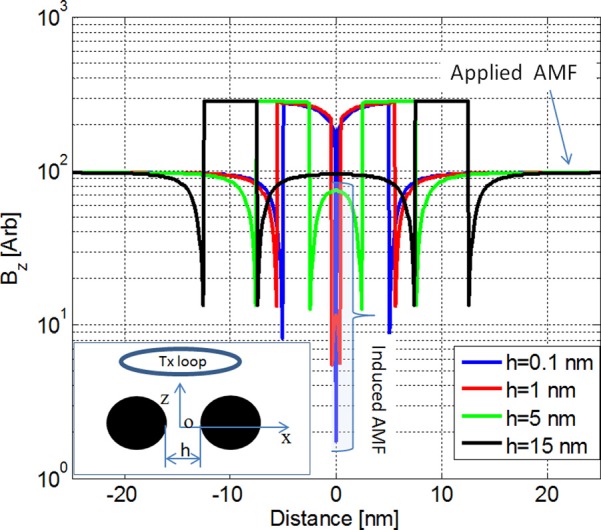
Total magnetic field versus distance along the x axis for two horizontally orientated 5 nm diameter spheres separated by h = 0.1 nm, 1 nm, 5 nm, and 15 nm. The inset shows a schematic representation of the Tx loop and spheres in a coordinate system. The y axis is in plane. The Tx loop is placed at x = y = 0, z = 3 cm.
To further understand the interaction phenomena for MNP aggregates, we simulated the magnetic fields for different numbers of MNPs at different locations. Namely, we created an aggregate of isotropic MNPs, with equal: radius R = 60 nm, distance between MNP spheres h = 20 nm, and relative permeability μr = 100 (see Figure 6). We started with two MNP spheres and calculated the magnetic fields at O (0,0,0) (left part of y-y plot on Figure 6) and P (0,0,1 μm) (right part on y-y plot on Figure 6) points. The aggregate is excited with a 10 cm radius Tx loop placed at (0,0,3 cm). The calculated fields versus number of MNPs are depicted in Figure 6.
FIG. 6.
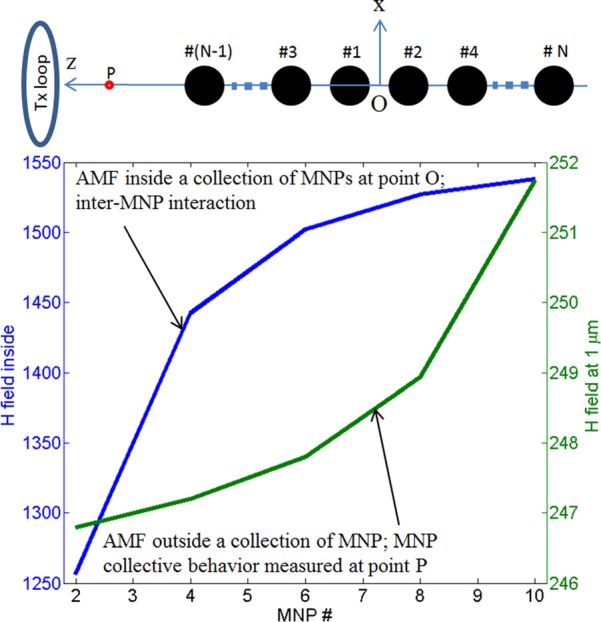
Calculated magnetic field (in arbitrary magnetic field units) versus number of MNPs in aggregate. Fields are calculated at the center of magnetic nanoparticle aggregation at O(0,0,0) and at P(0,0,1 μm) points, see schematic diagram above.
These studies show that as the number of MNPs increases the total (primary plus the interacting fields) magnetic interacting field at the center (point O) of aggregation increases and then saturates. Since, the MNP hysteresis loop depends on the magnetic interaction between MNPs, this result indicates that the MNPs hysteresis loop should saturate for a certain number of particles. Indeed, Serantes et al.19 reported hysteresis loops saturation versus number of particles for a MNPs assembly.19 The right part of y-y plot on Figure 6 shows that as the number of MNPs increases the total field at P (0,0,1 μm) point distance increases. This is due to two factors: (a) as the number of MNPs increases the distance between the observation point P and the MNP aggregation outer surface decreases, thus the field increases, and (b) as the volume of magnetic material increases, the field increases. So, for MNP hyperthermia, it is important to consider both inter-particle and aggregate-particle interactions.3 Note that these results are applicable for any size MNP, since the interaction distances between MNPs scale with the size of individual MNP cores.19
D. Specific absorption rate
Using the AMF system described in Sec. II B we measured the temperature response of the Dartmouth MNPs and of the BNF particles from Micromod under an AMF at a frequency of 154 kHz. From the measured temperature responses, we determined the SAR using Eq. (1). Our measured SARs were compared to published SARs for the JHU MNPs, which we have identified to be very promising particles for clinical use in MNP hyperthermia.29 Also, that group published a comparison with the commercially available Micromod BNF MNPs, which were measured with a different AMF system, allowing for the analysis of the validity of direct comparison. The comparisons are shown on Figure 7. All samples were colloidally suspended in water.
FIG. 7.
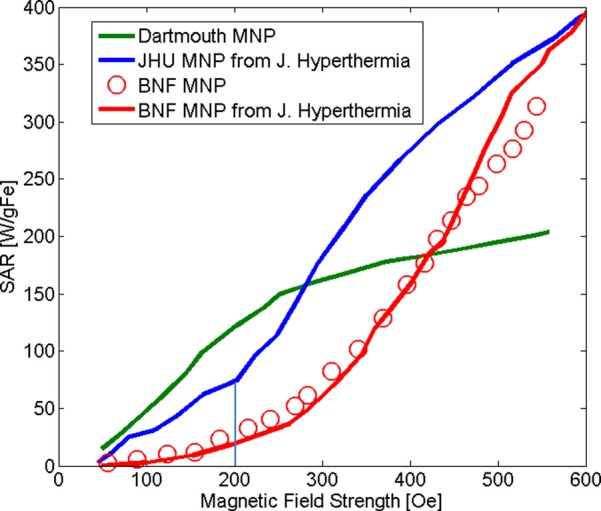
SARs for (1) Dartmouth MNP (green line), (2) JHU (blue line), (3) Micromod BNF measured in our lab (red circles), and (4) Micromod BNF measured at JHU (red line). The SAR values for JHU and BNF (red line) are from Ref. 29 and are given for comparison.
The results show that the SARs of Micromod BNF MNP measured in our lab and at JHU are similar, indicating that both systems output the same AMF, and the SAR estimation techniques used produce similar values. These comparisons also show that Dartmouth's new MNPs have higher SAR values then JHU and Micromod BNF particles at low field values. For example, at 200 Oe (16 kA/m), Dartmouth particle's SAR is ∼120 W/g, which is approximately 8 times higher than the BNF MNPs, and approximately 1.7 times higher than that of the JHU MNP. The high SAR at low field strength is very important for treating deep tumors, without producing unnecessary eddy current heating in surficial tissues. Thus, the new particles may open new possibilities for the application of MNP hyperthermia to deep tumor therapy.
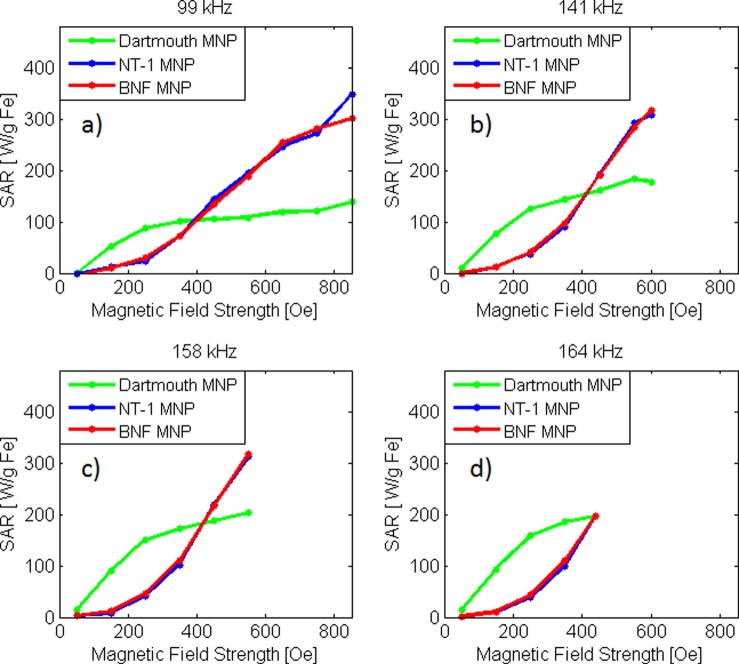
We also investigated the frequency dependence of the SAR of the Dartmouth MNPs. The results presented in Figure 8 show the relationship between SAR and field strength for different particle types, at 99, 141, 148, and 164 kHz. The particle types include the Dartmouth particles, BNF particles from Micromod and NT-1 also from Micromod. The BNF particles and NT-1 particles only differ in the manufacturing practices used during synthesis. Ultimately, for all of the applied frequencies, the Dartmouth MNP exhibits higher SAR at field strengths below approximately 440 Oe (35 kA/m), whereas both the NT-1 and BNF particles exhibit higher SAR above this field strength. The SAR was found to scale linearly with the frequency of the AMF see Figure 9 as expected from theory (discussed in Sec. III E 3).
FIG. 8.
Comparison of experimentally collected SAR vs. H of Dartmouth MNP and commercially available MNP (Micromod BNF) at (a) 99 kHz, (b) 141 kHz, (c) 158 kHz, and (d) 164 kHz.
FIG. 9.
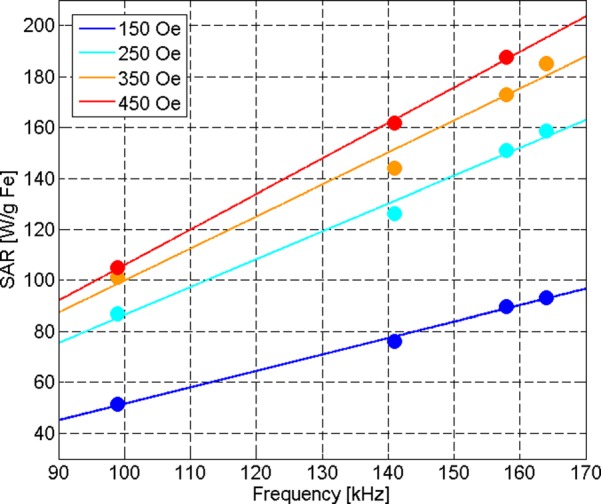
Experimentally collected SAR vs. Frequency for Dartmouth Particles at 99, 141, 158, and 164 kHz with corresponding linear least squares fitting functions.
E. Understanding Dartmouth MNPs power loss mechanism
To understand the dominant heating mechanisms for Dartmouth MNPs, we conduct quantitative analyses of all four previously mentioned power loss mechanisms.
1. Hysteresis loss
The power loss due to hysteresis loss per cycle is proportional to the area inside the hysteresis curve and is expressed as
| (3) |
where (T m/A) is the permeability of free space, M (A/m) is the magnetization, and H (A/m) is the magnetic field intensity. The negative sign is present because there is a lag between the magnetization and H field, which after integration in Eq. (3) yields a positive result. According to data presented in Sec. III B, the Dartmouth particles do not exhibit hysteresis when they are suspended in water. The MNP analysis (see Figure 1) shows that Dartmouth particles consist of about 27 nm core coated with 41.5 nm thick saccharide chains. This provides a minimum distance between cores equivalent to approximately three times the aggregate diameter when two particles are in physical contact. As a consequence, these particles exhibit a weak interaction and a thin hysteresis loop while in the dry condition (see Figure 3). When particles are in colloidal suspensions, the distances between MNPs exceed three particle diameters and the interaction effect diminishes.23,70 Since the Dartmouth MNP in colloidal suspension does not produce observable hysteresis (Figure 3(a)) according to Eq. (3), it follows that . Thus, the hysteresis loss can be considered as negligible part for Dartmouth MNPs power loss.
2. Power loss due to Néel and Browinian relaxations
The power loss density (W/m3) due to Néel relaxation (i.e., when the induced magnetic moment rotates within the crystal) and Brownian relaxation (i.e., when the magnetic moment is locked to the crystal axis and the particle rotates as the dipole moment aligns with the applied field) is expressed as40
| (4) |
where is the magnetic field dependent susceptibility,40 and τ is the effective relaxation time given as
| (5) |
The Néel relaxation time was estimated in45
| (6) |
where is the damping time, K is the anisotropy constant of the MNP, v is the magnetic volume of the particle, k is Boltzmann's constant, and T is the temperature. The Brownian relaxation time is given by49
| (7) |
where d is the hydrodynamic radius of the MNP, is the viscosity of the carrier fluid.
To further evaluate the contributions of Néel and Brownian relaxations in Dartmouth MNP power losses, we measured and analyzed MNP frequency spectra. The measured frequency spectra of the Dartmouth MNP in colloidal solution are illustrated in Figure 10.
FIG. 10.
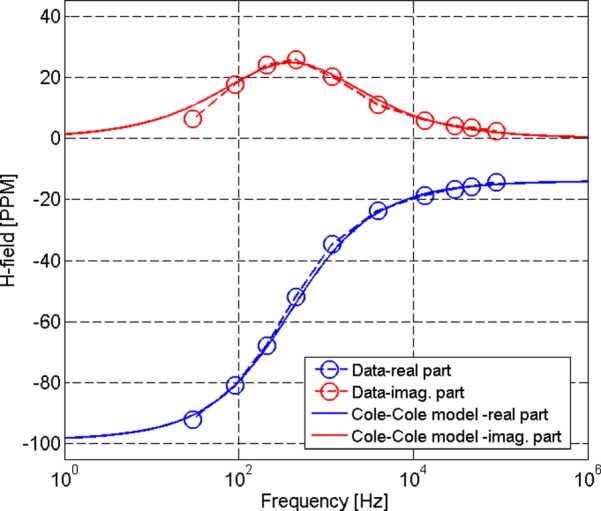
Frequency spectra of 3.25% Dartmouth MNP response while in 5.5 ml solution: correlation between experimental data (in PPM parts per million) and the Cole-Cole model.
The results show that the imaginary part of the measured magnetic field response, which is proportional to the MNP susceptibility, has a frequency peak between 300 and 400 Hz. From Eq. (7) with the measured and estimated MNP mean hydrodynamic diameter 110 nm (see Figure 1), the dynamic viscosity of water = 1 cP, and the temperature of 300 K, we obtain a Brownian relaxation time of 0.505 ms, corresponding to a frequency = 315 Hz, which is in a good agreement with the observed imaginary component's frequency peak. To analyze the wideband frequency dependence, the measured magnetic field's frequency spectra were fitted to the Cole-Cole model67
| (8) |
where , , and are real constant values estimated from the data, is a time constant and it is related to the resonance peak of the magnetic field's imaginary part. The Cole-Cole constant takes a value between 0 and 1 and provides the particles size distribution.72 Comparisons between Cole-Cole model, with model parameters = 14, = 85, = 0.33, and = 0.4 ms, and measured magnetic field data are shown in Figure 10. The results show good agreements between modeled and actual data. Two independent data analyses show that the Dartmouth MNP frequency peaks predicted from zeta sizes using the Brownian relaxation time ( = 315 Hz), and from the Cole-Cole model () are in good agreement. In addition, the Dartmouth MNP measured zeta size standard deviation and the Cole-Cole constant parameter are the same (0.33). These results show that maximum SAR due to Brownian relaxation for Dartmouth MNPs will occur between 300 and 400 Hz. The Cole-Cole model, which is applicable from DC to 10-th of megahertz frequency range,72 shows no frequency peaks between 100 kHz and 1 MHz. Thus, MNP free Brownian motion/rotation cannot be considered as the main heat loss contributor in the observed SAR shown in Figure 8, at frequencies of 99, 141, 158, and 164 kHz. From Eq. (5) we also estimated the Néel relaxation time, for MNPs of diameters 2 nm and 5 nm, as well as 27 nm aggregates, with K = 9.5 × 10³ (J/m3),58 and for s, which is a generally accepted value, as well as for s, as suggested in by Dormann et al.18 The estimated values of and for and are summarized in Table I. It should be noted that the value of K can increase by orders of magnitude due to ordered aggregation in the form of mNP chaining along the particles' easy axes at high frequency (9.8 GHz) and low temperature (180 K).24 This has not been taken into consideration in the following calculations because the frequency and temperature at which these results are relevant24 are outside of the range of interest for MNP hyperthermia.
TABLE I.
Estimated Néel relaxation time constants for 2 nm and 5 nm diameter MNPs, and for 27 nm MNP aggregates, which comprise the Dartmouth MNP system (see Figure 1).
| MNP diameter (nm) | ||||
|---|---|---|---|---|
| (s) | f (Hz) | (s) | f (Hz) | |
| 2 | 1.01 × 10⁻⁹ | 1.58 × 10⁸ | 1.0 × 10⁻¹⁰ | 1.58 × 10⁹ |
| 5 | 1.16 × 10⁻⁹ | 1.37 × 10⁸ | 1.2 × 10⁻¹⁰ | 1.37 × 10⁹ |
| 27 | 18.7 | 8.5 × 10⁻³ | 1.87 | 8.5 × 10⁻² |
The estimated Néel relaxation times and their corresponding frequency peaks for individual iron-oxide crystals of sizes 2–5 nm, and for 27 nm aggregates, are either at very high frequencies or at very low frequencies, respectively. These frequencies are outside of the useful range for MNP hyperthermia and our measured frequency bounds. Thus, this rules out the possibility that Néel relaxation contributes to Dartmouth MNP power losses.
3. Frictional loss
The Dartmouth MNPs consist of small single crystals. The magnetic moment (m) in each crystal is always aligned along the easy axis of magnetization and under applied H AMF the dipole moment m in MNP local coordinate system can be written as
| (9) |
where are polarizabilities along the MNP principal axis, and H is applied AMF on the MNP. Under external AMF, the magnetic particles experience translational and rotational forces. The translational movement depends on the gradient of the AMF and the rotational force depends on the field itself. As a result of these forces, the particles are rotating and moving in the colloidal solution and experience viscous friction. Under a fast oscillating magnetic field, the induced AMF forces drive particles to rotate/translate rapidly and as a result the applied AMF is transformed into heat via frictional loss between particles and the surrounding medium.65 In a liquid medium, the magnetic forces acting on the particles overcomes the viscous frictional force and generates the specific loss power per unit mass of the particle as
| (10) |
where is the MNP density, Ms is the saturation magnetization, and m is the induced magnetic moment. This expression shows that SAR due to rotational friction is proportional to the frequency, which coincides with the measured SAR frequency dependence, see in Figure 7. In addition, the SAR of MNPs due to friction is proportional to the square of the local magnetic field since m is proportional to H (see Eq. (9)), which also coincides with the measured SAR field dependent rule. From the correlations between Eq. (10) and the measured data, one can conclude that the main power loss mechanism for the Dartmouth MNPs is field-driven viscous frictional loss. The magnetic force moment, which is exerted on the particles, depends on the MNP shape. For example, a flower like (or other irregularly shaped) MNP has different polarizabilities along the principal axis, which provide enhanced torque to rotate the MNP about an axis parallel to the applied AMF. Consequently, to achieve increased SAR for hyperthermia therapy, it is better to produce irregularly shaped, rather than spherical MNPs. In addition, since the SAR due to the MNPs' frictional and hysteretical losses are both proportional to the frequency and square of the applied AMF, both mechanisms should be considered to describe the observed SAR's dependence on the MNPs shape and concentration.17,19–26
IV. CONCLUSIONS
A magnetic nanoparticle with high specific absorption rate at AMF low field strength (<250 Oe) is introduced. The studies have shown that the heating properties of the newly developed Dartmouth MNPs are superior to commercially available MNPs (Micromod BNF) at field strengths up to 440 Oe, in the AMF frequency range 99–164 kHz, while the SAR of the commercially available MNPs is higher at higher field strengths. An investigation into the heating mechanisms underlying the performance of the Dartmouth particles was conducted. Magnetization curves of the flower-like structures dispersed in water do not exhibit hysteresis under a DC magnetic field; however, hysteresis is exhibited in the dry state, which indicates MNP-MNP interaction and a change in behavior from superparamagnetic to slightly ferromagnetic. Modeling of multi-scale MNP-MNP interaction was shown to account for the influence of interaction on the heating properties in the dry state; however, the lack of hysteresis in the suspended state indicates hysteretic heating as a non-dominant power loss mechanism for the Dartmouth MNP. We have also shown that MNP frequency spectra exhibit a maximum at 398 Hz, indicating free Brownian relaxation of MNPs is not the dominant mechanism, and the calculation of Néel relaxation time constants for relevant crystal and aggregate sizes indicates that the Néel relaxation contribution is small or negligible at the frequencies of interest. Finally, correlations between measured data and theoretical analysis indicated the main power loss mechanism for the Dartmouth MNP is magnetic field-driven viscous frictional loss. In addition, the induced magnetic force moment shows that the irregular shape MNPs, such as the flower-like shape Dartmouth MNPs, produce higher SAR than spherical ones. These results also illustrate that more irregularly shaped MNPs, such as self-assembled chains of MNPs or nano-rod structures, which can exhibit both frictional and hysteresis power losses, should be designed, optimized, and produced to provide safe and effective MNP hyperthermia for deep tumor treatment.
ACKNOWLEDGMENTS
We would like to thank Charles Daghlian for TEM images, the Institute for Rock Magnetism Winchell School of Earth Sciences at the University of Minnesota for help with magnetic measurements, Alicia Petryk for collecting SAR data, Benjamin Barrowes for providing access to the wide-band electromagnetic induction sensor, the National Institutes of Health, and the Dartmouth Center of Cancer of Cancer Nanotechnology Excellence. Funding provided through NIH NCI Grant No. 1U54CA151662-05.
References
- 1.Siegel R., Ma J., Zou Z., and Jemal A., “ Cancer statistics, 2014,” CA: Cancer J. Clin. 64, 9–29 (2014). 10.3322/caac.21208 [DOI] [PubMed] [Google Scholar]
- 2.Thiesen B. and Jordan A., “ Clinical applications of magnetic nanoparticles for hyperthermia,” Int. J. Hyperthermia 24, 467–474 (2008). 10.1080/02656730802104757 [DOI] [PubMed] [Google Scholar]
- 3.Giustini A. J.et al. , “ Magnetic nanoparticle hyperthermia in cancer treatment,” Nano LIFE 01, 17–32 (2010). 10.1142/S1793984410000067 [DOI] [PMC free article] [PubMed] [Google Scholar]
- 4.Petryk A. A., Giustini A. J., Gottesman R. E., Trembly B. S., and Hoopes P. J., “ Comparison of magnetic nanoparticle and microwave hyperthermia cancer treatment methodology and treatment effect in a rodent breast cancer model,” Int. J. Hyperthermia 29(8), 819–827 (2013). 10.3109/02656736.2013.845801 [DOI] [PMC free article] [PubMed] [Google Scholar]
- 5.Oleson J. R.et al. , “ Biological and clinical aspects of hyperthermia in cancer therapy,” Am. J. Clin. Oncol. 11(3), 368–380 (1988). 10.1097/00000421-198806000-00013 [DOI] [PubMed] [Google Scholar]
- 6.Horsman M. R. and Overgaard J., “ Hyperthermia: A potent enhancer of radiotherapy,” Clin. Oncol. (R. Coll. Radiol.) 19(6), 418–426 (2007). 10.1016/j.clon.2007.03.015 [DOI] [PubMed] [Google Scholar]
- 7.Zhang C., Johnson D. T., and Brazel C. S., “ Numerical study on the multi-region bio-heat equation to model magnetic fluid hyperthermia (MFH) using low Curie temperature nanoparticles,” IEEE Trans. Nanobiosci. 7(4), 267–275 (2008). 10.1109/TNB.2008.2011857 [DOI] [PubMed] [Google Scholar]
- 8.Martinez-Boubeta C., Simeonidis K., Makridis A., Angelakeris M., Iglesias O., Guardia P.et al. , “ Learning from nature to improve the heat generation of iron-oxide nanoparticles for magnetic hyperthermia applications,” Sci. Rep. 3, 1652 (2013). 10.1038/srep01652 [DOI] [PMC free article] [PubMed] [Google Scholar]
- 9.Hergt R., Dutz S., and Roder M., “ Effects of size distribution on hysteresis losses of magnetic nanoparticles for hyperthermia,” J. Phys.: Condens. Matter 20(38), 385214 (2008). 10.1088/0953-8984/20/38/385214 [DOI] [PubMed] [Google Scholar]
- 10.Hergt R., Dutz S., and Zeisberger M., “ Validity limits of the Néel relaxation model of magnetic nanoparticles for hyperthermia,” Nanotechnology 21(1), 015706 (2010). 10.1088/0957-4484/21/1/015706 [DOI] [PubMed] [Google Scholar]
- 11.Kekalo K., Koo K., Zeitchick E., and Baker I., “ Microemulsion synthesis of iron core/iron oxide shell magnetic nanoparticles and their physicochemical properties,” in Proceedings of the 2011 MRS Fall Meeting, 2011. [DOI] [PMC free article] [PubMed] [Google Scholar]
- 12.Zhang G., Liao Y., and Baker I., “ Surface engineering of core/shell iron/iron oxide nanoparticles from microemulsions for hyperthermia,” Mater. Sci. Eng., C 30, 92–97 (2010). 10.1016/j.msec.2009.09.003 [DOI] [PMC free article] [PubMed] [Google Scholar]
- 13.Ivkov R., Gruettner C., Teller J., and Westphal F., U.S. patent WO 2005/013897 A2 (17 February 2005).
- 14.Kekalo K. A. and Baker I., “ Magnetic nanoparticles, composites, suspensions and colloids with high specific absorption rate (SAR),” U.S. patent pending (6 December 2013).
- 15.Hiergeist R., Andrä W., Buske N., Hergt R., Hilger I., Richter U., and Kaiser W., “ Application of magnetite ferrofluids for hyperthermia,” J. Magn. Magn. Mater. 201, 420–422 (1999). 10.1016/S0304-8853(99)00145-6 [DOI] [Google Scholar]
- 16.Palchoudhury S., Xu Y., Rushdi A., Holler R. A., and Bao Y., “ Controlled synthesis of iron oxide nanoplates and nanoflowers,” Chem. Commun. (Cambridge) 48, 10499–10501 (2012). 10.1039/c2cc35945f [DOI] [PubMed] [Google Scholar]
- 17.Cervadoro A., Cho M., Key J., Cooper C., Stigliano C., Aryal S.et al. , “ Synthesis of multifunctional magnetic nanoflakes for magnetic resonance imaging, hyperthermia, and targeting,” ACS Appl. Mater. Interfaces 6, 12939–12946 (2014). 10.1021/am504270c [DOI] [PMC free article] [PubMed] [Google Scholar]
- 18.Dormann J. L., Fiorani D., and Tronc E., “ On the models for interparticle interactions in nanoparticle assemblies: Comparison with experimental results,” J. Magn. Magn. Mater. 202(1), 251–267 (1999). 10.1016/S0304-8853(98)00627-1 [DOI] [Google Scholar]
- 19.Serantes D., Simeonidis K., Angelakeris M., Chubykalo-Fesenko O., Marciello M., del Puerto Morales M., Baldomir D., and Martinez-Boubeta C., “ Multiplying magnetic hyperthermia response by nanoparticle assembling,” J. Phys. Chem. C 118, 5927–5934 (2014). 10.1021/jp410717m [DOI] [Google Scholar]
- 20.Branquinho L. C., Carriao M. S., Costa A. S., Zufelato N., Sousa M. H., Miotto R., Ivkov R., and Bakuzis A. F., “ Effect of magnetic dipolar interactions on nanoparticle heating efficiency: Implications for cancer hyperthermia,” Sci. Rep. 3, 2887 (2013). 10.1038/srep02887 [DOI] [PMC free article] [PubMed] [Google Scholar]
- 21.Lartigue L., Hugounenq P., Alloyeau D., Clarke S. P., Lévy M., Bacri J.-C., Bazzi R., Brougham D. F., Wilhelm C., and Gazeau F., “ Cooperative organization in iron oxide multi-core nanoparticlespotentiates their efficiency as heating mediators and MRI contrast agents,” ACS Nano 6, 10935–10949 (2012). 10.1021/nn304477s [DOI] [PubMed] [Google Scholar]
- 22.Dutz S., Kettering M., Hilger I., Muller R., and Zeisberger M., “ Magnetic multicore nanoparticles for Hyperthermia—Influence of particle immobilization in tumour tissue on magnetic properties,” Nanotechnology 22, 265102 (2011). 10.1088/0957-4484/22/26/265102 [DOI] [PubMed] [Google Scholar]
- 23.Woińska M., Szczytko J., Majhofer A., Gosk J., Dziatkowski K., and Twardowski A., “ Magnetic interactions in an ensemble of cubic nanoparticles: A Monte Carlo study,” Phys. Rev. B 88, 144421 (2013). 10.1103/PhysRevB.88.144421 [DOI] [Google Scholar]
- 24.Charilaou M., Kind J., García-Rubio I., Schüler D., and Gehring A. U., “ Magnetic anisotropy of non-interacting collinear nanocrystal-chains,” Appl. Phys. Lett. 104, 112406 (2014). 10.1063/1.4869092 [DOI] [Google Scholar]
- 25.Kronast F., Friedenberger N., Ollefs K., Gliga S., Tati-Bismaths L., Thies R.et al. , “ Element-specific magnetic hysteresis of individual 18 nm Fe nanocubes,” Nano Lett. 11, 1710–1715 (2011). 10.1021/nl200242c [DOI] [PubMed] [Google Scholar]
- 26.Yoon T. J., Lee H., Shao H., Hilderbrand S. A., and Weissleder R., “ Multicore assemblies potentiate magnetic properties of biomagnetic nanoparticles,” Adv. Mater. 23, 4793–4797 (2011). 10.1002/adma.201102948 [DOI] [PMC free article] [PubMed] [Google Scholar]
- 27.Dunin-Borkowski R. E., McCartney M. R., Frankel R. B., Bazylinski D. A., Posfai M., and Buseck P. R., “ Magnetic microstructure of magnetotactic bacteria by electron holography,” Science 282, 1868–1870 (1998). 10.1126/science.282.5395.1868 [DOI] [PubMed] [Google Scholar]
- 28.Limbach L. K., Wick P., Manser P., Grass R. N., Bruinink A., and Stark W. J., “ Exposure of engineered nanoparticles to human lung epithelial cells: Influence of chemical composition and catalytic activity on oxidative stress,” Environ. Sci. Technol. 41(11), 4158–4163 (2007). 10.1021/es062629t [DOI] [PubMed] [Google Scholar]
- 29.Wabler M., Zhu W., Hedayati M., Attaluri A., Zhou H., Mihaloc J., Geyh A., DeWeese T. L., Ivkov R., and Artemov D., “ Magnetic resonance imaging contrast of iron oxide nanoparticles developed for hyperthermia is dominated by iron content,” Int. J. Hyperthermia 30(3), 192–200 (2014). 10.3109/02656736.2014.913321 [DOI] [PMC free article] [PubMed] [Google Scholar]
- 30.Wust P., Gneveckow U., Johannsen M., Nohmer D., Henkel T., Kahmann F., Sehouli J., Felix R., Ricke J., and Jordan A., “ Magnetic nanoparticles for interstitial thermotherapy—feasibility, tolerance and achieved temperatures,” Int. J. Hyperthermia 22(8), 673–685 (2006). 10.1080/02656730601106037 [DOI] [PubMed] [Google Scholar]
- 31.Brezovich I. A., Atkinson W. J., and Lilly M. B., “ Local hyperthermia with interstitial techniques,” Cancer Res. 44, 4752s–4756s (1984). [PubMed] [Google Scholar]
- 32.Atkinson W. J., Brezovich I. A., and Chakraborty D. P., “ Usable frequencies in hyperthermia with thermal seeds,” IEEE Trans. Biomed. Eng. BME-31, 70–75 (1984). 10.1109/TBME.1984.325372 [DOI] [PubMed] [Google Scholar]
- 33.Etheridge M. L. and Bischof J. C., “ Optimizing magnetic nanoparticle based thermal therapies within the physical limits of heating,” Ann. Biomed. Eng. 41, 78 (2013). 10.1007/s10439-012-0633-1 [DOI] [PubMed] [Google Scholar]
- 34.Stigliano R. V., Shubitidze F., Petryk A. A.et al. , “ Magnetic nanoparticle hyperthermia: Predictive model for temperature distribution,” Proc. SPIE 8584, 858410 (2013). 10.1117/12.2007673 [DOI] [PMC free article] [PubMed] [Google Scholar]
- 35.Wust P., Nadobny J., Szimtenings M., Stetter E., and Gellermann J., “ Implications of clinical RF hyperthermia on protection limits in the the RF range,” Health Phys. 92, 565–573 (2007). 10.1097/01.HP.0000258918.36430.a3 [DOI] [PubMed] [Google Scholar]
- 36.Johannsen M., Gneveckow U., Taymoorian K., Thiesen B., Waldofner N., Scholz R., Jung K., Jordan A., Wust P., and Loening S. A., “ Morbidity and quality of life during thermotherapy using magnetic nanoparticles in locally recurrent prostate cancer: Results of a prospective phase I trial,” Int. J. Hyperthermia 23, 315–323 (2007). 10.1080/02656730601175479 [DOI] [PubMed] [Google Scholar]
- 37.Maier-Hauff K., Rothe R., Scholz R., Gneveckow U., Wust P., Thiesen B., Feussner A., Von Deimling A., Waldoefner N., Felix R., and Jordan A., “ Intracranial thermotherapy using magnetic nanoparticles combined with external beam radiotherapy: Results of a feasibility study on patients with glioblastoma multiforme,” J. Neurooncol. 81, 53–60 (2007). 10.1007/s11060-006-9195-0 [DOI] [PubMed] [Google Scholar]
- 38.Nieskoski D. and Trembly B. S., “ Comparison of a single optimized coil and a helmholtz pair for magnetic nanoparticle hyperthermia,” IEEE Trans. Biomed. Eng. 61(6), 1642 (2014). 10.1109/TBME.2013.2296231 [DOI] [PubMed] [Google Scholar]
- 39.Dutz S. and Hergt R., “ Magnetic nanoparticle heating and heat transfer on a microscale: Basic principles, realities and physical limitations of hyperthermia for tumour therapy,” Int. J. Hyperthermia 29(8), 790–800 (2013). 10.3109/02656736.2013.822993 [DOI] [PubMed] [Google Scholar]
- 40.Rosensweig R. E., “ Heating magnetic fluid with alternating magnetic field,” J. Magn. Magn. Mater. 252, 370–374 (2002). 10.1016/S0304-8853(02)00706-0 [DOI] [Google Scholar]
- 41.Gazeau F., Baravian C., Bacri J. C., Perzynski R., and Shliomis M. I., “ Energy conversion in ferro fluids: Magnetic nanoparticles as motors or generators,” Phys. Rev. E 56, 614 (1997). 10.1103/PhysRevE.56.614 [DOI] [Google Scholar]
- 42.Bertotti G., Hysteresis in Magnetism: For Physicists, Materials Scientists, and Engineers, Electromagnetism ( Academic Press, San Diego, 1998), xvii, 558 p. [Google Scholar]
- 43.Kronmüller H. and Fähnle M., Micromagnetism and the Microstructure of Ferromagnetic Solids, Cambridge Studies in Magnetism ( Cambridge University Press, New York, 2003), xv, 432 p. [Google Scholar]
- 44.Blums E., Cebers A., and Maiorov M. M., Magnetic Fluids ( Walter de Gruyter, Berlin, New York, 1997). [Google Scholar]
- 45.Néel L., “ Théorie du traînage magnétique des ferromagnétiques en grains fins avec applications aux terres cuites,” Ann. Géophys. 5, 99–136 (1949) (in French). An English translation is available in Selected Works of Louis Néel, edited by N. Kurti (Gordon and Breach, New York, 1988), pp. 407–427. [Google Scholar]
- 46.Debye P., Polar Molecules ( Dover, New York, 1929). [Google Scholar]
- 47.Müller H. W., Jang Y., and Liu M., “ Sound damping in ferrofluids: Magnetically enhanced compressional viscosity,” Phys. Rev. E 67, 31201 (2003). 10.1103/PhysRevE.67.031201 [DOI] [PubMed] [Google Scholar]
- 48.Müller H. W. and Engel A., “ Dissipation in ferrofluids: Mesoscopic versus hydrodynamic theory,” Phys. Rev. E 60(6), 7001 (1999). 10.1103/PhysRevE.60.7001 [DOI] [PubMed] [Google Scholar]
- 49. W. F. Brown, Jr. , “ Thermal fluctuations of a single-domain particles,” Phys. Rev. 130, 1677 (1963). 10.1103/PhysRev.130.1677 [DOI] [Google Scholar]
- 50.Gazeau F., Heegaard B. M., Bacri J. C., Cebers A., and Perzynski R., “ Magnetic fluid under vorticity: Free precession decay of magnetization and optical anisotropy,” Phys. Rev. E 54(4), 3672 (1996). 10.1103/PhysRevE.54.3672 [DOI] [PubMed] [Google Scholar]
- 51.Fannin P. C., Scaife B. K. P., and Charles S. W., “ The measurement of the frequency-dependent susceptibility of magnetic colloids,” JMMM 72, 95 (1988). 10.1016/0304-8853(88)90276-4 [DOI] [Google Scholar]
- 52.Krycka K. L., Jackson A. J., Borchers J. A., Shih J., Briber R., Ivkov R., Gruettner C., and Dennis C. L., “ Internal magnetic structure of dextran coated magnetite nanoparticles in solution using small angle neutron scattering with polarization analysis,” J. Appl. Phys. 109, 07B513 (2011). 10.1063/1.3540589 [DOI] [Google Scholar]
- 53.Bordelon D., Cornejo C., Gruettner C., DeWeese T. L., and Ivkov R., “ Magnetic nanoparticle heating efficiency reveals magneto-structural differences when characterized with a wide ranging and high amplitude alternating magnetic field,” J. Appl. Phys. 109, 124904 (2011). 10.1063/1.3597820 [DOI] [Google Scholar]
- 54.Hedayati M., Attaluri A., Bordelon D., Goh R., Armour M., Zhou H., Cornejo C., Wabler M., Zhang Y., DeWeese T., and Ivkov R., “ New iron-oxide particles for magnetic nanoparticle hyperthermia: An in-vitro and in-vivo pilot study,” in Energy-based Treatment of Tissue and Assessment VII, Proceedings of SPIE Vol. 8584, edited by Ryan T. P. ( SPIE, Bellingham, WA, 2013), p. 858404. [Google Scholar]
- 55.Fannin P. C., “ An experimental observation of the dynamic behavior of ferro fluids,” JMMM 136, 49 (1994). 10.1016/0304-8853(94)90445-6 [DOI] [Google Scholar]
- 56.Fannin P. C. and Relihan T., “ On the influence of inertial effects, arising from rotational Brownian motion, on the complex susceptibility of ferro fluids,” J. Phys. D 28, 1765 (1995). 10.1088/0022-3727/28/9/002 [DOI] [Google Scholar]
- 57.Fannin P. C. and Charles S. W., “ On the influence of a uniform magnetic field on the Néel relaxation of a colloidal suspension of nanometer sized particles,” J. Phys. D 30, 2292 (1997). 10.1088/0022-3727/30/16/006 [DOI] [Google Scholar]
- 58.Fannin P. C., Marin C. N., Couper C., Malaescu I., and Stefu M., “ A comparative study of the field dependence of the properties of colloidal suspensions of nanoparticles and magnetic microspheres,” in PIERS Proceedings, March 22–26, 2010, pp. 1802–1806. [Google Scholar]
- 59.Fannin P. C., Scaife B., Giannitsis A. T., and Charles S. W., “ Determination of the radius of nano-particles in a magnetic fluid by means of a constant frequency measurement technique,” J. Phys. D 35, 1305 (2002). 10.1088/0022-3727/35/12/304 [DOI] [Google Scholar]
- 60.Shliomis M. I. and Stepanov V. I., in Theory of Dynamic Susceptibility of Magnetic Fluids Relaxation Phenomena in Condensed Matter, edited by Coffey W. ( Wiley, Chichester, 1994). [Google Scholar]
- 61.Embs J., MÄuller H. W., LÄucke M., and Knorr K., “ Shear free measurement of the rotational viscosity of ferro-fluids with a forced torsional pendulum,” Magnetohydrodynamics 36, 387 (2001). [Google Scholar]
- 62.Shliomis M. I. and Morozov K. I., “ Negative viscosity of ferrofluid under alternating magnetic-field,” Phys. Fluids 6(8), 2855–2861 (1994). 10.1063/1.868108 [DOI] [Google Scholar]
- 63.Helgesen G.et al. , “ Aggregation of magnetic microspheres—Experiments and simulations,” Phys. Rev. Lett. 61(15), 1736–1739 (1988). 10.1103/PhysRevLett.61.1736 [DOI] [PubMed] [Google Scholar]
- 64.Raikher Y. L. and Stepanov V. I., “ Energy absorption by a magnetic nanoparticle suspension in a rotating field,” J. Exp. Theor. Phys. 112(1), 173–177 (2011). 10.1134/S1063776110061160 [DOI] [Google Scholar]
- 65.Felderhof B. U., “ Magnetoviscosity and relaxation in ferrofluids,” Phys. Rev. E 62, 3848–3854 (2000). 10.1103/PhysRevE.62.3848 [DOI] [PubMed] [Google Scholar]
- 66.Shubitidze F., K. O'Neill , Haider S. A., Sun K., and Paulsen K. D., “ Application of the method of auxiliary sources to the wide-band electromagnetic induction problem,” IEEE Trans. Geosci. Remote Sens. 40(4), 928–942 (2002). 10.1109/TGRS.2002.1006378 [DOI] [Google Scholar]
- 67.Cole K. S. and Cole R. H., “ Dispersion and absorption in dielectrics I. Alternating current characteristics,” J. Chem. Phys. 9, 341–352 (1941). 10.1063/1.1750906 [DOI] [Google Scholar]
- 68.Lu H. M., Zheng W. T., and Jiang Q., “ Saturation magnetization of ferromagnetic and ferrimagnetic nanocrystals at room temperature,” J. Phys. D: Appl. Phys. 40, 320–325 (2007). 10.1088/0022-3727/40/2/006 [DOI] [Google Scholar]
- 69.Stigliano R. V., Shubitidze F., Kekalo K.et al. , “ Understanding mNP hyperthermia for cancer treatment at the cellular scale,” Proc. SPIE 8584, 85840E (2013). 10.1117/12.2007518 [DOI] [PMC free article] [PubMed] [Google Scholar]
- 70.Shubitidze F., O'Neill K., Sun K., and Shamatava I., “ Coupling between highly conducting and permeable metallic objects in the EMI frequency range,” Appl. Comput. Electromagn. Soc. J. 19(1B), 139–148 (2004). [Google Scholar]
- 71.Shubitidze F., K. O'Neill , Sun K., Shamatava I., and Paulsen K. D., “ A hybrid full MAS and combined MAS/TSA algorithm for electromagnetic induction sensing,” Appl. Comput. Electromagn. Soc. J. 19(1B), 112–126 (2004). [Google Scholar]
- 72.Olhoeft G. R. and Strangway D. W., “ Magnetic relaxation and the electromagnetic response parameter,” Geophysics 39(3), 302–311 (1974). 10.1190/1.1440429 [DOI] [Google Scholar]


