Abstract
Human sulfotransferases (SULTs) comprise a small, 13-member enzyme family that regulates the activities of thousands of compounds—endogenous metabolites, drugs, and other xenobiotics. SULTs transfer the sulfuryl-moiety (–SO3) from a nucleotide donor, PAPS (3′-phosphoadenosine 5′-phosphosulfate), to the hydroxyls and primary amines of acceptors. SULT1A1, a progenitor of the family, has evolved to sulfonate compounds that are remarkably structurally diverse. SULT1A1, which is found in many tissues, is the predominant SULT in liver, where it is a major component of phase II metabolism. Early work demonstrated that catechins and nonsteroidal anti-inflammatory drugs inhibit SULT1A1 and suggested that the inhibition was not competitive versus substrates. Here, the mechanism of inhibition of a single, high affinity representative from each class [epigallocatechin gallate (EGCG) and mefenamic acid] is determined using initial-rate and equilibrium-binding studies. The findings reveal that the inhibitors bind at sites separate from those of substrates, and at saturation turnover of the enzyme is reduced to a nonzero value. Further, the EGCG inhibition patterns suggest a molecular explanation for its isozyme specificity. Remarkably, the inhibitors bind at sites that are separate from one another, and binding at one site does not affect affinity at the other. For the first time, it is clear that SULT1A1 is allosterically regulated, and that it contains at least two, functionally distinct allosteric sites, each of which responds to a different class of compounds.
Introduction
Human cytosolic sulfotransferases (SULTs) regulate the activities of thousands of small biomolecules—endogenous metabolites, drugs, and other xenobiotics—via transfer of the sulfuryl-moiety (–SO3) from the nucleotide donor, PAPS (3-phosphoadenosine 5′-phosphosulfate), to the hydroxyls and primary amines of acceptors. Small-molecule sulfonation regulates numerous nuclear- and G-protein-coupled receptors by weakening, often dramatically, the affinities of agonists and antagonists, including steroid (Zhang et al., 1998; Parker, 1999; Bai et al., 2011), thyroid (Visser, 1994), and peptide hormones (Matsubayashi and Sakagami, 2006), catecholamines (Johnson et al., 1980), bile acids (Takahashi et al., 1990), and dopamine (Whittemore et al., 1985). The ability of SULTs to recognize and sulfonate the receptor-binding determinants in complex small-molecule structures helps preserve normal functioning of the receptors by preventing the adventitious binding of xenobiotics. SULTs neutralize toxins and protoxins by preventing either their action (Edavana et al., 2011) or their activation (Glatt et al., 2001), and by substantially shortening their terminal half-lives (Adjei et al., 2008; Argiolas and Hedlund, 2001). Finally, there are many examples of compounds whose activities are “switched on” by sulfonation (Meisheri et al., 1988; Cook et al., 2009). Speaking generally, this modification is used in metabolism either to control chemistry or as a switch to toggle a molecule between distinctly different functional states.
SULT1A1, the focus of the current study, has a remarkably broad substrate spectrum (Nowell and Falany, 2006; Berger et al., 2011), which allows it to scan, and selectively modify, the scores of endogenous metabolites and xenobiotics that pass through hepatocyte cytosols. The molecular basis of this selectivity is intimately linked to the structure and dynamics of an approximately 30-residue active-site cap that mediates ligand-ligand and ligand-protein interactions (Cook et al., 2013a, b, c; Leyh et al., 2013). SULT1A1 is the most abundant SULT in adult human liver, where it is present in gram quantities (Riches et al., 2009), and is a major component of phase II metabolism.
Evolutionary pressures have shaped SULT1A1 to select specific substrates from complex mixtures of compounds. It stands to reason that such an enzyme would contain allosteric sites that allow it to better communicate with its environment; yet, this issue has received little attention in the SULT field (Hunts et al., 1985). A small but important body of literature has investigated SULT1A1 inhibition by catechins (Coughtrie and Johnston, 2001) and nonsteroidal anti-inflammatory drugs (NSAIDs) (Vietri et al., 2000). The inhibition patterns from these partial studies suggested that the compounds might inhibit allosterically. If so, their further study could segue into a deeper understanding of SULT regulation. In the current work, the complete mechanism of inhibition of a single representative from each class was determined, and their interactions were studied. They are indeed allosteres and, remarkably, they bind at separate, noninteracting sites. The therapeutic implications of these sites are discussed. For the first time, it is clear that in addition to its substrate binding sites, SULT1A1 harbors two separate, allosteric binding pockets.
Materials and Methods
The experimental materials and their sources are as follows: dithiothreitol, dimethylsulfoxide, ethylenediaminetetraacetic acid, imidazole, isopropyl-thio-β-d-galactopyranoside (IPTG), Luria broth, lysozyme, mefemanic acid (MEF), β‑mercaptoethanol, p-nitrophenol (pNP), pepstatin A, Na2HPO4, and NaH2PO4 were obtained from Sigma-Aldrich (St. Louis, MO). Ampicillin, HEPES, KCl, KOH, MgCl2, NaCl, and phenylmethylsulfonyl fluoride were purchased from Fisher Scientific, Pittsburgh, PA. Epigallocatechin gallate was obtained from Santa Cruz Biotechnology, Inc. (Dallas, TX). Glutathione- and nickel-chelating resins were obtained from GE Healthcare (Pittsburgh, PA). A competent Escherichia coli [BL21(DE3)] cell was purchased from Agilent Technologies (Santa Clara, CA). PAP and PAPS were synthesized in house as previously described (Zhang et al., 1998; Sun and Leyh, 2010; Cook et al., 2012) and were ≥98% pure as assessed by anion-exchange high-performance liquid chromatography.
Protein Purification.
The human SULT1A1 DNA was codon-optimized for E. coli (Mr. Gene GmbH/Bayern Innovativ, Nuremberg, Germany) and inserted into a pGEX6 vector containing a His/GST/MBP triple-affinity tag (Cook et al., 2013a). The enzyme was expressed in E. coli BL21(DE3) and purified according to a published protocol (Sun and Leyh, 2010). Briefly, enzyme expression was induced with IPTG (0.50 mM) in LB medium at 16°C for 14 hours. The cells were pelleted, resuspended in lysis buffer, sonicated, and centrifuged. The supernatant was loaded onto a Chelating Sepharose Fast Flow column (GE Healthcare) charged with Ni2+. The enzyme was eluted with imidazole (10 mM) onto a Glutathione Sepharose resin (GE Healthcare) from which it was then eluted with glutathione (10 mM). The tag was cleaved from SULT1A1 using PreScission Protease (GE Healthcare), and the enzyme and tag were separated using a glutathione resin. Finally, the protein was concentrated using a Millipore Ultrafiltration Disc–Ultracel (10 kDa cut off; Billerica, MA) and the concentration was determined spectrophotometrically (ε280 = 54 mM−1 cm−1) (Cook et al., 2013a). The enzyme was flash frozen and stored at –80°C.
Equilibrium Binding of Allosteric Inhibitors to SULT1A1.
The binding of allosteric inhibitors to different enzyme forms (E, E·pNP, E·PAPS, and E·PAPS·pNP) was monitored via ligand-induced change of the enzyme intrinsic fluorescence (λex = 290 nm, λem = 345 nm). Ligands were titrated into a solution containing SULT1A1 (10 nM, dimer), MgCl2 (5.0 mM), NaPO4 (50 mM), pH 7.2, T = 25 ± 2°C. Titrations were performed in duplicate. Data were averaged and least-squares fit using a model that assumes a single binding site per monomer (Sun and Leyh, 2010; Cook et al., 2012).
Initial-Rate Inhibition Studies.
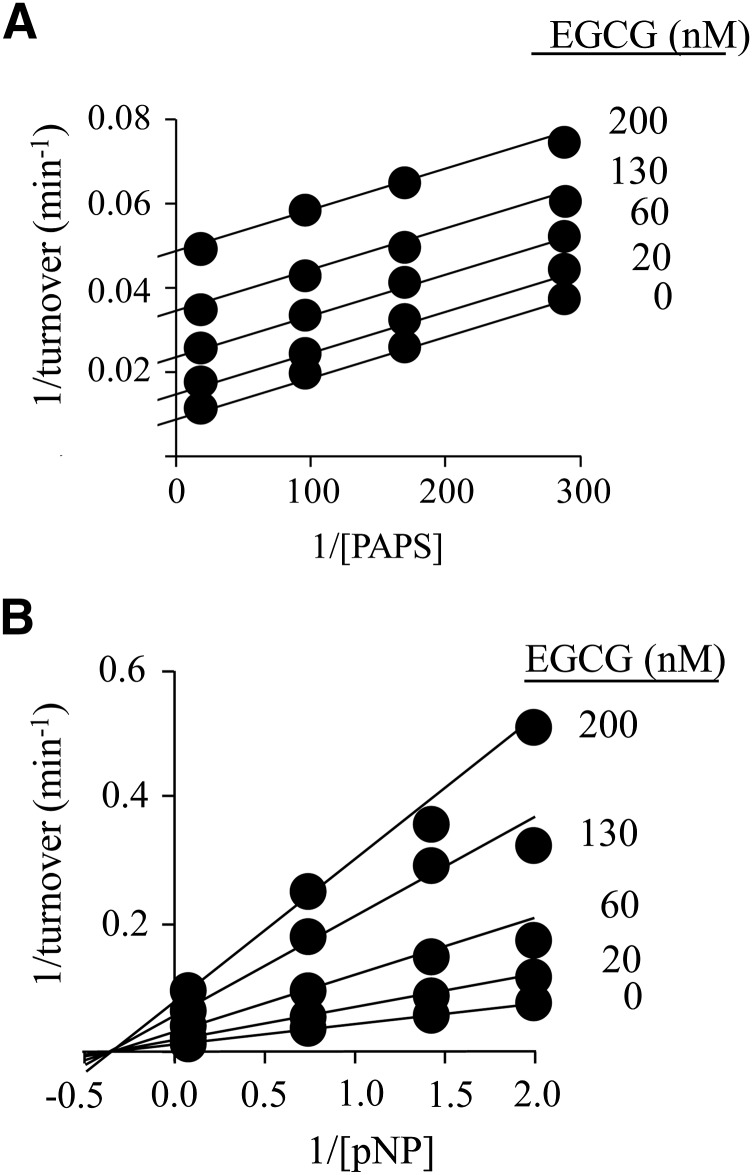
The initial-rate studies associated with Figs. 1 and 4 have either PAPS or pNP as the varied substrate, and in each case the complementary substrate is held fixed and saturating (see figures and legends for exact concentrations). In each case, a 4 × 5 concentration matrix (substrate × inhibitor) was used to define the inhibition pattern, and the substrate and inhibitor concentrations were varied in equal increments in double-reciprocal space from 0.2 to 5 × Km or Ki. In the studies associated with Figs. 6 and 7 both PAPS or pNP are fixed and saturating. To ensure that velocities were measured during the initial rate of reaction, less than 5% of concentration-limiting reactant consumed at the reaction endpoint was converted during the measurement in all cases. The buffer composition and conditions for all of the studies were as follows: NaPO4 (50 mM), MgCl2 (5.0 mM), pH 7.2, T = 25 ± 2°C.
Fig. 1.
The inhibition of SULT1A1 by EGCG. (A) EGCG versus PAPS. PAPS concentration was varied from 0.2 to 5 × Km, and EGCG concentrations are given in the figure. Reactions were initiated by addition of pNP at saturation (30 μM, 20 × Km), and reaction progress was monitored by following formation of 35S-pNPS. Velocities were determined by least-squares fitting of four-point progress curves. Less than 5% of the concentration-limiting substrate consumed at the reaction endpoint was converted during the measurement. Velocities were determined in duplicate, averaged, and the data were fit globally using an uncompetitive model. The results of the fit are given by the solid lines passing through the data. (B) EGCG versus pNP. Reactions were initiated by addition of PAPS at saturation (10 μM, 625 × Km), the pNP concentration varied from 0.2 to 5 × Km, and the EGCG concentration is given in the figure. Reaction progress was monitored at 405 nm. Less than 5% of the concentration-limiting substrate consumed at the endpoint of the reaction was converted during the measurement. Each point represents the average of three independent determinations. The lines through the points represent the behavior predicted by a global fit using a noncompetitive inhibition model. Reaction conditions for both panels were as follows: SULT1A1 (10 nM, dimer), MgCl2 (5.0 mM), and NaPO4 (50 mM), pH = 7.2, and T = 25 ± °C.
Fig. 4.
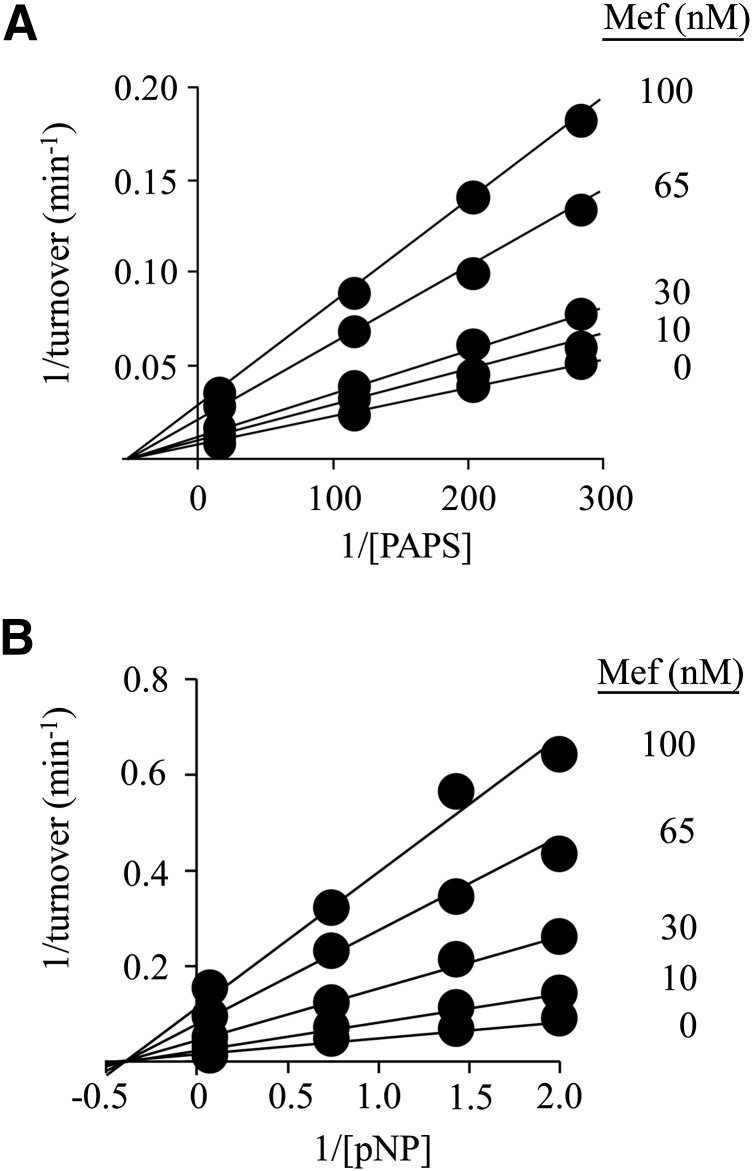
The inhibition of SULT1A1 by MEF. (A) MEF versus PAPS. Protocols were nearly identical to those associated with Fig 1, A and B. PAPS concentration was varied from 0.2 to 5 × Km, and MEF concentrations are listed in the figure. Reactions were initiated by addition of pNP at saturation (30 μM, 20 × Km), and reaction progress was monitored by following formation of 35S-pNPS. Velocities, obtained by least-squares fitting of four-point progress curves, were determined in duplicate, averaged, and the data were fit globally using a noncompetitive model. The fitting results are given by lines passing through the data. (B) MEF versus pNP. Reactions were initiated by addition of PAPS at saturation (10 μM, 625 × Km). The pNP concentration varied from 0.2 to 5 × Km, and MEF concentrations are given in the figure. Reaction progress was monitored at 405 nm. Less than 5% of the concentration-limiting substrate consumed at the endpoint of the reaction was converted during the measurement. Each point represents the average of three independent determinations. The lines through the points represent the behavior predicted by a global fit using a noncompetitive inhibition model. Reaction conditions for both panels are as follows: SULT1A1 (5.0 nM, dimer), MgCl2 (5.0 mM), and NaPO4 (50 mM), pH = 7.2, and T = 25 ± °C.
Fig. 6.
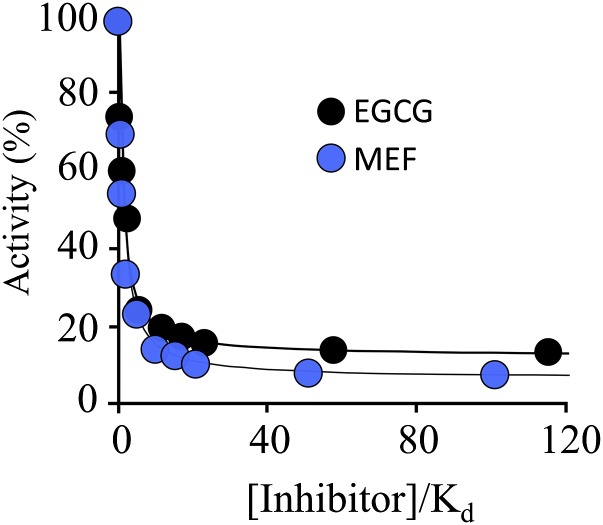
EGCG and MEF are partial inhibitors. Reaction progress was monitored at 405 nm. The conditions were as follows: SULT1A1 (1.0 nM, dimer), PAPS (10 μM, 625 × Km), PnP (30 μM, 22 × Km), MgCl2 (5.0 mM), NaPO4 (50 mM), pH 7.2, T = 25 ± 2°C. Less than 5% of the substrate converted at the endpoint of the reaction was consumed during the rate measurements. Each point represents the average of three independent determinations. The lines through the points indicate the behavior predicted by a least-squares fit using a model that assumes a single binding site per subunit. Ki values in the model were fixed using constants in Table 1, and data were fit only for the maximum inhibition value. The best-fit, maximum inhibition values for EGCG and MEF were 88 ± 2 and 94 ± 1%, respectively.
Fig. 7.
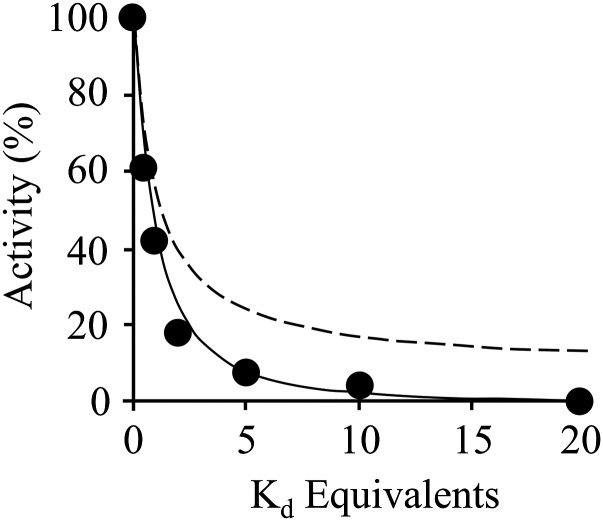
EGCG and MEF bind at separate and noninteracting sites. The pattern of SULT1A1 inhibition by EGCG and MEF in combination was used to assess their binding independence. EGCG and MEF were added simultaneously in equal Ki-equivalents over a concentration range that (as suggested by single-inhibitor studies) would cause the enzyme to transition from singly- to doubly-inhibitor bound. The curving solid lines are the predictions of a same-site (dashed line) and independent-site (solid line) binding models that were parameterized using the constants in Table 1. The experimental data (black dots) is in strong agreement with the additive model. Reaction conditions: SULT1A1 (20 nM), PAPS (10 μM, 625 × Km), pNP (36 μM, 22 × Km), MgCl2 (5.0 mM), and NaPO4 (50 mM), pH 7.2, T = 25 ± 2°C. Reactions were monitored at 405 nm. Each point is the average of three independent trials.
Reaction progress was monitored differently depending on which substrate was held fixed. When PAPS was fixed, reactions were monitored via the loss in absorbance at 405 nm that occurs as pNP is converted to pNPS
 |
(1) |
The pNP extinction coefficient was determined in the buffer used in the current study [NaPO4 (50 mM), MgCl2 (5.0 mM), pH 7.2, T = 25 ± 2°C]. Controls revealed that the salts in this buffer did not influence the pNP extinction coefficient at pH values where pNP is fully deprotonated (pH > 9), and its coefficient is well established (Biggs, 1954; Bowers et al., 1980; Anwar, 1984). When the pNP concentration was fixed, reaction progress was monitored by measuring the transfer of 35S from 35S-PAPS (15 nCi/reaction) pNP. To do so, the reactions were quenched at defined time intervals with NaOH (0.10 M, final), neutralized with HCl, boiled for 1.0 minute, and centrifuged at 12,100g. The samples were spotted onto an anion exchange thin-layer chromatography plate, and the labeled reactants were separated (LiCl mobile phase, 0.90 M) and quantitated using a STORM imaging system. Rates were obtained by least-squares fitting of four-point progress curves.
Results and Discussion
Epigallocatechin Gallate Inhibition of SULT1A1.
Catechins are water soluble flavanols that constitute ∼25% of the dry weight of green tea, and epigallocatechin gallate (EGCG) accounts for approximately half of the tea catechins (Sabhapondit et al., 2012). Previous work on the interactions of SULTs and dietary chemicals revealed that EGCG is a potent inhibitor of SULT1A1 (Ki = 42 nM). The mechanism of inhibition appeared to be uncompetitive versus PAPS; inhibition versus acceptor was not investigated. Initial-rate studies of EGCG inhibition versus both PAPS and acceptor (para-nitrophenol, pNP) are presented in Fig. 1, A and B. Inhibition versus PAPS is well fit using an uncompetitive model, which assumes that EGCG binds only to the PAPS-bound forms of the enzyme. In contrast, inhibition versus acceptor is well fit using a pure noncompetitive model, indicating that EGCG and acceptor bind at separate sites and do not influence one another’s affinity for the enzyme. The initial-rate inhibition parameters are listed in Table 1. The mechanism of SULT2A1 is rapid-equilibrium random (Wang et al., 2014), and it has been argued, on the basis of conservation of structure, the equivalence of initial-rate and thermodynamic parameters, and the partial substrate inhibition common within the family, that other SULTs, including SULT1A1 (Gamage et al., 2003), have similar mechanisms. Isotope-exchange experiments have been interpreted in favor of an ordered mechanism for SULT1A1; however, these results are also consistent with a random-binding mechanism that includes a dead-end complex (Cook and Cleland, 1981), which is the case with SULT1A1 (Gamage et al., 2005). For these reasons, we assume that the binding mechanism of SULT1A1 is random.
TABLE 1.
SULT1A1 inhibition by EGCG and MEF
| Ligand | Ki | Km | kcat |
|---|---|---|---|
| nM | μM | min−1 | |
| EGCG | 34 (2)a | 13 (2)b | |
| MEF | 27 (1) | 6.6 (1)b | |
| pNP | 1.6 (0.1)c | 66 (4)c | |
| PAPS | 0.016 (0.001)c | 66 (4)c |
Values in parentheses indicate one S.D.
kcat at saturating inhibitor (Fig. 6 and related text).
Values determined at [Inhibitor] = 0.
Although the inhibition studies are revealing, they leave several key mechanistic issues unresolved. For example, a parallel-line inhibition pattern (Fig. 1A) indicates only that inhibitor binds significantly more tightly to the nucleotide-bound than nonbound forms of the enzyme. Further, the data do not address whether the enzyme is partially inhibited (i.e., turnover is reduced to a nonzero value at saturating inhibitor) or totally inhibited by EGCG.
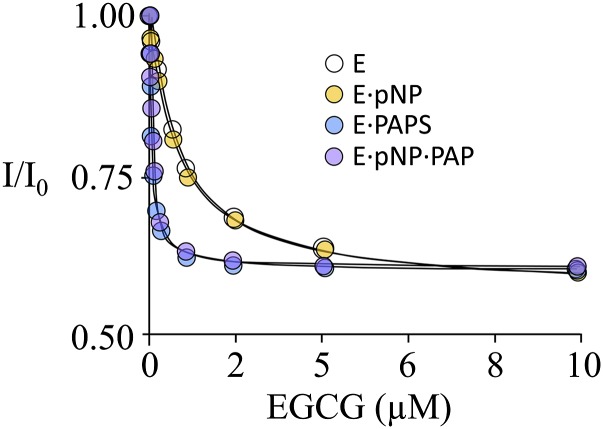
To identify the enzyme forms to which EGCG binds and obtain its binding affinities, equilibrium-binding studies were performed using the enzyme forms typically associated with the substrate section of the catalytic cycle (E, E∙pNP, E∙PAPS, and E∙pNP∙PAP). It should be noted that PAP is an excellent surrogate for PAPS in ternary-complex binding studies (Cook et al., 2013a). Binding was monitored via ligand-induced changes in the intrinsic fluorescence of SULT1A1(Cook et al., 2013a). In all cases, substrate-ligand concentrations were ≥15 × Kd (Cook et al., 2013a, c). The titrations are shown in Fig. 2, and the affinity constants are compiled in Table 2.
Fig. 2.
The binding of EGCG to SULT1A1. Binding was monitored via ligand-induced changes in the intrinsic fluorescence of SULT1A1 (λex = 295 nm, λem = 345 nm). Conditions were as follows: SULT1A1 (10 nM, dimer), PAP (0 or 10 μM, 33 × Kd), pNP (0 or 45 μM, 30 × Kd), MgCl2 (5.0 mM), NaPO4 (50 mM), pH 7.2, T = 25 ± 2°C. Each point is the average of two independent determinations. The line through the data represents a least-squares fit using a model that assumes a single binding site per subunit.
TABLE 2.
Inhibitor affinities for SULT1A1 complexes
| Inhibitor |
Enzyme Complex Kd |
|||
|---|---|---|---|---|
| E |
E·PAPS |
E·pNP |
E·PAP·pNP |
|
| nM | ||||
| EGCG | 820 (50)a | 38 (3) | 790 (30) | 35 (2) |
| MEF | 22 (1) | 25 (1) | 24 (2) | 25 (1) |
Values in parentheses indicate one S.D.
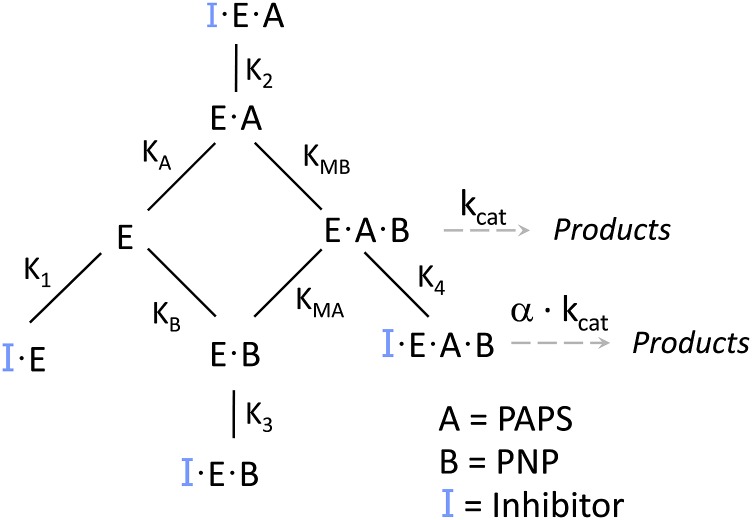
The studies reveal that EGCG binds to all four enzyme forms—the mechanism is depicted in Fig. 3. Its affinities for nucleotide-bound forms are identical within error, as are its affinities for the nucleotide-free forms; however, EGCG binds 21-fold more tightly to the enzyme when nucleotide is bound. The 21-fold difference in affinity provides an important clue as to the molecular basis of the inhibition. SULTs harbor a conserved 30-residue active-site cap that is positioned over both the nucleotide- and acceptor-binding pockets. Nucleotide binding stabilizes the cap in a “closed” position that encapsulates the nucleotide and acceptor and forms a pore that sterically restricts access to the acceptor-binding site (Cook et al., 2013c; Leyh et al., 2013; Wang et al., 2014). The cap can isomerize into an open state when nucleotide is bound, and it is from the open position that nucleotide escapes. The equilibrium constant for this isomerization, Kiso, has been measured for SULT1A1 and it equals 21 in favor of the closed position (Cook et al., 2013c, a). The fact that the value for the PAPS-induced enhancement in EGCG affinity and Kiso are the same strongly suggests that EGCG binding is linked to cap closure. It is particularly interesting that previous studies demonstrate that EGCG exhibits high affinity for SULT1A1, but not 1A2 or 1A3 (Coughtrie and Johnston, 2001), which are closely related isozymes whose caps differ slightly from that of SULT1A1. These facts, when taken together, are consistent with a model in which the isozyme specificity of the EGCG is determined by its interactions, either direct or indirect, with the cap.
Fig. 3.
The mechanism of SULT1A1 inhibition. Inhibitor (EGCG or MEF) binds to each of the enzyme forms in the substrate portion of the catalytic cycle. Turnover (kcat) for the inhibited and noninhibited species are related by α.
MEF Inhibition of SULT1A1.
A broad-based study of NSAID inhibition of SULT1A1 revealed that MEF is particularly potent [IC50 = 20 nM, (Vietri et al., 2002)]; however, the mechanism of its inhibition is not known. MEF inhibition of the initial rate of SULT1A1 turnover is plotted versus PAPS and pNP in Fig. 4, A and B. The velocities were determined in triplicate, averaged, and were well fit using a noncompetitive model, which assumes that the binding of substrate and inhibitor are entirely independent. The resulting affinity constants are compiled in Table 2. The simplest interpretation of these findings is that MEF binds to all four substrate forms of the enzyme at a site that is separate from those of the substrate-binding sites, and that MEF binding is not influenced by bound substrates. A notable feature of such mechanisms is that such inhibition cannot be “overcome” by an accumulation of substrate caused by restricted metabolic flow at the point of inhibition. It is interesting to note that the fact that MEF inhibits turnover without altering substrate affinities suggests that it perturbs only protein elements that control chemistry. Deeper mechanistic work will test this linkage.
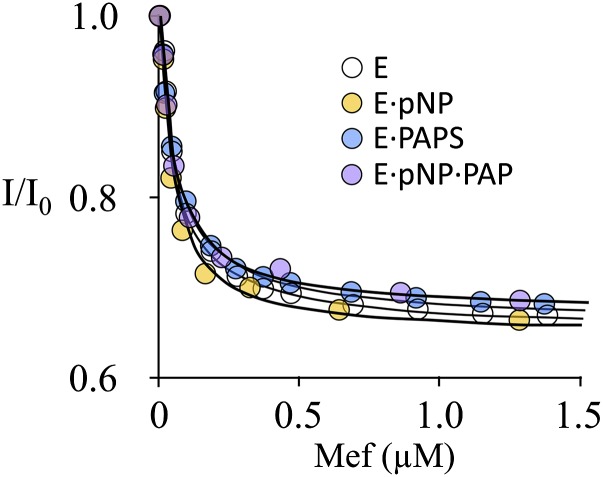
To confirm the implications of the initial-rate findings, MEF binding to same four enzyme forms used in the EGCG study was investigated in equilibrium-binding studies. Here again, binding was monitored via changes in SULT1A1 intrinsic fluorescence. The results of the titration (Fig. 5) are consistent with the predictions of the initial-rate study—MEF binds to all four forms (Fig. 3) and has nearly the same affinity (∼23 nM) for each complex (Table 2).
Fig. 5.
The binding of MEF to SULT1A1. The protocol was virtually identical to that described in Fig 2. Binding was monitored via ligand-induced changes in the intrinsic fluorescence of SULT1A1 (λex = 295 nm, λem = 345 nm). Each point is the average of two independent determinations. The line through the data represents a least-squares fit using a model that assumes a single binding site per subunit. Conditions were as follows: SULT1A1 (10 nM, dimer), PAP (0 or 10 μM, 33 × Kd), pNP (0 or 45 μM, 30 × Kd), MgCl2 (5.0 mM), NaPO4 (50 mM), pH 7.2, T = 25 ± 2°C.
EGCG and MEF Are Partial Inhibitors.
Partial inhibitors reduce turnover of an enzyme to a fixed, nonzero value at saturating inhibitor concentrations. The preceding initial-rate experiments do not have the resolution needed to distinguish between partial and total inhibition in cases where turnover is reduced to less than ∼10% of noninhibited turnover. To address this issue, the initial-rate of pNPS synthesis was determined at EGCG and MEF concentrations that ranged as high as 110 × Ki (Fig. 6). Velocities were determined in triplicate and averaged. The data were fit using a model that assumes a single inhibitor-binding site per subunit, and the best-fits are shown as solid lines passing through the datasets. Turnover clearly decreases to a nonzero value at saturating inhibitor; thus, EGCG and MEF are partial inhibitors. At saturating concentrations of MEF and EGCG, SULT1A1 turnover is reduced to 6 ± 1 and 12 ± 2%, respectively, of their uninhibited values.
EGCG and MEF Bind at Separate, Noninteracting Sites.
The mechanisms of EGCG and MEF inhibition are similar in that they each bind to the four enzyme forms studied; however, the fact that their inhibition mechanisms differ (that is, only EGCG exhibits enhanced affinity when PAPS is bound) suggested that they might bind at separate sites. If so, and if they operate independently (i.e., they do not influence one another’s affinity, or influence on turnover) their effects on SULT1A1 turnover will be additive. If, on the other hand, they bind at the same site, or at separate sites that are interactive, the effects will be nonadditive. To assess the additivity of their effects, the inhibitors were used in combination, and the results were compared with the predictions of same- and separate-site binding models. The study simultaneously varied inhibitor concentrations in equal Kd increments using the constants in Table 1. Assuming separate, noninteracting sites, this design causes the distribution of the inhibitor-bound forms of the enzyme to shift from predominantly single- to double-inhibitor occupancy as the concentration increases from low to high Kd equivalents. As the shift occurs, deviations from simple additivity can be observed. The patterns predicted by separate noninteracting, and same-site binding models are shown, in Fig. 7, in solid and dashed lines, respectively. The models were parameterized using the constants obtained from the single-inhibitor studies (Table 1). The same-site model poorly describes the data; the separate noninteracting site model provides an excellent fit. Thus, each inhibitor binds at a separate site, and their actions are largely independent.
Inhibition by two independent, partial inhibitors differs substantially from that of a single inhibitor. At an inhibitor concentration equal to its affinity constant, assuming the enzyme concentration is negligible, half of the enzyme will be inhibitor-bound. This is also the case for the second inhibitor, since it binds independently. The fraction of the enzyme bound to both inhibitors is given by the product of the fraction-bound for the individual inhibitors—in this case, 0.25. Thus, one quarter of the total enzyme will be in each of the four possible forms: E, E∙IA, E∙IB and E∙IA∙IB. Turnover is given by the sum of the fraction of enzyme in each state weighted by its turnover. Given EGCG and MEF each at its Kd, turnover will be 29% of the uninhibited enzyme, which is nearly one-half (0.52) of that predicted for EGCG alone. An important consequence of double partial-inhibition is that turnover of double-inhibitor–bound enzyme is given by the product of the fraction-turnover associated with each inhibitor. Individually, EGCG and MEF reduce turnover to 0.12 and 0.06 times the noninhibited value, respectively; together, they reduce turnover to near zero, 0.0072.
The affinities of EGCG (34 nM) and MEF (27 nM) for SULT1A1 are well below their normal plasma concentrations. Unmodified EGCG achieves a peak concentration of ∼300 nM (8.8 × Ki) following consumption of 400 mg of pure compound, and consumption of MEF (500 mg) results in a peak concentration of 28 μM (1000 × Ki). Although inhibition studies have not yet been performed in humans, the plasma concentrations of EGCG and MEF are sufficient to inhibit 1A1 in vivo. It is notable that studies that used human liver extracts determined that the IC50 of MEF for SULT1A1 is approximately 20 nM (Vietri et al., 2002; De Santi et al., 2000).
Therapeutic Relevance.
As our society evolves toward greater drug dependency, predicting drug-drug or drug-xenobiotic interactions becomes increasingly complex. The drug regimen of an average nursing home resident in the United States includes routine administration of 8.3 drugs and an additional 3.2 drugs that are given pro re nata (Jones et al., 2009). The better we understand the interactions of these compounds with their cellular counterparts the more able we will be to predict whether compounds will interact, and the consequences of those interactions.
The neutralization of toxins, which occurs in a variety of ways, is among the primary functions of SULT1A1. Consider, for example, its role in preventing acetaminophen-induced hepatotoxicity—the most prevalent over-the-counter drug-induced hepatotoxicity in the United States (Larson et al., 2005). Acetaminophen is sulfonated (∼40%) by SULT1A1, and glucuronidated (∼60%) by UGT1A1 (Rogers et al., 1987). Whereas the conjugated form is nontoxic, the unconjugated compound is oxidized in liver, primarily by CYP3A4 (Larson et al., 2005), to N-acetyl-p-benzoquinone, which is cytotoxic. As the catalytic capacity of the conjugating systems becomes overwhelmed, either by overdose or inhibition owing to a coadministered compound, fatal toxicity can ensue (Larson et al., 2005). Thus one should carefully consider whether individuals taking acetaminophen are also consuming catechin-rich foods and liquids, and/or NSAIDs.
Sulfonation is a primary pathway for the activation of polyaromatic procarcinogens. The sulfonated derivatives of these compounds are unstable and thus disproportionate (heterolytically) into sulfate and highly reactive, planar electrophiles that covalently attach to DNA. sult-gene knockin and knockout studies (Sachse et al., 2014), and work with SULT-specific inhibitors, demonstrated that DNA adduct formation decreases dramatically when only the 1A1 isoform is inhibited. In this connection, it is notable that prostate cancer is 5- to 10-fold more probable in individuals who express high, versus low, levels of SULT1A1 activity in serum (Nowell et al., 2004). On the basis of these and similar findings, it is often suggested that, depending on diet, the routine consumption of SULT1A1 inhibitors contributes to a reduced incidence of cancer (Thorat and Cuzick, 2013; Pasche et al., 2014).
Recent work has shown that 76 of the 1211 FDA-approved small-molecule drugs are sulfonated by SULT1A1, and an additional 136 have been shown or are predicted to be SULT1A1 inhibitors (Cook et al., 2013c). In many instances, sulfonation inactivates these drugs by preventing them from binding to their target receptors, and it can dramatically shorten their terminal half-lives. The extent of sulfonation is idiosyncratic to both the compound and its cellular locale. In certain cases, UDP-glucuronosyltransferases compensate for lowered SULT activity by glucuronidating the moiety that would otherwise have been sulfonated (Kane et al., 1995). In many cases, SULT inhibition is expected to enhance the efficacy of a drug. In cases like propofol, where rapid inactivation by 1A1 is desirable for quickly bringing patients out of anesthesia (Vree et al., 1987), SULT1A1 inhibition is detrimental. Alternatively, using inhibition of SULT1A1 to substantially lengthen the half-life and efficacy of apomorphine could lead to a more stable anti-Parkinson therapeutics and a substantial reduction in the tremors associated with the disease (Calabresi et al., 2010).
Conclusions
The mechanisms of SULT1A1 inhibition by EGCG and MEF have been determined. Both of the compounds bind to each of the four enzyme forms normally associated with the substrate “half” of the catalytic cycle (E, E∙PAPS, E∙pNP, and E∙PAP∙pNP), and both are partial inhibitors—the enzyme turns over at a reduced rate when inhibitor is bound. The coincidence of the increase in affinity of EGCG caused by PAPS binding (21-fold) and the isomerization equilibrium constant for closure of the active-site cap when it is nucleotide-bound suggests that ECGC interacts, either directly or indirectly, with the cap in its closed configuration. The binding affinity of EGCG is independent of the acceptor, pNP. Unlike EGCG, the affinity of MEF is identical for all four enzyme forms—nucleotide has no effect. Remarkably, EGCG and MEF do not interact—they bind at separate sites and do not influence one another’s affinity. Thus, SULT1A1 has at least two independent allosteric binding sites in addition to its substrate-binding sites. SULT1A1 has been designed not only to recognize an extremely broad range of acceptor structures but to have multiple, independent allosteric binding pockets that are themselves broad in specificity. It is plausible, if not probable, that these sites will also respond to endogenous metabolites, and that they form the basis of an as yet unexplored molecular circuitry that enables the enzyme to sense and respond to the complex environment of the cytosol.
Abbreviations
- MEF
mefenamic acid, 2-(2,3-dimethylanilino)benzoic acid
- EGCG
epigallocatechin gallate, [(2R,3R)-5,7-dihydroxy-2-(3,4,5-trihydroxyphenyl)-3,4-dihydro-2H-chromen-3-yl] 3,4,5-trihydroxybenzoate
- NSAIDs
nonsteroidal anti-inflammatory drugs
- PAP
3′, 5′-diphosphoadenosine
- PAPS
3′-phosphoadenosine 5′-phosphosulfate
- pNP
para-nitrophenol
- SULT
sulfotransferase
Authorship Contributions
Participated in research design: Cook, Wang, Falany, Leyh.
Conducted experiments: Cook, Wang.
Performed data analysis: Cook, Wang, Leyh.
Wrote or contributed to the writing of the manuscript: Cook, Wang, Leyh.
Footnotes
The work was supported by the National Institutes of Health [Grants GM38953 and GM106158].
References
- Adjei AA, Gaedigk A, Simon SD, Weinshilboum RM, Leeder JS. (2008) Interindividual variability in acetaminophen sulfation by human fetal liver: implications for pharmacogenetic investigations of drug-induced birth defects. Birth Defects Res A Clin Mol Teratol 82:155–165. [DOI] [PubMed] [Google Scholar]
- Argiolas A, Hedlund H. (2001) The pharmacology and clinical pharmacokinetics of apomorphine SL. BJU Int 88 (Suppl 3):18–21. [DOI] [PubMed] [Google Scholar]
- Bai Q, Xu L, Kakiyama G, Runge-Morris MA, Hylemon PB, Yin L, Pandak WM, Ren S. (2011) Sulfation of 25-hydroxycholesterol by SULT2B1b decreases cellular lipids via the LXR/SREBP-1c signaling pathway in human aortic endothelial cells. Atherosclerosis 214:350–356. [DOI] [PMC free article] [PubMed] [Google Scholar]
- Beg AE. (1984) The effect of pH various additives on extinction coefficients for p-nitrophenol. J Chem Soc Pak 6:55–61. [Google Scholar]
- Berger I, Guttman C, Amar D, Zarivach R, Aharoni A. (2011) The molecular basis for the broad substrate specificity of human sulfotransferase 1A1. PLoS ONE 6:e26794. [DOI] [PMC free article] [PubMed] [Google Scholar]
- Biggs AI. (1954) A spectrophotometric determination of the dissociation constants of p-nitrophenol and papaverine. Trans Faraday Soc 50:800–802. [Google Scholar]
- Bowers GN, Jr, McComb RB, Christensen RG, Schaffer R. (1980) High-purity 4-nitrophenol: purification, characterization, and specifications for use as a spectrophotometric reference material. Clin Chem 26:724–729. [PubMed] [Google Scholar]
- Calabresi P, Di Filippo M, Ghiglieri V, Tambasco N, Picconi B. (2010) Levodopa-induced dyskinesias in patients with Parkinson’s disease: filling the bench-to-bedside gap. Lancet Neurol 9:1106–1117. [DOI] [PubMed] [Google Scholar]
- Cook I, Wang T, Falany CN, Leyh TS. (2012) A nucleotide-gated molecular pore selects sulfotransferase substrates. Biochemistry 51:5674–5683. [DOI] [PMC free article] [PubMed] [Google Scholar]
- Cook I, Wang T, Almo SC, Kim J, Falany CN, Leyh TS. (2013a) The gate that governs sulfotransferase selectivity. Biochemistry 52:415–424. [DOI] [PMC free article] [PubMed] [Google Scholar]
- Cook I, Wang T, Almo SC, Kim J, Falany CN, Leyh TS. (2013b) Testing the sulfotransferase molecular pore hypothesis. J Biol Chem 288:8619–8626. [DOI] [PMC free article] [PubMed] [Google Scholar]
- Cook I, Wang T, Falany CN, Leyh TS. (2013c) High accuracy in silico sulfotransferase models. J Biol Chem 288:34494–34501. [DOI] [PMC free article] [PubMed] [Google Scholar]
- Cook IT, Duniec-Dmuchowski Z, Kocarek TA, Runge-Morris M, Falany CN. (2009) 24-hydroxycholesterol sulfation by human cytosolic sulfotransferases: formation of monosulfates and disulfates, molecular modeling, sulfatase sensitivity, and inhibition of liver x receptor activation. Drug Metab Dispos 37:2069–2078. [DOI] [PMC free article] [PubMed] [Google Scholar]
- Cook PF, Cleland WW. (1981) Mechanistic deductions from isotope effects in multireactant enzyme mechanisms. Biochemistry 20:1790–1796. [DOI] [PubMed] [Google Scholar]
- Coughtrie MW, Johnston LE. (2001) Interactions between dietary chemicals and human sulfotransferases-molecular mechanisms and clinical significance. Drug Metab Dispos 29:522–528. [PubMed] [Google Scholar]
- De Santi C, Pietrabissa A, Spisni R, Mosca F, Pacifici GM. (2000) Sulphation of resveratrol, a natural product present in grapes and wine, in the human liver and duodenum. Xenobiotica 30:609–617. [DOI] [PubMed] [Google Scholar]
- Edavana VK, Yu X, Dhakal IB, Williams S, Ning B, Cook IT, Caldwell D, Falany CN, Kadlubar S. (2011) Sulfation of fulvestrant by human liver cytosols and recombinant SULT1A1 and SULT1E1. Pharmgenomics Pers Med 4:137–145. [DOI] [PMC free article] [PubMed] [Google Scholar]
- Gamage NU, Duggleby RG, Barnett AC, Tresillian M, Latham CF, Liyou NE, McManus ME, Martin JL. (2003) Structure of a human carcinogen-converting enzyme, SULT1A1. Structural and kinetic implications of substrate inhibition. J Biol Chem 278:7655–7662. [DOI] [PubMed] [Google Scholar]
- Gamage NU, Tsvetanov S, Duggleby RG, McManus ME, Martin JL. (2005) The structure of human SULT1A1 crystallized with estradiol. An insight into active site plasticity and substrate inhibition with multi-ring substrates. J Biol Chem 280:41482–41486. [DOI] [PubMed] [Google Scholar]
- Glatt H, Boeing H, Engelke CE, Ma L, Kuhlow A, Pabel U, Pomplun D, Teubner W, Meinl W. (2001) Human cytosolic sulphotransferases: genetics, characteristics, toxicological aspects. Mutat Res 482:27–40. [DOI] [PubMed] [Google Scholar]
- Hunts J, Ueda M, Ozawa S, Abe O, Pastan I, Shimizu N. (1985) Hyperproduction and gene amplification of the epidermal growth factor receptor in squamous cell carcinomas. Jpn J Cancer Res 76:663–666. [PubMed] [Google Scholar]
- Johnson GA, Baker CA, Smith RT. (1980) Radioenzymatic assay of sulfate conjugates of catecholamines and DOPA in plasma. Life Sci 26:1591–1598. [DOI] [PubMed] [Google Scholar]
- Jones AL, Dwyer LL, Bercovitz AR and Strahan GW (2009). The National Nursing Home Survey: 2004 overview. Vital Health Stat 13:26. [PubMed]
- Kane RE, Li AP, Kaminski DR. (1995) Sulfation and glucuronidation of acetaminophen by human hepatocytes cultured on Matrigel and type 1 collagen reproduces conjugation in vivo. Drug Metab Dispos 23:303–307. [PubMed] [Google Scholar]
- Larson AM, Polson J, Fontana RJ, Davern TJ, Lalani E, Hynan LS, Reisch JS, Schiødt FV, Ostapowicz G, Shakil AO, et al. Acute Liver Failure Study Group (2005) Acetaminophen-induced acute liver failure: results of a United States multicenter, prospective study. Hepatology 42:1364–1372. [DOI] [PubMed] [Google Scholar]
- Leyh TS, Cook I, Wang T. (2013) Structure, dynamics and selectivity in the sulfotransferase family. Drug Metab Rev 45:423–430. [DOI] [PMC free article] [PubMed] [Google Scholar]
- Matsubayashi Y, Sakagami Y. (2006) Peptide hormones in plants. Annu Rev Plant Biol 57:649–674. [DOI] [PubMed] [Google Scholar]
- Meisheri KD, Cipkus LA, Taylor CJ. (1988) Mechanism of action of minoxidil sulfate-induced vasodilation: a role for increased K+ permeability. J Pharmacol Exp Ther 245:751–760. [PubMed] [Google Scholar]
- Nowell S, Falany CN. (2006) Pharmacogenetics of human cytosolic sulfotransferases. Oncogene 25:1673–1678. [DOI] [PubMed] [Google Scholar]
- Nowell S, Ratnasinghe DL, Ambrosone CB, Williams S, Teague-Ross T, Trimble L, Runnels G, Carrol A, Green B, Stone A, et al. (2004) Association of SULT1A1 phenotype and genotype with prostate cancer risk in African-Americans and Caucasians. Cancer Epidemiol Biomarkers Prev 13:270–276. [DOI] [PubMed] [Google Scholar]
- Parker CR., Jr (1999) Dehydroepiandrosterone and dehydroepiandrosterone sulfate production in the human adrenal during development and aging. Steroids 64:640–647. [DOI] [PubMed] [Google Scholar]
- Pasche B, Wang M, Pennison M, Jimenez H. (2014) Prevention and treatment of cancer with aspirin: where do we stand? Semin Oncol 41:397–401. [DOI] [PMC free article] [PubMed] [Google Scholar]
- Riches Z, Stanley EL, Bloomer JC, Coughtrie MW. (2009) Quantitative evaluation of the expression and activity of five major sulfotransferases (SULTs) in human tissues: the SULT “pie”. Drug Metab Dispos 37:2255–2261. [DOI] [PMC free article] [PubMed] [Google Scholar]
- Rogers SM, Back DJ, Stevenson PJ, Grimmer SF, Orme ML. (1987) Paracetamol interaction with oral contraceptive steroids: increased plasma concentrations of ethinyloestradiol. Br J Clin Pharmacol 23:721–725. [DOI] [PMC free article] [PubMed] [Google Scholar]
- Sabhapondit S, Karak T, Bhuyan LP, Goswami BC, Hazarika M. (2012) Diversity of catechin in northeast Indian tea cultivars. ScientificWorldJournal 2012:485193. [DOI] [PMC free article] [PubMed] [Google Scholar]
- Sachse B, Meinl W, Glatt H, Monien BH. (2014) The effect of knockout of sulfotransferases 1a1 and 1d1 and of transgenic human sulfotransferases 1A1/1A2 on the formation of DNA adducts from furfuryl alcohol in mouse models. Carcinogenesis 35:2339–2345. [DOI] [PubMed] [Google Scholar]
- Sun M, Leyh TS. (2010) The human estrogen sulfotransferase: a half-site reactive enzyme. Biochemistry 49:4779–4785. [DOI] [PMC free article] [PubMed] [Google Scholar]
- Takahashi A, Tanida N, Kang K, Umibe S, Kawaura A, Furukawa K, Hikasa Y, Satomi M, Shimoyama T. (1990) Difference in enzymatic sulfation of bile acids between the mouse and rat. Tokushima J Exp Med 37:1–8. [PubMed] [Google Scholar]
- Thorat MA, Cuzick J. (2013) Role of aspirin in cancer prevention. Curr Oncol Rep 15:533–540. [DOI] [PubMed] [Google Scholar]
- Vietri M, De Santi C, Pietrabissa A, Mosca F, Pacifici GM. (2000) Inhibition of human liver phenol sulfotransferase by nonsteroidal anti-inflammatory drugs. Eur J Clin Pharmacol 56:81–87. [DOI] [PubMed] [Google Scholar]
- Vietri M, Vaglini F, Pietrabissa A, Spisni R, Mosca F, Pacifici GM. (2002) Sulfation of R(-)-apomorphine in the human liver and duodenum, and its inhibition by mefenamic acid, salicylic acid and quercetin. Xenobiotica 32:587–594. [DOI] [PubMed] [Google Scholar]
- Visser TJ. (1994) Role of sulfation in thyroid hormone metabolism. Chem Biol Interact 92:293–303. [DOI] [PubMed] [Google Scholar]
- Vree TB, Baars AM, de Grood PM. (1987) High-performance liquid chromatographic determination and preliminary pharmacokinetics of propofol and its metabolites in human plasma and urine. J Chromatogr A 417:458–464. [DOI] [PubMed] [Google Scholar]
- Wang T, Cook I, Falany CN, Leyh TS. (2014) Paradigms of sulfotransferase catalysis: the mechanism of SULT2A1. J Biol Chem 289:26474–26480. [DOI] [PMC free article] [PubMed] [Google Scholar]
- Whittemore RM, Pearce LB, Roth JA. (1985) Purification and kinetic characterization of a dopamine-sulfating form of phenol sulfotransferase from human brain. Biochemistry 24:2477–2482. [DOI] [PubMed] [Google Scholar]
- Zhang H, Varlamova O, Vargas FM, Falany CN, Leyh TS. (1998) Sulfuryl transfer: the catalytic mechanism of human estrogen sulfotransferase. J Biol Chem 273:10888–10892. [DOI] [PubMed] [Google Scholar]


