

Abstract
Metformin is the frontline therapy for type II diabetes mellitus. The oral bioavailability of metformin is unexpectedly high, between 40 and 60%, given its hydrophilicity and positive charge at all physiologic pH values. Previous studies in Caco-2 cell monolayers, a cellular model of the human intestinal epithelium, showed that during absorptive transport metformin is taken up into the cells via transporters in the apical (AP) membrane; however, predominant transport to the basolateral (BL) side occurs via the paracellular route because intracellular metformin cannot egress across the BL membrane. Furthermore, these studies have suggested that the AP transporters can contribute to intestinal accumulation and absorption of metformin. Transporter-specific inhibitors as well as a novel approach involving a cocktail of transporter inhibitors with overlapping selectivity were used to identify the AP transporters that mediate metformin uptake in Caco-2 cell monolayers; furthermore, the relative contributions of these transporters in metformin AP uptake were also determined. The organic cation transporter 1, plasma membrane monoamine transporter (PMAT), serotonin reuptake transporter, and choline high-affinity transporter contributed to approximately 25%, 20%, 20%, and 15%, respectively, of the AP uptake of metformin. PMAT-knockdown Caco-2 cells were constructed to confirm the contribution of PMAT in metformin AP uptake because a PMAT-selective inhibitor is not available. The identification of four intestinal transporters that contribute to AP uptake and potentially intestinal absorption of metformin is a significant novel finding that can influence our understanding of metformin pharmacology and intestinal drug-drug interactions involving this highly prescribed drug.
Introduction
Metformin is a widely prescribed antihyperglycemic agent for the treatment of type II diabetes mellitus. Despite its reputation as the front line antidiabetic agent, little is known about the intestinal absorption mechanism of this very hydrophilic drug (logD at pH 7.4 of −6.13) that is positively charged (pKa 12.4) at physiologic pH (Saitoh et al., 2004). The physicochemical properties of metformin do not promote efficient membrane permeation by passive diffusion, which should result in poor intestinal absorption unless its intestinal absorption is mediated by transporters. Metformin exhibits high but variable oral bioavailability 40–60% (Pentikäinen et al., 1979; Tucker et al., 1981) and undergoes flip-flop kinetics, where absorption is the rate-limiting step in its elimination following oral administration (Pentikäinen et al., 1979; Tucker et al., 1981). Furthermore, oral absorption of metformin is dose dependent (Noel, 1979; Pentikäinen et al., 1979; Tucker et al., 1981; Karttunen et al., 1983; Pentikäinen, 1986). These results are consistent with the hypothesis that oral absorption of metformin is mediated by transporters.
We have investigated the mechanism of intestinal absorption of metformin in the well established model of human intestinal epithelium, the Caco-2 cell monolayers (Proctor et al., 2008). The study showed that metformin was taken up efficiently across the apical (AP) membrane of Caco-2 cells by bidirectional cation-selective transporter(s) during absorptive transport. However, efflux of this drug across the basolateral (BL) membrane of Caco-2 cell monolayers was inefficient, resulting in accumulation in Caco-2 cells. We have proposed that after an oral dose, metformin is taken up by AP transporters into enterocytes, accumulated in the intestinal epithelium, and cycled between the enterocytes and intestinal lumen via AP uptake and efflux transporters; thus, availing multiple opportunities for efficient absorption via the paracellular route (Proctor et al., 2008).
The present study was undertaken to identify the cation-selective transporters that facilitate AP uptake of metformin in Caco-2 cell monolayers, and to determine their relative contributions toward metformin AP uptake. This was achieved by employing a combination of chemical inhibitors, both individually and as a cocktail, at concentrations that selectively inhibit the activity of transporters that were expected to be involved in the uptake of metformin. This study reports a novel but simple method to determine the relative contribution of four putative transporters, organic cation transporter 1 (OCT1), plasma membrane monoamine transporter (PMAT), serotonin reuptake transporter (SERT), and choline high-affinity transporter (CHT), in the overall AP uptake of metformin into Caco-2 cell monolayers.
Materials and Methods
Eagle’s minimum essential medium with Eagle’s salts and l-glutamate, F-12 Nutrient Mixture, HEPES (1 M), penicillin-streptomycin-amphotericin B solution (100×), nonessential amino acids (100×), geneticin, SuperScript III First-Strand Synthesis SuperMix, TaqMan Gene Expression Master Mix, and TaqMan Gene Expression Assays for OCT1, 2, 3, PMAT, multidrug and toxin extrusion (MATE) 1 and 2, SERT, CHT, and choline transporter–like protein (CTL) 1–5 were obtained from Life Technologies (Carlsbad, CA). Hanks’ balanced salt solution with calcium and magnesium was purchased from Mediatech, Inc. (Mannassas, VA). Hygromycin B solution was obtained from Roche Applied Science (Indianapolis, IN). Total RNA from normal human intestinal tissue was purchased from Zyagen (San Diego, CA). Fetal bovine serum (FBS), dialyzed FBS (mol. wt. cut-off 10,000), trypsin-EDTA (1×), cimetidine, mitoxantrone, corticosterone, desipramine, 1-methyl-4-phenylpyridinium (MPP+), paroxetine, and hemicholinium-3 (HC3) were purchased from Sigma-Aldrich (St. Louis, MO). [14C]Metformin was purchased from Moravek Biochemicals and Radiochemicals (Brea, CA). [3H]Serotonin was purchased from PerkinElmer (Waltham, MA). OCT1–3, novel organic cation transporter 2 (OCTN2), and mock transfected Chinese hamster ovary (CHO) cells were previously generated and characterized in our laboratory (Ming et al., 2009). The Caco-2 (HTB-37) cell line was obtained from the American Type Culture Collection (Manassas, VA). Human OCT1-knockdown Caco-2 clones were generated in our laboratory previously (Han et al., 2013). SERT transfected human embryonic kidney 293 (HEK 293) cells were provided by Dr. Randy Blakely from Vanderbilt University (Nashville, TN). Control HEK 293 cells were purchased from the Tissue Culture Facility at the University of North Carolina at Chapel Hill (Chapel Hill, NC). A radioimmunoprecipitation assay buffer system, rabbit anti-human OCT1 and SERT antibodies, goat anti-rabbit IgG-HRP (Santa Cruz Biotechnology, Dallas, TX), MOPS (4-morpholinepropanesulfonic acid) SDS running buffer stock, MOPS transfer buffer stock, protein ladder, protein gels, polyvinylidene difluoride Filter Paper Sandwich (Life Technologies, Grand Island, NY), Rabbit anti-human PMAT antibody and SuperSignal West Dura Chemiluminescent Substrate (Thermo Scientific, Waltham, MA), rabbit anti-human CHT antibody (Antibodies-Online, Atlanta, GA), and Western blot imaging system (Bio-Rad Laboratories, Hercules, CA) were purchased from the indicated sources.
Culturing of OCT-Expressing CHO Cells, SERT-Expressing HEK 293 Cells, and Caco-2 Cells
CHO cells that were stably expressing OCT1, OCT2, OCT3, OCTN2, and vector-control cells (mock) were cultured, and transport experiments were performed as described previously (Ming et al., 2009). Briefly, cells were cultured in F-12 Nutrient Mixture supplemented with 10% FBS, 100 units/ml penicillin, 100 µg/ml streptomycin, and 0.25 µg/ml amphotericin B with an additional 500 µg/ml geneticin for OCT1-3 and mock CHO cells or 200 µg/ml hygromycin B for OCTN2-CHO cells. The cells were passaged following 90% confluence using trypsin-EDTA, and plated at a 1:20 ratio in 75 cm2 T-flasks.
Caco-2 cells were cultured as described previously (Proctor et al., 2008). Briefly, the cells (passage numbers 30–40) were seeded at a density of 60,000 cells/cm2 on polycarbonate membranes of Transwells (Corning Inc., Tewksbury, MA). The culture medium was changed the day following seeding and every other day thereafter. Cell monolayers with transepithelial electrical resistance (TEER) greater than 300 Ω·cm2 were used for experimentation at 21–28 days postseeding. TEER values were measured before and after each experiment, and values greater than 300 Ω·cm2 indicated that metformin or transporter inhibitors used in the experiment did not affect cell viability and/or the integrity of the cell monolayers.
SERT-transfected HEK 293 cells and control parental HEK 293 lines were maintained in monolayer cultures in 75 cm2 flasks in an atmosphere of 5% CO2 at 37°C as described previously (Qian et al., 1997). Both cell lines were grown in Dulbecco’s modified Eagle’s medium containing 10% dialyzed FBS (mol. wt. cut-off 10,000; from Sigma-Aldrich), 2 mM glutamine, 100 units/ml penicillin, and 100 mg/ml streptomycin within 10 passages. The culture medium for the transfected cell line was supplemented with geneticin (250 mg/ml). Cells were seeded on 24-well poly-d-lysine–coated plates at 100,000 cells/well 48–72 hours before experimentation.
Metformin Cellular Uptake
Single Transporter-Expressing CHO Cells.
Transport experiments using CHO cells were performed as described previously (Ming et al., 2009). Briefly, CHO cells were seeded at 100,000 cells/cm2 in sterile 24-well polycarbonate plates, and transport experiments were performed between days 5 and 7 postseeding. The CHO cell monolayers were preincubated with transport buffer (Hanks' balanced salt solution with 25 mM d-glucose and 10 mM HEPES, pH 7.2) for 30 minutes at 37°C. Uptake experiments were initiated by replacing the buffer solution with 300 µl of dosing solution. Uptake was terminated at the indicated time points by aspirating the donor solution and washing the monolayer 3× with 1 ml of 4°C transport buffer. The cell monolayers were allowed to dry, and 500 µl of lysis buffer (0.1 N NaOH with 0.1% SDS) was added to each well. Plates were shaken for 3 hours to ensure total lysis of the cell monolayer. Protein content of the cell lysate was determined by the bicinchoninic acid protein assay (Pierce, Rockford, IL) with bovine serum albumin as a standard. Radiolabeled compound in the cell lysate was analyzed by liquid scintillation spectrometry and the rate of initial uptake of each compound was determined. The rate for metformin uptake into mock CHO cells was subtracted from the uptake rates obtained in each OCT-expressing cell line to obtain a corrected uptake rate reflective of only the carrier-mediated transport of metformin.
Caco-2 Cell Monolayers.
AP uptake of metformin was measured using methods outlined previously (Proctor et al., 2008) with minor deviations. Inhibition of [14C]metformin (0.15 µCi/ml, 10 µM, 5 minutes) AP uptake in Caco-2 cells was assessed by measuring uptake in the absence (control) or presence of cimetidine (5 µM), mitoxantrone (25 µM), corticosterone (150 µM), desipramine (200 µM), MPP+ (5 mM), paroxetine (0.1 µM), and HC3 (1 µM). Cell monolayers were preincubated for 30 minutes in transport buffer in the presence of the inhibitors outlined previously or by vehicle control bathing both the AP and BL compartments. AP uptake experiments were initiated by replacing the buffer solution in the AP donor compartment with transport buffer containing the substrate in the presence of an inhibitor or vehicle control. Uptake was terminated during the linear uptake range in Caco-2 cell monolayers (5 minutes) by washing the AP and BL compartments three times with 0.75 ml of 4°C transport buffer. The cell monolayers were allowed to dry, excised from the insert, lysed and analyzed as previously described, and the initial uptake rate of metformin was determined.
SERT-Expressing HEK 293 Cells.
Uptake of [14C]metformin by SERT was determined in SERT-transfected HEK 293 cells and corrected for [14C]metformin uptake in control HEK 293 cells. Following uptake, the cells were washed 3× with 4°C transport buffer, 500 µl of lysis buffer was added to the wells, and the cells were then incubated for 3 hours with shaking before counting the radioactivity. The apparent kinetic parameters Km and Vmax for metformin uptake were estimated to be ∼463 mM and ∼400 nmol/min per milligram protein, respectively. To determine whether this low affinity was due to surface binding of metformin, a [14C]metformin surface binding assay was performed. The cells were washed with 1 M unlabeled metformin following the 4°C transport buffer wash, and the amount of surface bound [14C]metformin released into the wash solution was quantified. After washing with metformin solution, the cells were lysed as described previously, the intrinsic uptake of [14C]metformin was quantified by scintillation spectrometry, and the intrinsic kinetic parameters were determined.
Generation of PMAT-Knockdown Caco-2 Clones
PMAT-knockdown Caco-2 clones were generated using a method similar to that used to generate OCT1-knockdown Caco-2 clones (Han et al., 2013). The PMAT-specific small interfering RNA sequence (sense strand: 5′-CAGCUUCAUCACGGACGUG-3′; antisense strand: 5′-CACGUCCGUGAUGAAGCUG-3′) was obtained from published reports (Engel et al., 2004). The antisense and sense oligonucleotides were linked together with a hairpin loop, and annealed with the respective complementary DNA oligonucleotides. Each resulting double-stranded DNA was inserted into BamHI and HindIII sites of the pRNATin-H1.2/Hygro vector (GenScript, Piscataway, NJ) to generate the short hairpin RNA plasmid. Caco-2 cells at 90% confluence were transfected with the short hairpin RNA plasmid, using the Nucleofector System (Amaxa, Gaithersburg, MD) according to the manufacturer’s protocol. Transfectants were selected with 0.2 mg/ml hygromycin B for 3 weeks, and screened by quantitative real-time polymerase chain reaction for OCT1 or PMAT expression. Three clones exhibiting, normal morphology and growth rate as well as the lowest PMAT gene expression were chosen for subsequent functional studies.
Real-Time Quantitative Reverse-Transcription Polymerase Chain Reaction
The mRNA expression of human OCT1–3, PMAT, MATE1–2, CHT, and CTL1–5 relative to 18s rRNA in Caco-2 cells and human intestine was determined using quantitative reverse-transcription polymerase chain reaction that was conducted using established methods (Holmes et al., 2006) with minor deviations as described previously (Han et al., 2013).
Western Blot Analysis
Wild-type Caco-2 cells and PMAT-knockdown Caco-2 cells were washed twice with ice-cold phosphate-buffered saline and lysed in the radioimmunoprecipitation assay buffer system using a sonicator. Human jejunal tissues (approximately 50 mg) were washed with water, and homogenized in the radioimmunoprecipitation assay buffer system. Protein concentrations of cell and tissue samples were determined by the bicinchoninic acid assay. Protein from cells (30 µg per lane) and tissues (40 µg per lane) were subjected to Western blot analyses as previously described (Han et al., 2013) using primary antibodies against OCT1, PMAT, SERT, and CHT. Glyceraldehyde-3-phosphate dehydrogenase (GAPDH) served as the loading control.
Data Analysis
A Michaelis-Menten equation with one saturable component was fit to the corrected initial uptake rate data, which represented only carrier-mediated transport, described by the following equation:
 |
(1) |
where C is the metformin concentration, Vmax is the maximal velocity, and Km is the Michaelis-Menten constant.
The inhibitory potency (e.g., the IC50 value) was determined for each inhibitor across the transporter expressing cell line. The following equation was fit to the corrected uptake data:
 |
(2) |
where V is the uptake rate in the presence of inhibitor I; Vo is the uptake rate in the absence of inhibitor; IC50 is the inhibitor concentration to achieve 50% inhibition; and n is the Hill coefficient. The uptake kinetic parameter and the IC50 curve parameter estimates were obtained by nonlinear regression analysis with GraphPad Prism 5 (La Jolla, CA). The IC50 data for [14C]metformin uptake into transporter expressing cells and Caco-2 cells were reported relative to the control. Statistical significance was evaluated by one-way analysis of variance followed by the Bonferroni post-hoc test unless otherwise noted. Data represent mean ± S.D; n = 3 unless otherwise noted; *P < 0.05, **P < 0.01, and ***P < 0.001 compared with the control; and #P < 0.05 compared with each other.
Results
Transporter mRNA Expression in Caco-2 Cell Monolayers and Human Intestinal Tissue.
Figure 1 shows the gene expression levels of the transporters implicated in metformin transport as well as other cation-selective transporters in Caco-2 cells and, for comparison, in human intestinal tissue. In Caco-2 cells, CTLs and SERT are the most highly expressed transporter genes relative to other cation-selective transporters examined, with PMAT and OCT3 genes also highly expressed. OCT1, OCT2, MATEs, and CHT are expressed at low but detectable levels (Fig. 1A). In human intestinal tissue, PMAT and OCT3 genes are highly expressed relative to the other transporters. SERT and CTL genes are also expressed in human intestine tissue, although their expression levels are not as high as those observed in Caco-2 cell monolayers; The OCT1 gene is expressed at low levels as in Caco-2 cell monolayers. OCT2, MATE2, and CHT mRNA expression was not detected in human intestine (Fig. 1B).
Fig. 1.
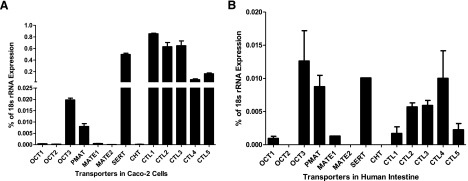
Expression levels of cation-selective transporter genes in Caco-2 cell monolayers (A) and human intestine tissue (B). Data represent mean ± S.D., n = 3.
Selectivity of a Panel of Inhibitors toward OCT1-, OCT2-, and OCT3-Mediated Metformin Uptake in Single Transporter-Expressing CHO Cells.
Because OCTs play a major role in hepatic uptake and renal elimination of metformin, it was reasonable to expect that these transporters would contribute to AP uptake of metformin, although these were not the most highly expressed transporters in the human intestinal tissue or Caco-2 cell monolayers (Fig. 1). Selectivity and potency of inhibitors of metformin uptake by OCT1–3 was evaluated in relation to the substrate activity of metformin in a panel of CHO cells that singly expressed OCT1, OCT2, OCT3, and OCTN2. These studies showed that metformin was a substrate for OCT1, OCT2, and OCT3 with apparent Km values of 3.1 ± 0.3, 0.6 ± 0.1, and 2.6 ± 0.2 mM, respectively (Supplemental Fig. 1). This confirms previous reports regarding substrate affinities of these transporters for metformin (Koepsell et al., 2007). In contrast, metformin uptake into OCTN2-expressing CHO cells was inefficient and not significantly different from uptake into the mock CHO cells (Supplemental Fig. 1), thus providing evidence that metformin is not a substrate for OCTN2. Therefore, this transporter was omitted in subsequent studies. The curves depicting inhibition of metformin uptake into OCT1-, OCT2-, and OCT3-expressing CHO cells by the OCT inhibitors, mitoxantrone, corticosterone, cimetidine, and desipramine are shown in Fig. 2, A–D, and the IC50 values are summarized in Table 1. Mitoxantrone, reported to be an OCT1-specific inhibitor (Koepsell et al., 2007), was a potent inhibitor of OCT1 with an IC50 value of 3.0 ± 0.8 µM, which is 40- to 60-fold lower than the estimated IC50 values for OCT2 and OCT3 (Fig. 2A; Table 1). Corticosterone and desipramine were also strong inhibitors of OCT1-mediated metformin uptake with similar inhibitory potency (e.g., IC50 values <4 µM), although not as selective for OCT1 as mitoxantrone. In fact, corticosterone is a selective inhibitor of OCT3 over OCT1 (>20-fold) and OCT2 (>8-fold). Corticosterone and desipramine were the most potent OCT2 inhibitors with IC50 values estimated to be less than 3 µM (Fig. 2, B and D; Table 1), but neither was a selective OCT2 inhibitor. Cimetidine is another potent inhibitor of OCT1-3 (IC50 values 10–21 µM; Table 1); notably, it has a 10- to 20-fold greater inhibitory potency toward another cation transporter, MATE1, with the reported IC50 value for MATE1 of 1.1 ± 0.3 µM (Fig. 2C; Table 1) (Tsuda et al., 2009).
Fig. 2.

Relative contributions of cation-selective transporters to the AP uptake of metformin into Caco-2 cell monolayers determined using a novel chemical inhibition scheme. Inhibition of metformin uptake (10 µM, 5 minutes) into OCT1-, 2-, and 3-expressing CHO cells by mitoxantrone (A), corticosterone (B), cimetidine (C), and desipramine (D). Data represent mean ± S.D., n = 3. Inhibition curves were fit to corrected uptake rate in the presence of varying concentrations of each inhibitor. (E) Chemical inhibition scheme to determine the contributions of transporters to metformin AP uptake in Caco-2 cell monolayers. (F) Inhibition of metformin AP uptake (10 µM, 5 minutes) in Caco-2 cell monolayers in the presence of chemical inhibitors shown in (E). Data represent mean ± S.D., n = 3. **P < 0.01, ***P < 0.001 compared with the control; #P < 0.05 compared with each other.
TABLE 1.
IC50 values for inhibitors of metformin uptake via cation-selective transporters
The IC50 values reported were experimentally determined except for those entries in which literature values are cited.
| Inhibitor |
IC50 Values (Mean ± S.D.) |
|||||
|---|---|---|---|---|---|---|
| OCT1 |
OCT2 |
OCT3 | SERT | CHT | CTLs | |
| µM | ||||||
| Mitoxantrone | 3.0 ± 0.8 | 135.0 ± 12.0 | 174.0 ± 19.0 | 977.2 ± 1.2 | N/A | N/A |
| Cimetidine | 20.9 ± 1.4 | 16.6 ± 1.3 | 9.8 ± 1.3 | N/A | N/A | N/A |
| Corticosterone | 3.2 ± 0.5 | 1.3 ± 0.1 | 0.2 ± 0.1 | N/A | N/A | N/A |
| Paroxetine | 1.0 ± 0.2 | 11.9 ± 1.2 | 6.4 ± 1.3 | 0.0060 ± 0.00059 | N/A | N/A |
| Desipramine | 2.2 ± 0.4 | 2.4 ± 0.2 | 3.8 ± 0.3 | 0.054 ± 0.0042a | N/A | N/A |
| HC3 | 112.2 ± 1.5 | 131.8 ± 1.4 | 524.8 ± 1.7 | 70.8 ± 1.2 | 0.004b | ~100c |
Contribution of OCTs and Other Cation Transporters toward AP Uptake of Metformin into Caco-2 Cell Monolayers.
The data for inhibition of OCT1–3 by mitoxantrone, cimetidine, corticosterone, and desipramine (Fig. 2, A–D; Table 1), combined with the previously reported data for inhibition of MATE1 (Tsuda et al., 2009) and PMAT (Engel and Wang, 2005), were used to develop a decision tree to estimate the contribution of these transporters toward metformin AP uptake into Caco-2 cells. The inhibitors were used singly or as a cocktail for estimating the relative contributions of these transporters in the AP uptake of metformin. The concentration selected for each inhibitor was at least 4-fold greater than the estimated IC50 value for metformin uptake by that transporter, and at least 2-fold lower than the IC50 values for other metformin transporters. At the selected inhibitor concentrations, the target transporters were inhibited by >80% with <20% inhibition of the nontarget transporters. Figure 2, E and F, depicts the chemical inhibition scheme deployed in elucidating the involvement of specific cation-selective transporters in the AP uptake of metformin in Caco-2 cell monolayers. Cell viability and monolayer integrity were not affected in any of the chemical inhibition studies presented here as measured by TEER prior to and immediately after transport studies (data not shown).
Inhibition by cimetidine (5 µM) had no effect on the AP uptake of metformin in Caco-2 cells, which eliminated the contribution of MATE1 in mediating AP uptake of metformin. Mitoxantrone (25 µM) decreased the AP uptake of metformin to 74 ± 8% (P < 0.01) of the control. Although it has been previously reported that mitoxantrone is an inhibitor of MATE1 [with either MPP+ or 4-(4-(dimethylamino)styryl)-N-methylpyridinium iodide as substrates] (Grottker et al., 2011; Wittwer et al., 2013), we have concluded that the ∼25% decrease in the AP uptake of metformin caused by mitoxantrone must be due to inhibition of OCT1 because cimetidine did not inhibit metformin AP uptake. Corticosterone (150 µM) inhibited AP uptake of metformin by ∼25%, reducing the AP uptake to 73% ± 3% (P < 0.01) of the control. The inhibitory effects of mitoxantrone on OCT1-mediated metformin uptake and of corticosterone on OCT1–3-mediated metformin uptake into Caco-2 cell monolayers were not significantly different, providing evidence that OCT2 and 3 do not contribute to the AP uptake of metformin in Caco-2 cell monolayers. Desipramine (200 µM) reduced the AP uptake of metformin by ∼65% (P < 0.001), which accounts for an additional ∼40% reduction in metformin AP uptake over the ∼25% reduction observed with corticosterone. These data suggest that PMAT also contributes to the AP uptake of metformin in Caco-2 cell monolayers to approximately the same (or greater) extent as OCT1 (Fig. 2, D and E). MPP+ (5 mM), which inhibits all transporter-mediated uptake (Koepsell et al., 2007), reduced metformin uptake by ∼80%, indicating that at least 80% of metformin AP uptake into Caco-2 cell monolayers is mediated by cation-selective transporters; the remaining 20% apparent uptake may be due to nonspecific binding of metformin to the cell surface because uptake due to passive diffusion is unlikely. A significant difference (P < 0.05) in the inhibitory effects of desipramine and MPP+ suggests that there may be another unknown transporter(s) contributing to the AP uptake of metformin in Caco-2 cell monolayers.
SERT and CHT Contribute to the AP Uptake of Metformin in Caco-2 Cell Monolayers.
To identify the unknown transporter(s) involved in the AP uptake of metformin, the affinity of metformin for SERT was evaluated because SERT is known to transport organic cations and is expressed in Caco-2 cells (Martel et al., 2003; Hilber et al., 2005; Seidel et al., 2005). Metformin uptake in SERT-HEK 293 cells showed linearity up to 2 minutes, followed by nonlinear uptake; while metformin uptake in control HEK 293 cells was significantly lower and linear up to 30 minutes (Fig. 3A). The apparent Km value for SERT-mediated metformin uptake was estimated at 4 mM (Fig. 3B).
Fig. 3.

SERT is a metformin transporter and contributes to the AP uptake of metformin in Caco-2 cell monolayers. (A) Uptake of metformin (1 µM) as a function of time in SERT- transfected HEK 293 cells (closed symbols) and HEK 293 control cells (open symbols). (B) Uptake of metformin (2 minutes) as a function of concentration in SERT-HEK 293 cells, corrected for surface binding and uptake of metformin in control HEK 293 cells. A Michaelis-Menten equation with one saturable component was fit to the corrected uptake rate data and the estimated Km and Vmax values are presented. (C) Inhibition curves depicting metformin uptake (10 µM, 5 minutes) by OCTs and SERT in the presence of paroxetine. (D) Modified chemical inhibition scheme to determine the contributions of OCT1, PMAT, and SERT to metformin uptake into Caco-2 cell monolayers. (E) Inhibition of metformin AP uptake (10 µM, 5 minutes) in the presence of inhibitors considered in (D). Data represent mean ± S.D., n = 3. *P < 0.05, **P < 0.01, ***P < 0.001 compared with the control; #P < 0.05 compared with each other.
Paroxetine, a selective serotonin reuptake inhibitor with a reported Ki for SERT of 0.8 nM (Owens et al., 1997), inhibited OCT1-, 2-, 3-, and SERT-mediated metformin uptake in single transporter-expressing cell systems with IC50 values of 1.0 ± 0.2 µM, 11.9 ± 1.2 µM, 6.4 ± 1.3 µM, and 6.0 ± 0.6 nM, respectively. Hence, a paroxetine concentration of 0.1 µM was used to selectively inhibit SERT, without inhibiting OCTs (Table 1).
The contribution of SERT to metformin AP uptake in Caco-2 cell monolayers was evaluated using chemical inhibitors at concentrations outlined in the modified chemical inhibition scheme (Fig. 3D) with the results presented in Fig. 3E. The estimated IC50 value for inhibition of metformin uptake into SERT-expressing cells by mitoxantrone was 977.2 ± 1.2 µM (Supplemental Fig. 2; Table 1); therefore, we can conclude that mitoxantrone at 25 µM inhibited only OCT1 and did not significantly inhibit SERT. The selective inhibitor of SERT, paroxetine, decreased metformin AP uptake into Caco-2 cell monolayers by ∼20%. Because desipramine also inhibits SERT with a Ki value of 54 ± 4.2 nM (Barker et al., 1994), ∼65% decrease in metformin AP uptake by desipramine likely includes inhibition of SERT in addition to the inhibition of OCT1 and PMAT. Thus, 65% inhibition of metformin uptake by desipramine would suggest OCT1, PMAT, and SERT contribute ∼25, ∼20, and ∼20%, respectively, to metformin AP uptake.
To account for ∼15% remaining transporter-mediated uptake of metformin, the choline transporter system, which includes CHT and CTL1–5, was considered as a possible candidate. Studies have shown that a selective CHT inhibitor, HC3 can inhibit CHT with greater potency (IC50 = 4 nM) than CTLs (∼100 µM) (Apparsundaram et al., 2000; Lockman and Allen, 2002). To determine whether HC3 can also inhibit OCTs and SERT, the potency of HC3 for inhibition of OCTs and SERT was investigated (Fig. 4A). The IC50 values for OCT1-, 2-, 3-, and SERT-mediated metformin uptake are 112.2 ± 1.5, 131.8 ± 1.4, 524.8 ± 1.7, and 70.8 ± 1.2 µM, respectively (Table 1). Therefore, 1 µM HC3 can be used to selectively inhibit CHT-mediated metformin uptake without affecting the other transporters. In a modified chemical inhibition scheme (Fig. 4B), HC3 caused ∼15% decrease in the AP uptake of metformin relative to control cells (Fig. 4C). Desipramine and HC3 together inhibited ∼80% of the AP uptake of metformin, which was not significantly different from the inhibitory effect of 5 mM MPP+ (Fig. 4C). These results suggested the involvement of CHT, with a relative contribution of ∼15% to the AP uptake of metformin, which combined with OCT1, PMAT, and SERT, accounts for all of the transporter-mediated uptake of metformin across the AP membrane in Caco-2 cell monolayers.
Fig. 4.

Inhibition by HC3 reduced the initial AP uptake rate of metformin. (A) Inhibition of metformin uptake by HC3 into OCT1-, 2-, 3- and SERT-expressing cells. (B) Modified chemical inhibition scheme to determine the relative contribution of OCT1, PMAT, SERT, and CHT to metformin AP uptake into Caco-2 cell monolayers. (C) Inhibition of metformin AP uptake (10 µM, 5 minutes) by inhibitors considered in (B). Data represent mean ± S.D., n = 3. *P < 0.05, **P < 0.01, ***P < 0.001 compared with the control; #P < 0.05 compared with each other. (D) Chemical structures of metformin and choline. (E and F) Protein expression levels of four metformin transporters in Caco-2 cell monolayers (E), and in human intestinal tissue (F) as determined by Western blot analysis.
Protein Expression of the Four Metformin Transporters in Caco-2 Cell Monolayers and Human Intestine.
The genes of all four transporters that have a role in metformin uptake across the AP membrane of Caco-2 cell monolayers are expressed in these cells (Fig. 1). However, it is important to determine if the transporter proteins are also expressed in Caco-2 cell monolayers. Western blot analysis showed that all four transporters implicated in metformin transport, i.e., OCT1, PMAT, SERT, and CHT, are expressed in Caco-2 cells (Fig. 4E). PMAT and SERT exhibited higher protein expression levels than OCT1 and CHT (Fig. 4E). Furthermore, the analysis showed that these transporter proteins are also expressed in human jejunal tissue (Fig. 4F). The protein expression level for these transporters in human jejunal tissue was much lower than that in Caco-2 cells. As in Caco-2 cells, PMAT and SERT exhibited higher protein expression levels than OCT1, but unlike Caco-2 cells, CHT protein expression in the human jejunal tissue was barely visible (Fig. 4F).
Confirmation of PMAT Contribution to Metformin AP Uptake with a Stable PMAT-Knockdown Caco-2 Cell Construct.
Since the contribution of PMAT in the AP uptake of metformin in Caco-2 cell monolayers was derived indirectly by using a combination of inhibitors, neither of which was selective for PMAT, it was important to confirm this result using a distinctly different approach. Hence, PMAT-knockdown Caco-2 cells were created in which three clones with normal morphology and growth rate (2, 9, 24), exhibited attenuation of the PMAT mRNA expression by >70% of the control (Fig. 5A) with a corresponding reduction in the PMAT protein expression (Fig. 5B). OCT1-knockdown clones [construct 1-clone 43 (1-43), construct 3-clone 21 (3-21), and construct 3-clone 27 (3-27)] with 70% reduction in the OCT1 mRNA expression (corresponding reduction in OCT1 protein expression has been shown previously) (Han et al., 2013) (Fig. 5C) were identified and used as the positive control for the studies with PMAT-knockdown Caco-2 cells. The AP uptakes of metformin in PMAT-knockdown (Fig. 5D) and OCT1-knockdown (Fig. 5E) Caco-2 cell monolayers were ∼40 and 20%, respectively, lower than that in the corresponding wild-type cells; and this is consistent with 25% reduction in metformin AP uptake caused by mitoxantrone, an OCT1-specific transporter at the concentration employed.
Fig. 5.

Metformin AP uptake into PMAT- and OCT1-knockdown Caco-2 cells. (A–C) Expression levels of the PMAT gene (A) and protein (B) in PMAT-knockdown clones, and the OCT1 gene (C) in OCT1-knockdown clones of Caco-2 cells relative to the control (wild-type Caco-2 cells); gene expression data represent mean ± S.D., n = 3. *P < 0.05, **P < 0.01 compared with the control, and protein expression data are from n = 1. (D and E) Metformin AP uptake (10 µM, 5 minutes) into (D) PMAT- and (E) OCT1-knockdown clones relative to the control (wild-type Caco-2 cells). Data represent mean ± S.D., n = 3. *P < 0.05, **P < 0.01 compared with the control.
Discussion
Metformin is known to be a substrate for multiple transporters in the liver/kidney, and many of these transporters are likely expressed in the AP membrane in Caco-2 cell monolayers. Therefore, elucidation of the relative contribution of individual transporter(s) to metformin AP uptake required the use of a highly selective inhibitor for each transporter. Alternatively, one could use the relative activity factor method proposed by Hirano et al. (2004), using selective substrates for each transporter to estimate the contribution of transporters to uptake of drugs when multiple transporters are involved. However, these methods are often not feasible, especially for cation-selective transporters where the inhibition curves often overlap across different transporters. Therefore, a novel approach was conceived in which the use of available transporter-specific inhibitors was combined with the use of a cocktail of inhibitors with known but overlapping inhibitory potencies toward multiple transporters (depicted in Figs. 2–4).
The transporters that were initially considered are OCT1–3, OCTN2, MATE1, and PMAT (Fig. 2E). Surprisingly, uptake studies with metformin in OCTN2-expressing CHO cells revealed that metformin is not a substrate for this transporter (Supplemental Fig. 1). This finding is highly significant in that it rules out metformin transport by one of the most highly expressed AP cation-selective transporters in both Caco-2 cells and human intestine (Elimrani et al., 2003) as well as in the heart, liver, and kidney (Tamai et al., 1998; Wu et al., 1999; Hilgendorf et al., 2007). The studies with the initial inhibition scheme provided evidence that OCT1 and PMAT were involved in metformin AP uptake and ruled out OCT2, OCT3, and MATE1 (Fig. 2).
The chemical inhibition studies (Fig. 2) revealed that a significant component of carrier-mediated uptake was unaccounted for (Fig. 2F), suggesting that in addition to OCT1 and PMAT, another transporter(s) is involved in metformin AP uptake. Hence, other proteins known to transport cations were considered, and SERT was chosen for further investigation for reasons outlined subsequently. SERT is expressed in both AP and BL membranes, although expression on the AP side is predominant in the intestine and Caco-2 cell monolayers (Wade et al., 1996; Martel et al., 2003; Gill et al., 2008), and it functions as an uptake transporter (Nelson and Rudnick, 1979). The endogenous substrate of SERT is serotonin; however, SERT and other OCTs share substrates. In OCT3- and PMAT-transfected HEK 293 cells, both these transporters can mediate uptake of serotonin (Duan and Wang, 2010). Additionally, in SERT-transfected HEK 293 cells, SERT can mediate uptake of several organic cations such as tyramine, MPP+, and para-chloroamphetamine (Hilber et al., 2005). Thus, it was reasonable to consider SERT as the missing transporter in metformin AP uptake.
In this study, metformin was shown to be a substrate for SERT with an apparent Km of approximately 4 mM, which is similar to the metformin Km for OCT1 and OCT3. This is the first report of metformin being transported by SERT. A second chemical inhibition scheme was employed (Fig. 3D) in which paroxetine, a potent serotonin-selective reuptake inhibitor, was deployed. Studies with this inhibition scheme (Fig. 3) have suggested that approximately 20% of metformin uptake into Caco-2 cell monolayers is mediated by SERT. Interestingly, studies deploying the new chemical inhibition scheme (Fig. 3) did not account for a significant difference (∼15%) in the inhibition of metformin AP uptake by desipramine and MPP+, and thus left open the possibility that yet another transporter contributes to metformin AP uptake into Caco-2 cell monolayers.
We considered choline transporters in our search for the identity of the yet unknown transporter that contributes to ∼15% of metformin AP uptake into Caco-2 cell monolayers. This was because choline is a hydrophilic quaternary amine with a permanent positive charge, thus resembling metformin in key structural features (Fig. 4D) (Werner and Bell, 1921; Ing, 1949). The choline transporter system, which includes CHT and CTLs, plays a significant role in the intestinal absorption of this essential nutrient (Sanford and Smyth, 1971; Herzberg and Lerner, 1973; Kuczler et al., 1977; Kamath et al., 2003). HC3 (1 µM), a specific inhibitor of CHT (IC50 = 4 nM; Apparsundaram et al., 2000), inhibited metformin AP uptake into Caco-2 cell monolayers by ∼15% (Fig. 4), supporting a role of CHT in metformin uptake. Thus, the AP uptake of metformin in Caco-2 cell monolayers was reexamined by including HC3 in the inhibition scheme (Fig. 4). As expected, HC3 reduced metformin AP uptake by ∼15%, and a mixture of desipramine and HC3 completely abolished all carrier-mediated uptake of metformin in Caco-2 cells similar to the inhibition observed with MPP+. Direct evidence for CHT involvement in metformin transport is still lacking; however, the inhibition data in Fig. 4 strongly suggest the involvement of this transporter in metformin AP uptake into Caco-2 cell monolayers. The other choline transport proteins, CTL1–5, which are highly expressed in the intestine, are not inhibited by HC3 at 1 µM (IC50 values in the 100 µM range) (Lockman and Allen, 2002), and therefore are likely not involved in metformin AP uptake.
Of the four transporters implicated, the contribution of PMAT toward metformin AP uptake into Caco-2 cell monolayers was determined based on a process of elimination without the use of a selective inhibitor. To confirm the involvement of PMAT and the validity of our chemical inhibition scheme, stable PMAT-knockdown Caco-2 clones were generated using an established small interfering RNA sequence (Engel et al., 2004). OCT1-knockdown Caco-2 clones generated previously (Han et al., 2013) were used as a positive control. In both PMAT- and OCT1-knockdown cells, metformin AP uptake was decreased by ∼40 and ∼20%, respectively (Fig. 5, D and E). This finding, confirming the role of PMAT in metformin AP uptake, is novel in that this is the first report of PMAT expression and function in Caco-2 cell monolayers. Together, these studies corroborate chemical inhibition data that have provided evidence for the contribution of PMAT toward metformin AP uptake in Caco-2 cell monolayers.
The studies in this work show that a judicious use of a cocktail of inhibitors can elucidate the contributions of several transporters in the uptake or transport of drugs across biologic barriers, and uncover the role of previously unknown transporters in the transport of a given drug. This is the first report in which the contributions of four different transporters (OCT1, PMAT, SERT, and CHT) in metformin AP uptake into Caco-2 cell monolayers (Fig. 6) was established through a series of studies showing gene and protein expression of these transporters, metformin uptake, and inhibition of the uptake using a cocktail of uptake inhibitors. It is noteworthy that protein expression of PMAT and SERT is higher in human jejunal tissue, with lower expression of OCT1 and trace expression of CHT (Fig. 4F). Establishing the role of these transporters in Caco-2 cells, and by implication in human intestinal epithelium, is a significant finding considering that metformin has been in clinical use for decades without any recognition that its intestinal absorption may involve multiple intestinal transporters. Elucidation of the role of these transporters in the intestinal absorption of metformin after oral administration to humans will require consideration and modeling of transporter-mediated uptake (and efflux) kinetics, the expression of these transporters and varying metformin concentrations along the length of the intestine, and mechanisms that drive AP uptake and efflux of metformin by each transporter (e.g., sodium dependence for SERT, membrane potential for OCT1, etc.). This work, and future studies that will be conceived based on this work, will yield valuable insight into the mechanisms responsible for the dose-dependent and variable absorption (Noel, 1979; Tucker et al., 1981), intestinal accumulation, and associated pharmacology/adverse effects (Stepensky et al., 2002; Bailey et al., 2008) of metformin. Furthermore, these findings will lead to critical reexamination of metformin’s potential to cause intestinal drug-drug interactions. The high dose (e.g., 500–1000 mg) of metformin may affect oral absorption of coadministered cationic drugs in which absorption is dependent on transporters.
Fig. 6.

Schematic representation of the contributions of cation-selective transporters to metformin AP uptake in Caco-2 cell monolayers. OCT1, PMAT, SERT, and CHT are responsible for 25%, 20%, 20%, and 15% of the AP uptake of metformin in Caco-2 cell monolayers, respectively. Passive processes and nonspecific binding likely contribute to the remaining ∼20% of the apparent uptake measured.
Supplementary Material
Acknowledgments
The authors acknowledge the generous gift of SERT-expressing cells provided by Dr. Randy Blakely (Vanderbilt University).
Abbreviations
- AP
apical
- BL
basolateral
- CHO
Chinese hamster ovary
- CHT
choline high-affinity transporter
- CTL
choline transporter–like protein
- FBS
fetal bovine serum
- GAPDH
glyceraldehyde-3-phosphate dehydrogenase
- HC3
hemicholinium-3
- HEK 293
human embryonic kidney 293
- MATE
multidrug and toxin extrusion
- MOPS
4-morpholinepropanesulfonic acid
- MPP+
1-methyl-4-phenylpyridinium
- OCT
organic cation transporter
- OCTN
novel organic cation transporter
- PMAT
plasma membrane monoamine transporter
- SERT
serotonin reuptake transporter
- TEER
transepithelial electrical resistance
Authorship Contributions
Participated in research design: Han, Proctor, Costales, Cai, Everett, Thakker.
Conducted experiments: Han, Proctor, Costales, Cai.
Performed data analysis: Han, Proctor, Costales, Cai, Everett, Thakker.
Wrote or contributed to the writing of the manuscript: Han, Proctor, Costales, Cai, Everett, Thakker.
Footnotes
This work was supported in part by the National Institutes of Health National Institute of Diabetes and Digestive and Kidney Diseases [Grant R01-DK088097] T.H. was supported by a Predoctoral Fellowship from Johnson & Johnson and Dissertation Completion Fellowship from University of North Carolina at Chapel Hill Graduate School. W.R.P. and C.L.C. were supported by Predoctoral Fellowships from Amgen and the PhRMA Foundation.
 This article has supplemental material available at jpet.aspetjournals.org.
References
- Apparsundaram S, Ferguson SM, George AL, Jr, Blakely RD. (2000) Molecular cloning of a human, hemicholinium-3-sensitive choline transporter. Biochem Biophys Res Commun 276:862–867. [DOI] [PubMed] [Google Scholar]
- Bailey CJ, Wilcock C, Scarpello JH. (2008) Metformin and the intestine. Diabetologia 51:1552–1553. [DOI] [PubMed] [Google Scholar]
- Barker EL, Kimmel HL, Blakely RD. (1994) Chimeric human and rat serotonin transporters reveal domains involved in recognition of transporter ligands. Mol Pharmacol 46:799–807. [PubMed] [Google Scholar]
- Duan H, Wang J. (2010) Selective transport of monoamine neurotransmitters by human plasma membrane monoamine transporter and organic cation transporter 3. J Pharmacol Exp Ther 335:743–753. [DOI] [PMC free article] [PubMed] [Google Scholar]
- Elimrani I, Lahjouji K, Seidman E, Roy MJ, Mitchell GA, Qureshi I. (2003) Expression and localization of organic cation/carnitine transporter OCTN2 in Caco-2 cells. Am J Physiol Gastrointest Liver Physiol 284:G863–G871. [DOI] [PubMed] [Google Scholar]
- Engel K, Wang J. (2005) Interaction of organic cations with a newly identified plasma membrane monoamine transporter. Mol Pharmacol 68:1397–1407. [DOI] [PubMed] [Google Scholar]
- Engel K, Zhou M, Wang J. (2004) Identification and characterization of a novel monoamine transporter in the human brain. J Biol Chem 279:50042–50049. [DOI] [PubMed] [Google Scholar]
- Gill RK, Pant N, Saksena S, Singla A, Nazir TM, Vohwinkel L, Turner JR, Goldstein J, Alrefai WA, Dudeja PK. (2008) Function, expression, and characterization of the serotonin transporter in the native human intestine. Am J Physiol Gastrointest Liver Physiol 294:G254–G262. [DOI] [PMC free article] [PubMed] [Google Scholar]
- Grottker J, Rosenberger A, Burckhardt G, Hagos Y. (2011) Interaction of human multidrug and toxin extrusion 1 (MATE1) transporter with antineoplastic agents. Drug Metabol Drug Interact 26:181–189. [DOI] [PubMed] [Google Scholar]
- Han TK, Everett RS, Proctor WR, Ng CM, Costales CL, Brouwer KL, Thakker DR. (2013) Organic cation transporter 1 (OCT1/mOct1) is localized in the apical membrane of Caco-2 cell monolayers and enterocytes. Mol Pharmacol 84:182–189. [DOI] [PMC free article] [PubMed] [Google Scholar]
- Herzberg GR, Lerner J. (1973) Intestinal absorption of choline in the chick. Biochim Biophys Acta 307:234–242. [DOI] [PubMed] [Google Scholar]
- Hilber B, Scholze P, Dorostkar MM, Sandtner W, Holy M, Boehm S, Singer EA, Sitte HH. (2005) Serotonin-transporter mediated efflux: a pharmacological analysis of amphetamines and non-amphetamines. Neuropharmacology 49:811–819. [DOI] [PubMed] [Google Scholar]
- Hilgendorf C, Ahlin G, Seithel A, Artursson P, Ungell AL, Karlsson J. (2007) Expression of thirty-six drug transporter genes in human intestine, liver, kidney, and organotypic cell lines. Drug Metab Dispos 35:1333–1340. [DOI] [PubMed] [Google Scholar]
- Hirano M, Maeda K, Shitara Y, Sugiyama Y. (2004) Contribution of OATP2 (OATP1B1) and OATP8 (OATP1B3) to the hepatic uptake of pitavastatin in humans. J Pharmacol Exp Ther 311:139–146. [DOI] [PubMed] [Google Scholar]
- Holmes JL, Van Itallie CM, Rasmussen JE, Anderson JM. (2006) Claudin profiling in the mouse during postnatal intestinal development and along the gastrointestinal tract reveals complex expression patterns. Gene Expr Patterns 6:581–588. [DOI] [PubMed] [Google Scholar]
- Ing HR. (1949) The structure-action relationships to the choline group. Science 109:264–266. [DOI] [PubMed] [Google Scholar]
- Kamath AV, Darling IM, Morris ME. (2003) Choline uptake in human intestinal Caco-2 cells is carrier-mediated. J Nutr 133:2607–2611. [DOI] [PubMed] [Google Scholar]
- Karttunen P, Uusitupa M, Lamminsivu U. (1983) The pharmacokinetics of metformin: a comparison of the properties of a rapid-release and a sustained-release preparation. Int J Clin Pharmacol Ther Toxicol 21:31–36. [PubMed] [Google Scholar]
- Koepsell H, Lips K, Volk C. (2007) Polyspecific organic cation transporters: structure, function, physiological roles, and biopharmaceutical implications. Pharm Res 24:1227–1251. [DOI] [PubMed] [Google Scholar]
- Kuczler FJ, Nahrwold DL, Rose RC. (1977) Choline influx across the brush border of guinea pig jejunum. Biochim Biophys Acta 465:131–137. [DOI] [PubMed] [Google Scholar]
- Lockman PR, Allen DD. (2002) The transport of choline. Drug Dev Ind Pharm 28:749–771. [DOI] [PubMed] [Google Scholar]
- Martel F, Monteiro R, Lemos C. (2003) Uptake of serotonin at the apical and basolateral membranes of human intestinal epithelial (Caco-2) cells occurs through the neuronal serotonin transporter (SERT). J Pharmacol Exp Ther 306:355–362. [DOI] [PubMed] [Google Scholar]
- Ming X, Ju W, Wu H, Tidwell RR, Hall JE, Thakker DR. (2009) Transport of dicationic drugs pentamidine and furamidine by human organic cation transporters. Drug Metab Dispos 37:424–430. [DOI] [PubMed] [Google Scholar]
- Nelson PJ, Rudnick G. (1979) Coupling between platelet 5-hydroxytryptamine and potassium transport. J Biol Chem 254:10084–10089. [PubMed] [Google Scholar]
- Noel M. (1979) Kinetic study of normal and sustained release dosage forms of metformin in normal subjects. Res Clin Florums 1:33–44. [Google Scholar]
- Owens MJ, Morgan WN, Plott SJ, Nemeroff CB. (1997) Neurotransmitter receptor and transporter binding profile of antidepressants and their metabolites. J Pharmacol Exp Ther 283:1305–1322. [PubMed] [Google Scholar]
- Pentikäinen PJ. (1986) Bioavailability of metformin. Comparison of solution, rapidly dissolving tablet, and three sustained release products. Int J Clin Pharmacol Ther Toxicol 24:213–220. [PubMed] [Google Scholar]
- Pentikäinen PJ, Neuvonen PJ, Penttilä A. (1979) Pharmacokinetics of metformin after intravenous and oral administration to man. Eur J Clin Pharmacol 16:195–202. [DOI] [PubMed] [Google Scholar]
- Proctor WR, Bourdet DL, Thakker DR. (2008) Mechanisms underlying saturable intestinal absorption of metformin. Drug Metab Dispos 36:1650–1658. [DOI] [PubMed] [Google Scholar]
- Qian Y, Galli A, Ramamoorthy S, Risso S, DeFelice LJ, Blakely RD. (1997) Protein kinase C activation regulates human serotonin transporters in HEK-293 cells via altered cell surface expression. J Neurosci 17:45–57. [DOI] [PMC free article] [PubMed] [Google Scholar]
- Saitoh R, Sugano K, Takata N, Tachibana T, Higashida A, Nabuchi Y, Aso Y. (2004) Correction of permeability with pore radius of tight junctions in Caco-2 monolayers improves the prediction of the dose fraction of hydrophilic drugs absorbed by humans. Pharm Res 21:749–755. [DOI] [PubMed] [Google Scholar]
- Sanford PA, Smyth DH. (1971) Intestinal transfer of choline in rat and hamster. J Physiol 215:769–788. [DOI] [PMC free article] [PubMed] [Google Scholar]
- Seidel S, Singer EA, Just H, Farhan H, Scholze P, Kudlacek O, Holy M, Koppatz K, Krivanek P, Freissmuth M, et al. (2005) Amphetamines take two to tango: an oligomer-based counter-transport model of neurotransmitter transport explores the amphetamine action. Mol Pharmacol 67:140–151. [DOI] [PubMed] [Google Scholar]
- Stepensky D, Friedman M, Raz I, Hoffman A. (2002) Pharmacokinetic-pharmacodynamic analysis of the glucose-lowering effect of metformin in diabetic rats reveals first-pass pharmacodynamic effect. Drug Metab Dispos 30:861–868. [DOI] [PubMed] [Google Scholar]
- Tamai I, Ohashi R, Nezu J, Yabuuchi H, Oku A, Shimane M, Sai Y, Tsuji A. (1998) Molecular and functional identification of sodium ion-dependent, high affinity human carnitine transporter OCTN2. J Biol Chem 273:20378–20382. [DOI] [PubMed] [Google Scholar]
- Tsuda M, Terada T, Ueba M, Sato T, Masuda S, Katsura T, Inui K. (2009) Involvement of human multidrug and toxin extrusion 1 in the drug interaction between cimetidine and metformin in renal epithelial cells. J Pharmacol Exp Ther 329:185–191. [DOI] [PubMed] [Google Scholar]
- Tucker GT, Casey C, Phillips PJ, Connor H, Ward JD, Woods HF. (1981) Metformin kinetics in healthy subjects and in patients with diabetes mellitus. Br J Clin Pharmacol 12:235–246. [DOI] [PMC free article] [PubMed] [Google Scholar]
- Wade PR, Chen J, Jaffe B, Kassem IS, Blakely RD, Gershon MD. (1996) Localization and function of a 5-HT transporter in crypt epithelia of the gastrointestinal tract. J Neurosci 16:2352–2364. [DOI] [PMC free article] [PubMed] [Google Scholar]
- Werner EA, Bell J. (1921) The preparation of methylguanidine, and of ββ-dimethylguanidine by the interaction of dicyanodiamide, and methylammonium and dimethylammonium chlorides respectively. J Chem Soc Trans 121:1790–1795. [Google Scholar]
- Wittwer MB, Zur AA, Khuri N, Kido Y, Kosaka A, Zhang X, Morrissey KM, Sali A, Huang Y, Giacomini KM. (2013) Discovery of potent, selective multidrug and toxin extrusion transporter 1 (MATE1, SLC47A1) inhibitors through prescription drug profiling and computational modeling. J Med Chem 56:781–795. [DOI] [PMC free article] [PubMed] [Google Scholar]
- Wu X, Huang W, Prasad PD, Seth P, Rajan DP, Leibach FH, Chen J, Conway SJ, Ganapathy V. (1999) Functional characteristics and tissue distribution pattern of organic cation transporter 2 (OCTN2), an organic cation/carnitine transporter. J Pharmacol Exp Ther 290:1482–1492. [PubMed] [Google Scholar]
Associated Data
This section collects any data citations, data availability statements, or supplementary materials included in this article.