Abstract
Morphine is metabolized in humans to morphine-3-glucuronide (M3G) and the pharmacologically active morphine-6-glucuronide (M6G). The hepatobiliary disposition of both metabolites relies upon multidrug resistance-associated proteins Mrp3 and Mrp2, located on the sinusoidal and canalicular membrane, respectively. Nonalcoholic steatohepatitis (NASH), the severe stage of nonalcoholic fatty liver disease, alters xenobiotic metabolizing enzyme and transporter function. The purpose of this study was to determine whether NASH contributes to the large interindividual variability and postoperative adverse events associated with morphine therapy. Male Sprague-Dawley rats were fed a control diet or a methionine- and choline-deficient diet to induce NASH. Radiolabeled morphine (2.5 mg/kg, 30 µCi/kg) was administered intravenously, and plasma and bile (0–150 or 0–240 minutes), liver and kidney, and cumulative urine were analyzed for morphine and M3G. The antinociceptive response to M6G (5 mg/kg) was assessed (0–12 hours) after direct intraperitoneal administration since rats do not produce M6G. NASH caused a net decrease in morphine concentrations in the bile and plasma and a net increase in the M3G/morphine plasma area under the concentration-time curve ratio, consistent with upregulation of UDP-glucuronosyltransferase Ugt2b1. Despite increased systemic exposure to M3G, NASH resulted in decreased biliary excretion and hepatic accumulation of M3G. This shift toward systemic retention is consistent with the mislocalization of canalicular Mrp2 and increased expression of sinusoidal Mrp3 in NASH and may correlate to increased antinociception by M6G. Increased metabolism and altered transporter regulation in NASH provide a mechanistic basis for interindividual variability in morphine disposition that may lead to opioid-related toxicity.
Introduction
Variable drug responses (VDRs) are a widespread clinical occurrence; for instance, adverse drug events occur in 1 in 20 hospital patients in the United States (Stausberg, 2014). Large interindividual variability in the expression and function of hepatic xenobiotic metabolizing enzymes and transport proteins contributes to dose-limiting toxicities of certain therapeutics (Yang et al., 2013). Understanding the mechanisms underlying this variability can help identify susceptible patient populations. Opioid-related adverse events occur in approximately 15% of postoperative patients in the clinical setting (Kessler et al., 2013) and represent a subset of VDRs that may be attenuated by considering altered function of opioid metabolizing enzymes and transporters (Fujita et al., 2010).
Nonalcoholic steatohepatitis (NASH) is the severe stage of progressive nonalcoholic fatty liver disease (NAFLD). NAFLD is characterized by fatty acid accumulation in the liver at 5% by weight and progresses to NASH with hepatocellular injury, inflammation, and fibrosis (Marra et al., 2008). Epidemiologic studies estimate the prevalence of NAFLD and NASH to be 30–40% and 5–17%, respectively, in the United States (McCullough, 2004). Beyond the histologic hallmarks of NASH, alterations in the expression and function of xenobiotic metabolizing enzymes and transporters have been described. Several cytochromes P450, UDP-glucuronosyltransferases (UGTs), sulfotransferases, and glutathione-S-transferases have shown altered mRNA and protein expression and, in some cases, function (Fisher et al., 2009; Hardwick et al., 2010, 2013). A comprehensive transcriptomic analysis of human NASH revealed a global downregulation of uptake transporters, and an investigation into ATP-binding cassette transport proteins revealed increased expression of many efflux transporters (Hardwick et al., 2011; Lake et al., 2011). However, despite increased expression, multidrug resistance-associated protein MRP2 was improperly localized in human NASH liver samples, potentially reducing function.
MRP2 is a biliary efflux transporter that shuttles xenobiotic conjugates into the bile (Keppler et al., 1997), which may be disrupted during the development of cholestasis (Mottino et al., 2002). MRP2 shares substrate specificity with MRP3, a sinusoidal efflux transporter with increased expression in NASH (Hardwick et al., 2011). A recent study showed that the MRP2/MRP3 substrate ezetimibe exhibits decreased biliary excretion and increased plasma retention in a rodent model of NASH (Hardwick et al., 2012). Although ezetimibe is relatively safe with minimal dose-limiting toxicity, this observation indicates that NASH patients taking other drugs that use the MRP2/MRP3 system for hepatobiliary disposition may be at risk for increased and prolonged systemic drug exposure.
Morphine, a potent opioid receptor agonist, is used extensively in the clinic to treat intense and prolonged pain. Morphine is metabolized in humans by UGT2B7 to the abundant metabolites morphine-3-glucuronide (M3G) and morphine-6-glucuronide (M6G) (Chen et al., 1991; Coffman et al., 1997). Despite similar structures, these metabolites have differing pharmacologic properties. M3G, the more abundant metabolite, has been shown to be antagonistic against the pharmacologic activities of morphine (Smith et al., 1990; Handal et al., 2007). M6G, although less abundant, is pharmacologically active and is responsible for the majority of the therapeutic benefit of morphine (Osborne et al., 1992). Studying M6G activity in rodents is complicated, because although morphine is metabolized to both glucuronides by human UGT2B7, rodent Ugt2b1 metabolizes morphine exclusively to M3G (Kuo et al., 1991; Salem and Hope, 1997; Hasegawa et al., 2009). Nevertheless, hepatic-derived M3G and exogenously administered M6G are substrates for human and rodent MRP2/Mrp2 and MRP3/Mrp3, which are responsible for their hepatobiliary disposition (Zelcer et al., 2005; van de Wetering et al., 2007; Hasegawa et al., 2010). Biliary excretion, representing up to 20% of morphine glucuronide clearance (Garrett and Jackson, 1979; Ouellet and Pollack, 1995), is mediated by Mrp2. Previous studies examined the pharmacokinetics of M3G in rats with streptozotocin-induced diabetes and bile duct ligation–induced cholestasis (Hasegawa et al., 2009, 2010). Both disease states altered the expression of Ugt2b1, Mrp3, and Mrp2 and negatively affected the biliary excretion of M3G. Furthermore, Mrp3−/− mice show decreased M6G-induced antinociception compared with wild-type mice, due to increased biliary excretion (Zelcer et al., 2005). Variations that alter the M6G/morphine ratio could have substantial pharmacodynamic consequences (Murthy et al., 2002).
Given the functional alterations of Mrp2 and Mrp3 observed previously in rodent models of NASH, it was hypothesized that NASH would result in decreased biliary excretion of hepatic-generated M3G and exogenously administered M6G, leading to a perturbation in systemic M6G exposure and subsequent increase in the analgesic effect of M6G. This study aimed to examine the pharmacokinetics of morphine and M3G in a rodent model of NASH, provide a mechanistic basis for these alterations, and determine the corresponding analgesic effect of altered M6G disposition. Comparison of the morphine/M3G pharmacokinetic and M6G effect profiles observed in NASH models may provide a mechanistic understanding and prediction of response in patients with NASH.
Materials and Methods
Morphine sulfate salt pentahydrate and urethane were purchased from Sigma-Aldrich (St. Louis, MO). Morphine-6-β-d-glucuronide was purchased from Lipomed, Inc. (Cambridge, MA). Morphine [N-methyl-3H] was purchased from American Radiolabeled Chemicals (St. Louis, MO). TLC Silica Gel 60 F254 plates were purchased from EMD Millipore (Billerica, MA). UltimaGold, Solvable, and InstaGel Plus scintillation cocktails were purchased from PerkinElmer (Waltham, MA). n-Butanol and glacial acetic acid were purchased from Alfa Aesar (Ward Hill, MA) and Amresco (Solon, OH), respectively.
Animals.
Male Sprague-Dawley rats weighing 200–250 g were obtained from Harlan (Indianapolis, IN). Animals were acclimated in 12-hour light/dark cycles in a University of Arizona Association for Assessment and Accreditation of Laboratory Animal Care–certified animal facility for at least 1 week before experiments and were allowed water and standard chow ad libitum. Handling, care, maintenance, and testing of the animals were in accordance with the policies and recommendations of the International Association for the Study of Pain and the National Institutes of Health guidelines for the handling and use of laboratory animals. The experimental protocol was approved by the Institutional Animal Care and Use Committee at the University of Arizona. Rats were fed either a control diet with methionine and choline or a methionine- and choline-deficient (MCD) diet (Dyets Inc., Bethlehem, PA) ad libitum for 8 weeks prior to the pharmacokinetic studies. At 7.5 weeks on the diet, rats underwent radiant heat studies; at 8 weeks on the diet, rats underwent morphine disposition studies.
M6G Antinociception.
The protocol for the measurement of thermal nociception was derived from a previously published method (Hargreaves et al., 1988). Rats (n = 6 to 7 per experimental group) were acclimated for 30 minutes in individual plexiglass stalls on tempered glass. Radiant heat (infrared = 40) was directed toward the plantar surface of their hind paw until paw withdrawal interrupted the heat source and the timer. Withdrawal latencies were measured using an automated motion detector with a maximum cutoff of 32.6 seconds to prevent tissue damage. Paw withdrawal latencies were recorded to the nearest 0.1 seconds both before M6G or vehicle administration and at t = 30, 60, 90, 120, 150, 180, 210, 240, 270, 300, 330, 360, 390, 420, 450, 480, 540, 600, 660, and 720 minutes after intraperitoneal injection of either saline (vehicle) or M6G (5 mg/kg).
Morphine and M3G Disposition.
Rats were anesthetized with an intraperitoneal bolus dose of urethane (1 g/kg). The disposition of morphine and M3G in blood and bile was assessed via cannulation surgeries of the jugular vein for drug administration, carotid artery for blood collection, and bile duct for bile collection. After a 3-minute intravenous infusion of 2.5 mg/kg morphine per 30 µCi/kg [3H]morphine, blood, bile, and urine were collected for 150 minutes, followed immediately with terminal liver and kidney collection. Plasma morphine and M3G concentrations over a longer time period were assessed by cannulation of the femoral vein for drug administration and the femoral artery for blood collection. After a 3-minute intravenous infusion of 2.5 mg/kg morphine per 30 µCi/kg [3H]morphine, blood was collected for 240 minutes. Blood samples were centrifuged for 10 minutes at 10,000g to separate plasma from blood cells. Liver slices were prepared for histologic analysis and placed in 10% neutral-buffered formalin for at least 24 hours followed by 70% ethanol until paraffin embedding by the University of Arizona Histology Service Laboratory. The remaining tissue was snap-frozen in liquid nitrogen. All samples were stored at −80°C for later analysis.
Thin Layer Chromatography and Scintillation Counting.
Total radioactivity was determined by diluting 15 µl of plasma, bile, or urine with 5 ml UltimaGold scintillation cocktail. Liver or kidney (50 mg) was disintegrated in 500 µl Solvable for 4 hours at 60°C and mixed with 5 ml UltimaGold. The percent contribution of morphine and M3G was determined by separating the compounds in 15 µl of plasma, bile, or urine and in 40 µl of liver and kidney homogenate (50 mg tissue in 300 µl saline) supernatant on silica-coated glass plates with a mobile phase of 35:3:10 n-butanol/acetic acid/water (Yeh, 1973). Morphine and morphine glucuronide standards were run on every plate and corresponding retention factors were scraped and counted for radioactivity (Rf morphine = 0.2, Rf M3G = 0.02). Scrapings of silica gel were added to 2 ml water and incubated for 3 hours at 40°C prior to dissolution in 5 ml InstaGel Plus. All samples were counted as disintegrations per minute of tritium using a Beckman LS6500 scintillation counter (Beckman Coulter, Inc., Brea, CA) and converted to concentrations using the specific activity of the compound and the molar mass and percent contribution of either morphine or M3G. The pharmacokinetics of morphine and M3G were determined via noncompartmental analysis using Phoenix WinNonlin (version 6.3; Certara, St. Louis, MO).
Protein Preparations.
Whole-cell lysate preparations of rat liver tissue were prepared from 300 mg tissue homogenized in NP40 buffer [20 mM Tris-HCl, 137 mM NaCl, 10% glycerol, 1% Nonidet P-40, and 2 mM EDTA with 1 Protease Inhibitor Cocktail Tablet (Roche, Indianapolis, IN) per 25 ml] at 4°C. Homogenized tissue was agitated at 4°C for 2 hours and centrifuged at 10,000g for 30 minutes, and the supernatant was transferred to a clean collection tube. Protein concentrations were determined using the Pierce BCA Protein Quantitation Assay (Thermo Fisher Scientific, Waltham, MA) per the manufacturer’s recommendations.
Immunoblot Protein Analysis.
Whole-cell liver lysate (50 µg) was separated by SDS-PAGE on 7.5% polyacrylamide gels, and the proteins were transferred to nitrocellulose (Mrp3) or polyvinylidene difluoride (Ugt2b) membranes, followed by blocking of nonspecific sites with 5% nonfat dry milk in Tris-buffered saline/Tween 20. The primary antibodies (Santa Cruz Biotechnology, Inc., Dallas, TX) sc-5775 (Mrp3) or sc23479 (Ugt2b) were diluted to 1:500 in blocking solution. Relative protein expression was determined using image processing and analysis with ImageJ software (National Institutes of Health, Bethesda, MD) and normalized to the housekeeping protein Erk (Sc-93 and sc-154; Santa Cruz Biotechnology, Inc.).
RNA Purification.
Total RNA was extracted from rat liver using RNAzol B reagent (Tel-Test, Inc., Friendswood, TX) per the manufacturer’s protocol. RNA concentrations were determined using a NanoDrop 2000 UV-visible spectrophotometer (Thermo Fisher Scientific). RNA integrity was confirmed by ethidium bromide staining after agarose gel electrophoresis.
Branched-Chain DNA Analysis.
RNA (10 µg) was allowed to hybridize to specific oligonucleotide probes for Ugt2b1 diluted in lysis buffer overnight at 53°C in a 96-well plate format with signal amplification steps occurring the following day. Substrate solution, lysis buffer, capture hybridization buffer, amplifier, and label probe used for the assay were obtained from the Quantigene Discovery Kit (Affymetrix, Santa Clara, CA). Luminescence was measured with a Quantiplex 320 bDNA Luminometer interfaced with Quantiplex Data Management Software (version 5.02; Bayer, Walpole, MA). A background reading from a well consisting of all reagents except RNA was subtracted from sample readings to determine expression above background level.
Immunohistochemistry.
Immunohistochemical staining for Mrp2 was performed on formalin-fixed, paraffin-embedded samples. Liver sections were deparaffinized in xylene and rehydrated in ethanol, followed by antigen retrieval with Tris-EDTA buffer, pH 9.0. Endogenous peroxidase activity was blocked with 0.3% (v/v) hydrogen peroxide in methanol for 20 minutes. Mrp2 staining was performed by incubation with the M2III-5 clone (1:80) (Kamiya Biomedical, Seattle, WA) for 2 days at 20°C followed by the MACH3 staining kit (Biocare Medical, Concord, CA) per the manufacturer’s protocol.
Statistical Analysis.
Statistical comparisons between control and MCD groups were made using an unpaired two-way t test in GraphPad Prism software (version 5.0; GraphPad Software Inc., La Jolla, CA). Significance levels of P ≤ 0.05, P ≤ 0.01, and P ≤ 0.001 were determined.
Results
Effect of MCD Diet–Induced NASH on Morphine and M3G Disposition.
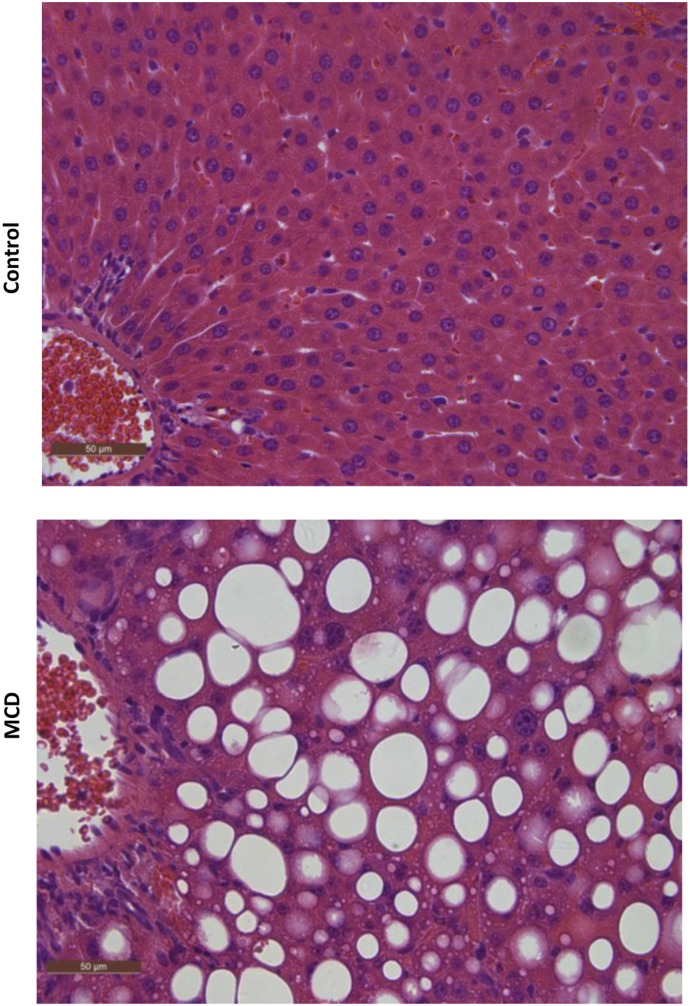
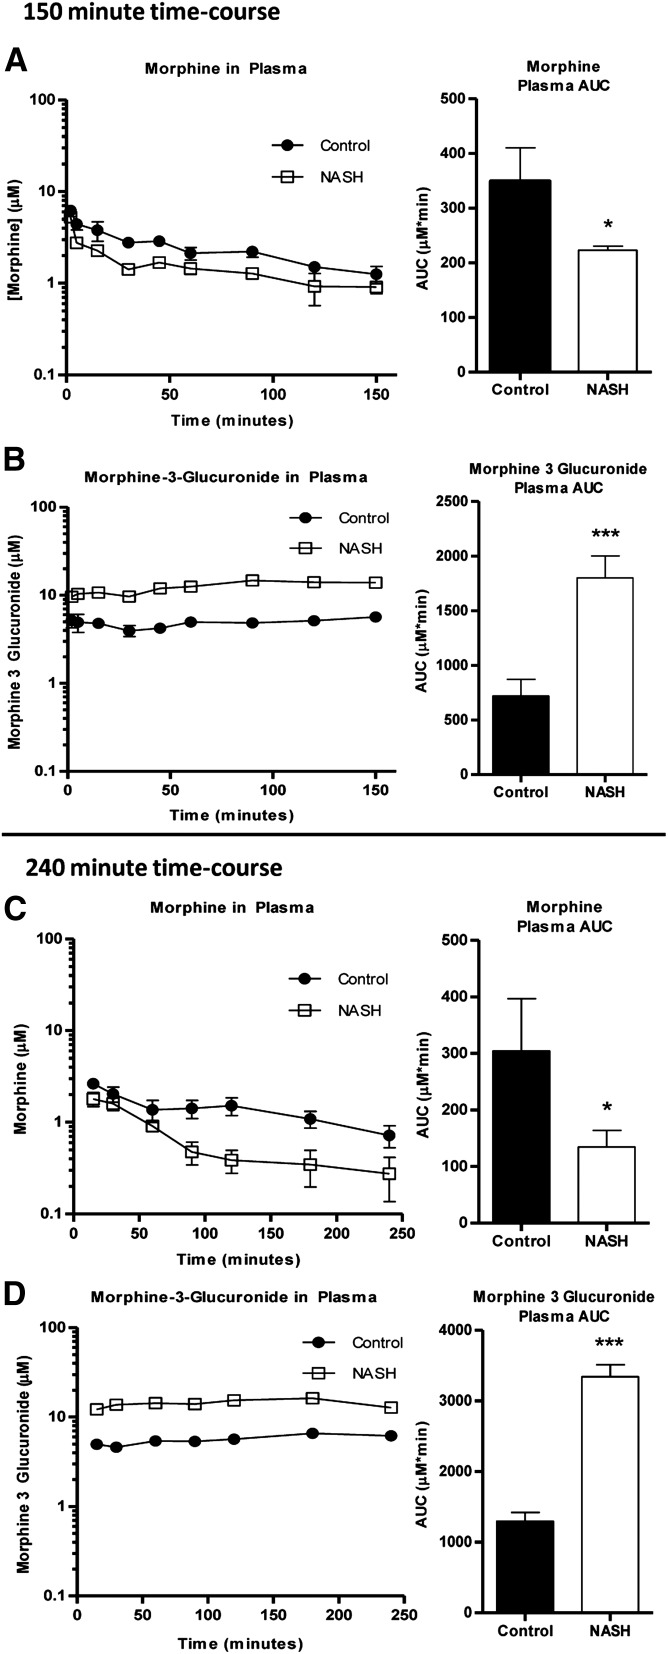
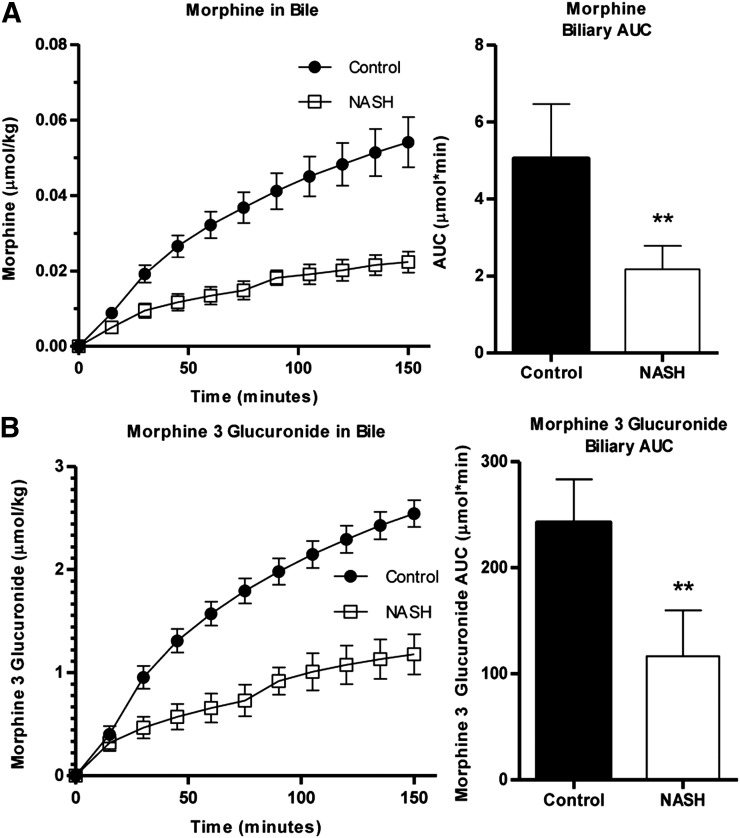
Histologic evaluation of hematoxylin and eosin–stained liver sections was performed under light microscopy at 40× magnification (Fig. 1). Rats that received the 8-week MCD diet exhibited NASH hallmarks, including steatosis, inflammation, and fibrosis, consistent with previous reports wherein this model was scored by a trained pathologist using a validated NASH scoring system (Kleiner et al., 2005; Canet et al., 2014) and identified as histologically similar to human NASH (George et al., 2003). The effect of NASH on morphine and M3G disposition after intravenous administration of morphine was examined over 150 minutes. Relative to control rats, morphine systemic exposure, assessed by the plasma area under the concentration-time curve (AUC) decreased in NASH rats to 74% of control (Fig. 2A), and M3G exposure increased to 150% of control (Fig. 2B). Similar trends were observed with the longer time course (0–240 minutes): morphine AUC decreased in NASH rats to 45% of control (Fig. 2C) and M3G increased to roughly 150% of control (Fig. 2D). The terminal phases of both the morphine and M3G concentration-time profiles from both time courses were not sufficiently captured to recover accurate estimates of terminal elimination half-life (morphine, M3G), systemic clearance (morphine), and steady-state volume of distribution (morphine). The areas under the biliary excretion-time curves for morphine and M3G decreased to 45 and 48% of control, respectively, and biliary clearance of morphine decreased from 70 ± 14 to 25 ± 9.0 µl/min (Fig. 3).
Fig. 1.
Liver histopathology of MCD diet–induced NASH. Representative hematoxylin and eosin–stained liver sections of control rats and rats fed an MCD diet for 8 weeks. MCD-fed rats demonstrated the characteristic features of NASH, including steatosis and inflammation. Rats fed control diet had healthy livers with no evidence of steatosis. Original magnification, 40×.
Fig. 2.
Effect of MCD diet–induced NASH on systemic exposures of morphine and M3G. Plasma concentration of morphine (A and C) and M3G (B and D) over 150 minutes (A and B) and 240 minutes (C and D) after intravenous administration of 2.5 mg/kg morphine to control (closed circles) and NASH (open squares) rats. Plasma AUC graphs represent means ± S.D. (n = 4–6 for each group). *P ≤ 0.05; ***P ≤ 0.001 (t test).
Fig. 3.
Biliary excretion of morphine and M3G. Cumulative biliary excretion of morphine (A) and M3G (B) in the bile was measured over 150 minutes after intravenous administration of 2.5 mg/kg morphine to control (closed circles) and NASH (open squares) rats. Bile AUC graphs represent means ± S.D. (n = 5 for each group). **P ≤ 0.01 (t test).
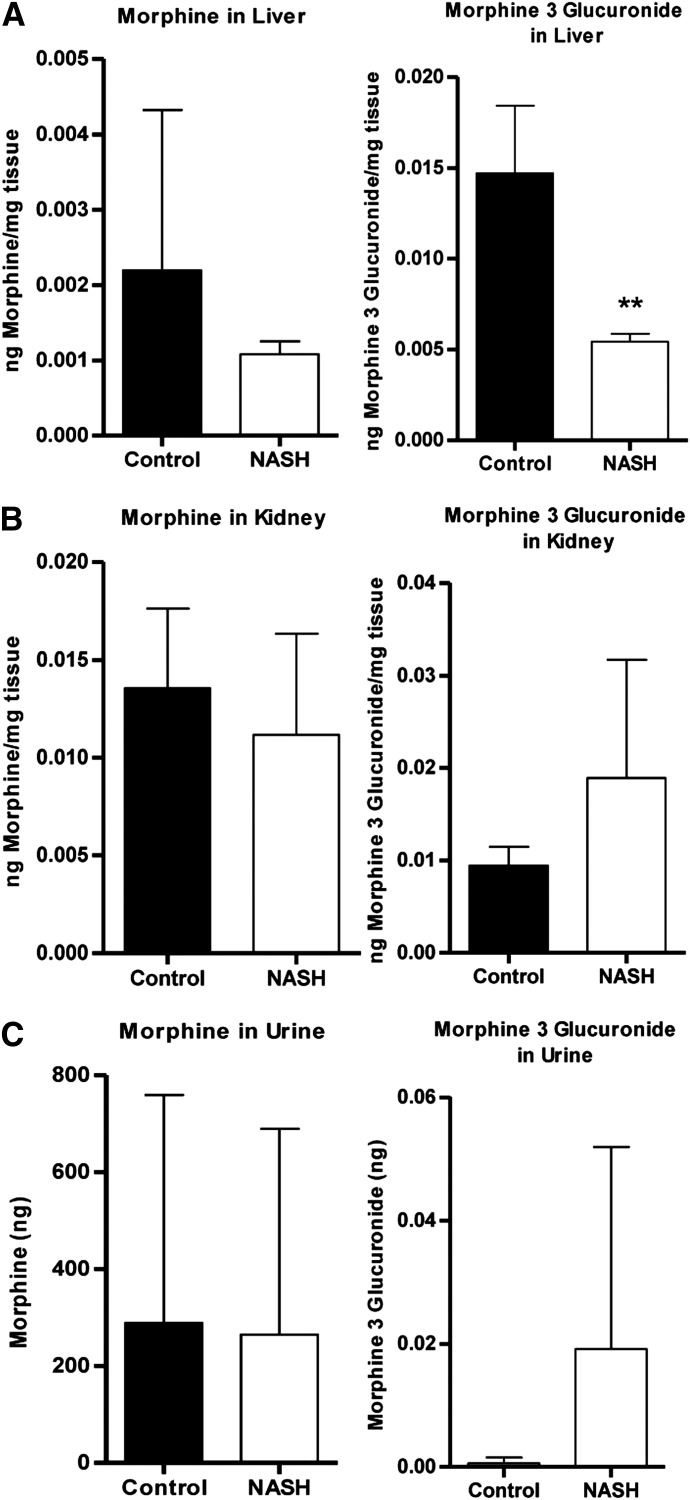
Hepatic and renal morphine concentrations (Fig. 4, A and B, left panels) and the amount of morphine excreted unchanged into the urine (Fig. 4C, left panel) were not different between groups. Hepatic M3G concentration decreased to 37% of control (Fig. 4A, right panel). Urinary M3G excretion reflected renal M3G concentrations, as evidenced by an apparent increase in NASH rats that did not reach significance (Fig. 4, B and C, right panels).
Fig. 4.
Hepatic, renal, and urinary levels of morphine and M3G. Levels of morphine (left) and M3G (right) in terminal liver (A) and kidney (B) and cumulative urine (C) were determined after intravenous administration of 2.5 mg/kg morphine to control and NASH rats. Graphs represent means ± S.D. **P ≤ 0.01 (t test).
Effect of MCD Diet–Induced NASH on Mrp3 and Mrp2.
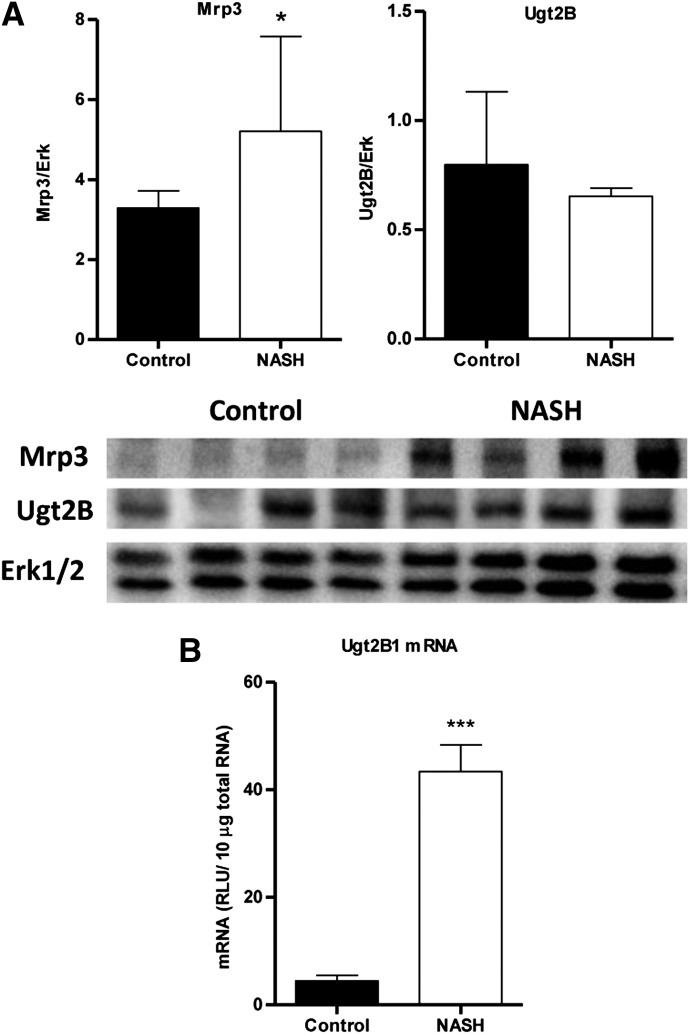
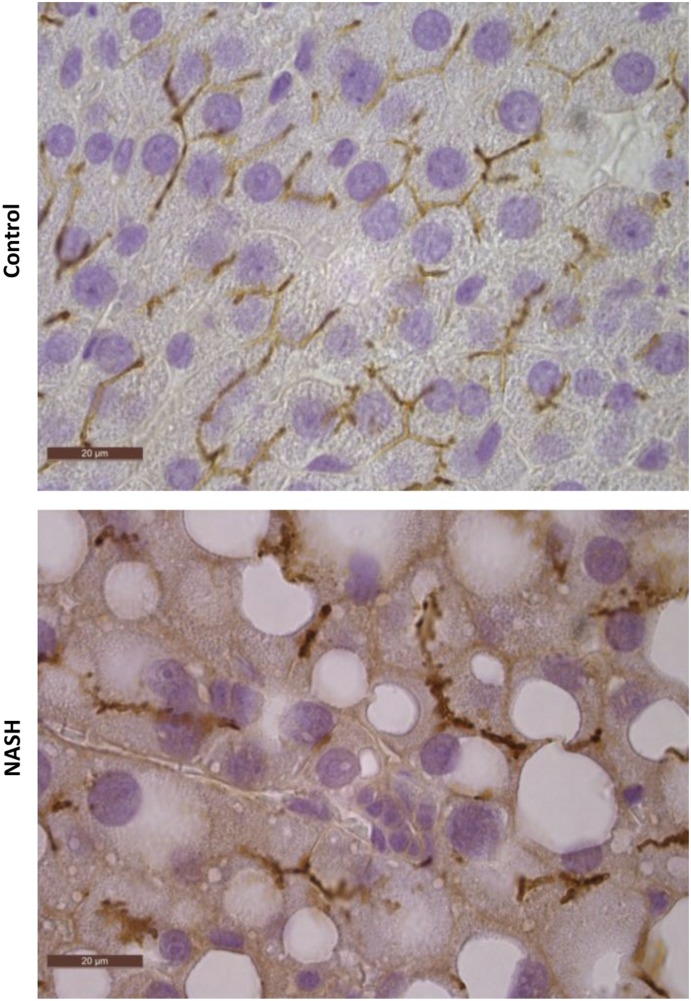
Relative protein levels of Mrp3 were analyzed by immunoblotting with a representative image and densitometric analysis shown in Fig. 5A. Mrp3 in NASH rats increased to almost 160% of control. Representative images of immunohistochemical staining of Mrp2 in control and NASH formalin-fixed paraffin-embedded liver samples are shown in Fig. 6 at 100× magnification. Staining of Mrp2 in control liver indicated proper localization to the canalicular membrane, whereas Mrp2 staining in the NASH liver appeared to pocket inward, suggesting that this efflux transporter is improperly localized in the disease model.
Fig. 5.
MCD diet–induced NASH alterations in Mrp3 and Ugt2b. (A) Relative protein levels of Mrp3 (left) and Ugt2b (right) expression in control and NASH rats were assessed by immunoblot analysis and normalized to total Erk1 and Erk2. (B) Relative mRNA expression of rat Ugt2b1 was measured by branched-chain DNA analysis. Graphs represent means ± S.D. (n = 10). *P ≤ 0.05; ***P ≤ 0.001 (t test).
Fig. 6.
MCD diet–induced NASH altered localization of Mrp2. Immunohistochemical staining of Mrp2 in formalin-fixed paraffin-embedded control and MCD rat liver samples is shown. Original magnification, 100×.
Morphine Metabolism in MCD Diet–Induced NASH.
Relative protein expression of the Ugt2b subfamily, which includes Ugt2b1, the isoform responsible for converting morphine to M3G, was assessed by immunoblot analysis with a representative image and densitometric analysis shown in Fig. 5A. In general, overall Ugt2b protein levels appeared unaltered in NASH rats. Branched-chain DNA analysis revealed an upregulation of Ugt2b1 mRNA in NASH rats to 800% of control (Fig. 5B). The metabolite/parent plasma AUC ratios for both time courses were higher in NASH rats to ≥ 300% of control (data not shown).
M6G-Induced Antinociception in MCD Diet–Induced NASH.
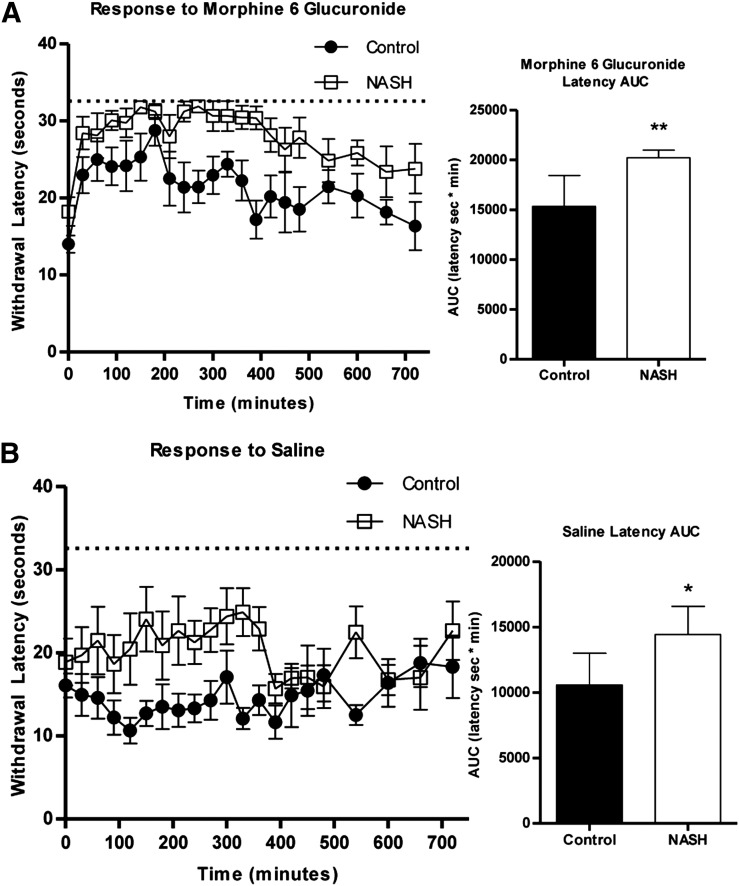
Control and NASH rats were administered M6G (n = 7) or vehicle (saline, n = 6) intraperitoneally and monitored for 12 hours for antinociceptive response to radiant heat to the hind paw. NASH rats administered M6G showed a significantly delayed response to stimuli (Fig. 7A). Vehicle-treated control rats did not demonstrate an increase in withdrawal latency times from baseline; however, vehicle-treated NASH rats maintained a significantly increased delay in stimuli response compared with control rats (Fig. 7B). NASH rats showed an apparent increase in baseline withdrawal latency relative to control rats that did not reach significance (P = 0.0518, t test).
Fig. 7.
Analgesic effects of exogenous M6G in MCD diet–induced NASH. Control (closed circles) or NASH (open squares) rats were administered either 5 mg/kg M6G (A) or volume-matched saline (B) and were monitored for withdrawal latency every 30 minutes for 720 minutes. The AUC data represent means ± S.D. (n = 6 to 7 per group). *P ≤ 0.05; **P ≤ 0.01 (t test).
Discussion
Examination of postoperative pain management programs indicates that nearly 100% of patients are treated with opioids; of these patients, 15% experience opioid-related adverse events (Kessler et al., 2013). More concerning is that although opioids are becoming less common, they continue to be prescribed for outpatient management of chronic pain, a setting that is less likely to be extensively monitored and represents a higher risk for mortality (Labianca et al., 2012). Obesity, a condition closely linked with NAFLD (McCullough, 2011), is one identified risk factor for these toxicities. NASH, the later stage of NAFLD, is characterized not only by histopathologic consequences but also by alterations in the expression and function of vital phase I and II drug metabolizing enzymes and transport proteins (Fisher et al., 2009; Hardwick et al., 2010, 2013; Lake et al., 2011). Previous studies have confirmed corresponding shifts in the disposition of certain xenobiotics in rodent models of NASH (Canet et al., 2012; Hardwick et al., 2012; Clarke et al., 2014), which may also alter the toxicodynamic profile (Hardwick et al., 2014) and contribute to VDRs derived from a number of therapeutics.
Morphine, one of the most commonly prescribed opioids, is metabolized extensively in humans by UGT2B7 to the major metabolite M3G (Smith et al., 1990; Coffman et al., 1997) and the minor, pharmacologically active metabolite M6G (Osborne et al., 1992; Coffman et al., 1997; Murthy et al., 2002). Although M3G lacks analgesic activity, it has been shown to target other pathways, such as the Toll-like receptor 4 pathway, to elicit neuroexcitatory effects (Due et al., 2012). Despite differing pharmacologic properties, the pharmacokinetic properties of these metabolites are comparable (Handal et al., 2002). Morphine glucuronidation in rodents differs from that by human UGT2B7, in that it is mediated by Ugt2b1, which predominantly produces M3G, whereas M6G formation is negligible (Kuo et al., 1991). Morphine and M3G disposition were compared between control and NASH rats assuming similar pharmacokinetic profiles between hepatically derived M3G and exogenously administered M6G.
This study aimed to examine NASH as a contributing factor to the interindividual variability in morphine and corresponding glucuronide metabolite disposition using an established rat model of NASH. The MCD diet has an accelerated rate of NASH development compared with the chronic human condition and does not recapitulate the common human comorbidities of obesity, insulin resistance, and diabetes. Nevertheless, for the purposes of drug disposition studies, the MCD diet closely resembles human NASH with respect to hepatic transporter regulation (Rinella and Green, 2004; Canet et al., 2014). The MCD diet–induced NASH in this study exhibited the expected changes in liver histology and transporter regulation.
Compared with control rats, M3G in NASH rats exhibited increased plasma retention coupled with significantly reduced biliary excretion. M3G hepatobiliary disposition is dependent on canalicular MRP2/Mrp2 for biliary efflux and sinusoidal MRP3/Mrp3 for extrusion into the blood (Zelcer et al., 2005; van de Wetering et al., 2007). It was previously established that MRP3/Mrp3 protein expression is increased in human NASH (Hardwick et al., 2011) and in the rat MCD model (Hardwick et al., 2012; Canet et al., 2014), an observation that was confirmed in this study. In addition, MRP2/Mrp2 has garnered much interest due to the observation that in NASH, this transporter appears to be mislocalized (Hardwick et al., 2011, 2012), a phenomenon that also occurs in cholestasis and acute oxidative stress (Mottino et al., 2002; Sekine et al., 2006), and was confirmed in this study via immunohistochemistry. Several previous disposition studies have demonstrated a shift from biliary excretion of known MRP2/Mrp2 substrates and metabolites (Lickteig et al., 2007; Hardwick et al., 2012, 2014) to an increased systemic exposure, providing credence to the notion that MRP2/Mrp2 has diminished function in NASH. Accordingly, this study reports the altered disposition of another glucuronide, a common shared substrate for the MRP2/MRP3 system.
The decreased biliary excretion of M3G was accompanied by decreased hepatic M3G levels. Decreased morphine uptake into the liver could explain this observation but is unlikely because the liver is the primary site of glucuronidation, and morphine uptake into the liver appeared unimpaired because M3G formation was unimpaired. A more likely explanation is that diminished Mrp2 function coupled with increased Mrp3 expression coordinately shuttled M3G back into systemic circulation. This reasoning is consistent with previous investigations involving bile duct ligation–induced cholestasis and streptozotocin-induced diabetes, which identified an increased systemic retention of M3G that may be attributed to perturbed expression of hepatic Mrp2 and Mrp3 (Hasegawa et al., 2009, 2010). As further evidence for the role of Mrp2 and Mrp3 in M3G disposition, we observed significantly less M3G in the bile of NASH rats, despite the net increase in M3G levels. This net increase in M3G levels is likely due to the increased mRNA expression of Ugt2b1 in NASH rats. A previous study indicated no significant change in UGT2B7 mRNA expression in human NAFLD (Hardwick et al., 2013); therefore, we do not expect any changes in glucuronide formation in human NASH. These data clearly indicate a transporter-mediated decrease in biliary excretion and increased plasma retention of the glucuronide morphine metabolites.
Given the decreased biliary excretion of M3G, increased urinary excretion or kidney retention was expected. Renal and urinary amounts of morphine in NASH were unchanged, as expected; although M3G exhibited an apparent increase in renal and urinary amounts, these changes did not reach significance. The high variability in urinary output likely contributed to this observation. In addition, human NASH has been shown to affect glomerular filtration rates (Targher et al., 2010), which may also occur in the rat NASH model.
The pharmacokinetic aspects of this study suggest a functional consequence of altered Mrp2 localization coupled with increased Mrp3 expression, which is a shift in disposition of the shared substrate, M3G. M3G is the major metabolite, but does not contribute to analgesic activity; by contrast, M6G is responsible for the majority of morphine activity. Given similar pharmacokinetic profiles between the two metabolites (Handal et al., 2002), increased M6G exposure would have toxicodynamic consequences. Because rats do not generate M6G, exogenous M6G was administered to control and NASH rats to determine whether an increased systemic exposure correlated with an increased pharmacologic effect, assessed via antinociceptive response. This test has been used previously in an Mrp3−/− mouse model, and M6G-induced antinociception positively correlated with M3G plasma exposure (Zelcer et al., 2005). As expected, NASH rats exhibited a higher response to M6G in terms of area under the withdrawal latency curve, a measure of the time lapse between thermal stimulus and paw withdrawal. A dietary effect was also tested by administering saline instead of M6G to control and NASH rats and monitoring over the same 12-hour period. Overall latency times were lower for both groups; that is, saline had less of an effect than M6G, as expected. Nevertheless, NASH rats administered saline, although not significantly different from control at baseline, maintained a statistically significant increase in withdrawal latency times compared with control rats, independent of treatment. Given the nature of the model (an MCD system), the observation that choline deficiency alone would affect the responsiveness of these rats was not unexpected. Circulating acetylcholine levels are readily affected by dietary choline intake (Nakamura et al., 2001). Perturbations in acetylcholine levels affect memory and spatial learning performance (Fadda et al., 2000); the control rats in both treatment groups became more responsive over time, whereas the NASH rats took a longer time to associate the sensation relief with paw withdrawal. Prolonged choline deficiency has also been shown to decrease locomotor activity, which could contribute to higher latencies (Beninger et al., 1984). Even with the diet-induced effect on withdrawal latency measurements, transporter-mediated increases in the effect of M6G in NASH would lead to a larger magnitude of difference between average control and NASH withdrawal latencies. However, the NASH rats given M6G reached a ceiling effect due to the required cutoff of 32.6 seconds of radiant heat exposure. Collectively, because of the limitations of the NASH model and the assay, a pharmacodynamic consequence of altered morphine glucuronide disposition could not be determined.
In summary, this study demonstrated significantly increased morphine metabolism to M3G in a rodent model of NASH as a result of Ugt2b1 induction. Despite the increased systemic M3G exposure, biliary excretion decreased significantly due to the mislocalization and consequent decrease in function of the canalicular efflux transporter Mrp2. The induced expression of sinusoidal Mrp3 led to increased systemic M3G exposure that may also increase exposure to both M3G and active M6G in humans with NASH. These data suggest that alterations in transporter function provide a mechanistic basis for opioid-related VDRs in patients with NASH.
Abbreviations
- AUC
area under the concentration-time curve
- M3G
morphine-3-glucuronide
- M6G
morphine-6-glucuronide
- MCD
methionine and choline deficient
- MRP
multidrug resistance-associated protein
- NAFLD
nonalcoholic fatty liver disease
- NASH
nonalcoholic steatohepatitis
- UGT
UDP-glucuronosyltransferase
- VDR
variable drug response
Author Contributions
Participated in research design: Dzierlenga, Clarke, Vanderah, Paine, Cherrington.
Conducted experiments: Dzierlenga, Clarke, Hargraves.
Contributed new reagents or analytic tools: Vanderah, Paine.
Performed data analysis: Dzierlenga, Ainslie.
Wrote or contributed to the writing of the manuscript: Dzierlenga, Paine, Cherrington.
Footnotes
This research was supported by the National Institutes of Health National Institute of Environmental Health Sciences [Toxicology Training Grant T32-ES007091]; the National Institutes of Health Eunice Kennedy Shriver National Institute of Child Health and Human Development [Grant R01-HD062489]; and the National Institutes of Health National Institute of Diabetes and Digestive and Kidney Diseases [Grant R01-DK068039].
References
- Beninger RJ, Tighe SA, Jhamandas K. (1984) Effects of chronic manipulations of dietary choline on locomotor activity, discrimination learning and cortical acetylcholine release in aging adult Fisher 344 rats. Neurobiol Aging 5:29–34. [DOI] [PubMed] [Google Scholar]
- Canet MJ, Hardwick RN, Lake AD, Dzierlenga AL, Clarke JD, Cherrington NJ. (2014) Modeling human nonalcoholic steatohepatitis-associated changes in drug transporter expression using experimental rodent models. Drug Metab Dispos 42:586–595. [DOI] [PMC free article] [PubMed] [Google Scholar]
- Canet MJ, Hardwick RN, Lake AD, Kopplin MJ, Scheffer GL, Klimecki WT, Gandolfi AJ, Cherrington NJ. (2012) Altered arsenic disposition in experimental nonalcoholic fatty liver disease. Drug Metab Dispos 40:1817–1824. [DOI] [PMC free article] [PubMed] [Google Scholar]
- Chen ZR, Irvine RJ, Somogyi AA, Bochner F. (1991) Mu receptor binding of some commonly used opioids and their metabolites. Life Sci 48:2165–2171. [DOI] [PubMed] [Google Scholar]
- Clarke JD, Hardwick RN, Lake AD, Canet MJ, Cherrington NJ. (2014) Experimental nonalcoholic steatohepatitis increases exposure to simvastatin hydroxy acid by decreasing hepatic organic anion transporting polypeptide expression. J Pharmacol Exp Ther 348:452–458. [DOI] [PMC free article] [PubMed] [Google Scholar]
- Coffman BL, Rios GR, King CD, Tephly TR. (1997) Human UGT2B7 catalyzes morphine glucuronidation. Drug Metab Dispos 25:1–4. [PubMed] [Google Scholar]
- Due MR, Piekarz AD, Wilson N, Feldman P, Ripsch MS, Chavez S, Yin H, Khanna R, White FA. (2012) Neuroexcitatory effects of morphine-3-glucuronide are dependent on Toll-like receptor 4 signaling. J Neuroinflammation 9:200. [DOI] [PMC free article] [PubMed] [Google Scholar]
- Fadda F, Cocco S, Stancampiano R. (2000) Hippocampal acetylcholine release correlates with spatial learning performance in freely moving rats. Neuroreport 11:2265–2269. [DOI] [PubMed] [Google Scholar]
- Fisher CD, Lickteig AJ, Augustine LM, Ranger-Moore J, Jackson JP, Ferguson SS, Cherrington NJ. (2009) Hepatic cytochrome P450 enzyme alterations in humans with progressive stages of nonalcoholic fatty liver disease. Drug Metab Dispos 37:2087–2094. [DOI] [PMC free article] [PubMed] [Google Scholar]
- Fujita K, Ando Y, Yamamoto W, Miya T, Endo H, Sunakawa Y, Araki K, Kodama K, Nagashima F, Ichikawa W, et al. (2010) Association of UGT2B7 and ABCB1 genotypes with morphine-induced adverse drug reactions in Japanese patients with cancer. Cancer Chemother Pharmacol 65:251–258. [DOI] [PubMed] [Google Scholar]
- Garrett ER, Jackson AJ. (1979) Pharmacokinetics of morphine and its surrogates. III: Morphine and morphine 3-monoglucuronide pharmacokinetics in the dog as a function of dose. J Pharm Sci 68:753–771. [DOI] [PubMed] [Google Scholar]
- George J, Pera N, Phung N, Leclercq I, Yun Hou J, Farrell G. (2003) Lipid peroxidation, stellate cell activation and hepatic fibrogenesis in a rat model of chronic steatohepatitis. J Hepatol 39:756–764. [DOI] [PubMed] [Google Scholar]
- Handal M, Grung M, Skurtveit S, Ripel A, Mørland J. (2002) Pharmacokinetic differences of morphine and morphine-glucuronides are reflected in locomotor activity. Pharmacol Biochem Behav 73:883–892. [DOI] [PubMed] [Google Scholar]
- Handal M, Ripel A, Aasmundstad T, Skurtveit S, Mørland J. (2007) Morphine-3-glucuronide inhibits morphine induced, but enhances morphine-6-glucuronide induced locomotor activity in mice. Pharmacol Biochem Behav 86:576–586. [DOI] [PubMed] [Google Scholar]
- Hardwick RN, Clarke JD, Lake AD, Canet MJ, Anumol T, Street SM, Merrell MD, Goedken MJ, Snyder SA, Cherrington NJ. (2014) Increased susceptibility to methotrexate-induced toxicity in nonalcoholic steatohepatitis. Toxicol Sci 142:45–55. [DOI] [PMC free article] [PubMed] [Google Scholar]
- Hardwick RN, Ferreira DW, More VR, Lake AD, Lu Z, Manautou JE, Slitt AL, Cherrington NJ. (2013) Altered UDP-glucuronosyltransferase and sulfotransferase expression and function during progressive stages of human nonalcoholic fatty liver disease. Drug Metab Dispos 41:554–561. [DOI] [PMC free article] [PubMed] [Google Scholar]
- Hardwick RN, Fisher CD, Canet MJ, Lake AD, Cherrington NJ. (2010) Diversity in antioxidant response enzymes in progressive stages of human nonalcoholic fatty liver disease. Drug Metab Dispos 38:2293–2301. [DOI] [PMC free article] [PubMed] [Google Scholar]
- Hardwick RN, Fisher CD, Canet MJ, Scheffer GL, Cherrington NJ. (2011) Variations in ATP-binding cassette transporter regulation during the progression of human nonalcoholic fatty liver disease. Drug Metab Dispos 39:2395–2402. [DOI] [PMC free article] [PubMed] [Google Scholar]
- Hardwick RN, Fisher CD, Street SM, Canet MJ, Cherrington NJ. (2012) Molecular mechanism of altered ezetimibe disposition in nonalcoholic steatohepatitis. Drug Metab Dispos 40:450–460. [DOI] [PMC free article] [PubMed] [Google Scholar]
- Hargreaves K, Dubner R, Brown F, Flores C, Joris J. (1988) A new and sensitive method for measuring thermal nociception in cutaneous hyperalgesia. Pain 32:77–88. [DOI] [PubMed] [Google Scholar]
- Hasegawa Y, Kishimoto S, Shibatani N, Nomura H, Ishii Y, Onishi M, Inotsume N, Takeuchi Y, Fukushima S. (2010) The pharmacokinetics of morphine and its glucuronide conjugate in a rat model of streptozotocin-induced diabetes and the expression of MRP2, MRP3 and UGT2B1 in the liver. J Pharm Pharmacol 62:310–314. [DOI] [PubMed] [Google Scholar]
- Hasegawa Y, Kishimoto S, Takahashi H, Inotsume N, Takeuchi Y, Fukushima S. (2009) Altered expression of MRP2, MRP3 and UGT2B1 in the liver affects the disposition of morphine and its glucuronide conjugate in a rat model of cholestasis. J Pharm Pharmacol 61:1205–1210. [DOI] [PubMed] [Google Scholar]
- Keppler D, Leier I, Jedlitschky G. (1997) Transport of glutathione conjugates and glucuronides by the multidrug resistance proteins MRP1 and MRP2. Biol Chem 378:787–791. [PubMed] [Google Scholar]
- Kessler ER, Shah M, Gruschkus SK, Raju A. (2013) Cost and quality implications of opioid-based postsurgical pain control using administrative claims data from a large health system: opioid-related adverse events and their impact on clinical and economic outcomes. Pharmacotherapy 33:383–391. [DOI] [PubMed] [Google Scholar]
- Kleiner DE, Brunt EM, Van Natta M, Behling C, Contos MJ, Cummings OW, Ferrell LD, Liu YC, Torbenson MS, Unalp-Arida A, et al. Nonalcoholic Steatohepatitis Clinical Research Network (2005) Design and validation of a histological scoring system for nonalcoholic fatty liver disease. Hepatology 41:1313–1321. [DOI] [PubMed] [Google Scholar]
- Kuo CK, Hanioka N, Hoshikawa Y, Oguri K, Yoshimura H. (1991) Species difference of site-selective glucuronidation of morphine. J Pharmacobiodyn 14:187–193. [DOI] [PubMed] [Google Scholar]
- Labianca R, Sarzi-Puttini P, Zuccaro SM, Cherubino P, Vellucci R, Fornasari D. (2012) Adverse effects associated with non-opioid and opioid treatment in patients with chronic pain. Clin Drug Investig 32 (Suppl 1):53–63. [DOI] [PubMed] [Google Scholar]
- Lake AD, Novak P, Fisher CD, Jackson JP, Hardwick RN, Billheimer DD, Klimecki WT, Cherrington NJ. (2011) Analysis of global and absorption, distribution, metabolism, and elimination gene expression in the progressive stages of human nonalcoholic fatty liver disease. Drug Metab Dispos 39:1954–1960. [DOI] [PMC free article] [PubMed] [Google Scholar]
- Lickteig AJ, Fisher CD, Augustine LM, Aleksunes LM, Besselsen DG, Slitt AL, Manautou JE, Cherrington NJ. (2007) Efflux transporter expression and acetaminophen metabolite excretion are altered in rodent models of nonalcoholic fatty liver disease. Drug Metab Dispos 35:1970–1978. [DOI] [PubMed] [Google Scholar]
- Marra F, Gastaldelli A, Svegliati Baroni G, Tell G, Tiribelli C. (2008) Molecular basis and mechanisms of progression of non-alcoholic steatohepatitis. Trends Mol Med 14:72–81. [DOI] [PubMed] [Google Scholar]
- McCullough AJ. (2004) The epidemiology and risk factors of NASH, in Fatty Liver Disease: NASH and Related Disorders (Farrell GC, George P, de la M Hall P, McCullough AJ.) pp 23–37, Blackwell Publishing Ltd, Oxford, UK. [Google Scholar]
- McCullough AJ. (2011) Epidemiology of the metabolic syndrome in the USA. J Dig Dis 12:333–340. [DOI] [PubMed] [Google Scholar]
- Mottino AD, Cao J, Veggi LM, Crocenzi F, Roma MG, Vore M. (2002) Altered localization and activity of canalicular Mrp2 in estradiol-17beta-D-glucuronide-induced cholestasis. Hepatology 35:1409–1419. [DOI] [PubMed] [Google Scholar]
- Murthy BR, Pollack GM, Brouwer KLR. (2002) Contribution of morphine-6-glucuronide to antinociception following intravenous administration of morphine to healthy volunteers. J Clin Pharmacol 42:569–576. [DOI] [PubMed] [Google Scholar]
- Nakamura A, Suzuki Y, Umegaki H, Ikari H, Tajima T, Endo H, Iguchi A. (2001) Dietary restriction of choline reduces hippocampal acetylcholine release in rats: in vivo microdialysis study. Brain Res Bull 56:593–597. [DOI] [PubMed] [Google Scholar]
- Osborne R, Thompson P, Joel S, Trew D, Patel N, Slevin M. (1992) The analgesic activity of morphine-6-glucuronide. Br J Clin Pharmacol 34:130–138. [DOI] [PMC free article] [PubMed] [Google Scholar]
- Ouellet DM, Pollack GM. (1995) Biliary excretion and enterohepatic recirculation of morphine-3-glucuronide in rats. Drug Metab Dispos 23:478–484. [PubMed] [Google Scholar]
- Rinella ME, Green RM. (2004) The methionine-choline deficient dietary model of steatohepatitis does not exhibit insulin resistance. J Hepatol 40:47–51. [DOI] [PubMed] [Google Scholar]
- Salem A, Hope W. (1997) Role of morphine glucuronide metabolites in morphine dependence in the rat. Pharmacol Biochem Behav 57:801–807. [DOI] [PubMed] [Google Scholar]
- Sekine S, Ito K, Horie T. (2006) Oxidative stress and Mrp2 internalization. Free Radic Biol Med 40:2166–2174. [DOI] [PubMed] [Google Scholar]
- Smith MT, Watt JA, Cramond T. (1990) Morphine-3-glucuronide—a potent antagonist of morphine analgesia. Life Sci 47:579–585. [DOI] [PubMed] [Google Scholar]
- Stausberg J. (2014) International prevalence of adverse drug events in hospitals: an analysis of routine data from England, Germany, and the USA. BMC Health Serv Res 14:125. [DOI] [PMC free article] [PubMed] [Google Scholar]
- Targher G, Bertolini L, Rodella S, Lippi G, Zoppini G, Chonchol M. (2010) Relationship between kidney function and liver histology in subjects with nonalcoholic steatohepatitis. Clin J Am Soc Nephrol 5:2166–2171. [DOI] [PMC free article] [PubMed] [Google Scholar]
- van de Wetering K, Zelcer N, Kuil A, Feddema W, Hillebrand M, Vlaming MLH, Schinkel AH, Beijnen JH, Borst P. (2007) Multidrug resistance proteins 2 and 3 provide alternative routes for hepatic excretion of morphine-glucuronides. Mol Pharmacol 72:387–394. [DOI] [PubMed] [Google Scholar]
- Yang L, Price ET, Chang CW, Li Y, Huang Y, Guo LW, Guo Y, Kaput J, Shi L, Ning B. (2013) Gene expression variability in human hepatic drug metabolizing enzymes and transporters. PLoS ONE 8:e60368. [DOI] [PMC free article] [PubMed] [Google Scholar]
- Yeh SY. (1973) Separation and identification of morphine and its metabolites and congeners. J Pharm Sci 62:1827–1829. [DOI] [PubMed] [Google Scholar]
- Zelcer N, van de Wetering K, Hillebrand M, Sarton E, Kuil A, Wielinga PR, Tephly T, Dahan A, Beijnen JH, Borst P. (2005) Mice lacking multidrug resistance protein 3 show altered morphine pharmacokinetics and morphine-6-glucuronide antinociception. Proc Natl Acad Sci USA 102:7274–7279. [DOI] [PMC free article] [PubMed] [Google Scholar]


