Introduction
The insertion of cryopreserved homograft conduit into the pulmonary outflow tract is an effective method of relieving severe pulmonary valve dysfunction. A certain proportion of the inserted homografts undergo late degeneration resulting in progressive right ventricular outflow obstruction. When severe, this obstruction needs repeat intervention. The timing of this intervention is critical and depends on a thorough assessment of symptoms, coupled with detailed evaluation of right ventricular structure and function as well as flow dynamics in the right ventricular outflow. We report a patient who illustrates many of the issues related to management of these patients with particular reference to the use of modern imaging followed by detailed image processing.
Clinical history
A 16-year-old young man underwent open pulmonary valvotomy and insertion of transannular pericardial patch by Dr. Debakey in March 1968. He remained in good health until 2002, when he started feeling short of breath. Investigations revealed severe pulmonary regurgitation with marked dilatation of the pulmonary outflow and main pulmonary artery (MPA). The latter measured 6 cm in diameter.
In May 2004, at the age of 52 years, he underwent pulmonary valve replacement using an aortic homograft measuring 2.4 cm in diameter. This was the only homograft available at the time. Post-operatively, he made a smooth recovery and has been followed up at yearly intervals since. He remained asymptomatic, however, routine echocardiography six months after the operation showed a peak gradient of 25mmHg across the right ventricular outflow with evidence of diminution of right ventricular size and a competent pulmonary valve (homograft). The peak systolic gradient across the pulmonary outflow remained stable at 36mmHg.
The question of reoperation was raised by the patient and his referring physician. To help decide about the need and timing of such a re-intervention, the following investigations were performed in order to determine structure and flow dynamics in the right ventricle, the ventricular outflow tract and the pulmonary artery.
Structural changes
Gadolinium-enhanced magnetic resonance (MR) images were acquired using a 1.5 Tesla clinical scanner (Siemens Symphony) with a slice increment of 2.5 mm and slice thickness of 2.5 mm. Images stored in DICOM format were imported into a commercial medical image processing tool Mimics Research version 17.0 (Materialise, Leuven, Belgium) for semi-automated segmentation and reconstruction of the myocardium, blood volumes of the left and right pulmonary arteries. Measurements were made with 3-matic Research 9.0 (Materialise, Leuven, Belgium).
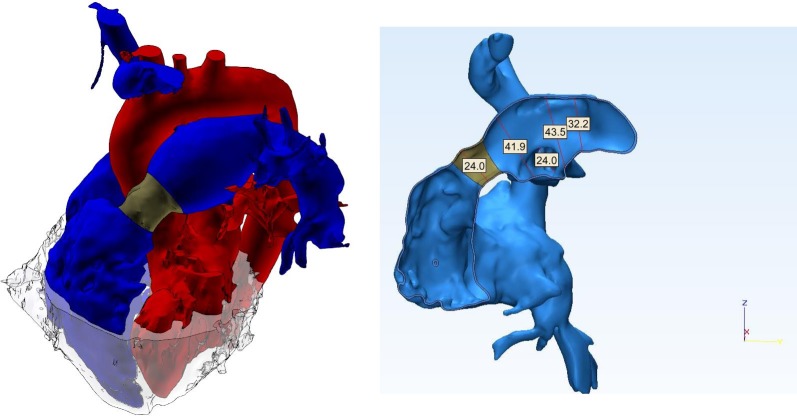
The 3D model showed slightly enlarged right ventricular (RV) cavity with good contractility. Importantly there was no evidence of RV hypertrophy, with the thickness of the free wall of the RV measuring 2 mm. The allograft valve (shown in dark grey in Figure 1) measured 2.4 cm in diameter, which was identical to the original size at insertion. The main and left pulmonary arteries were markedly dilated, measuring 4.19 cm and 4.35 cm respectively (Figure 1).
Figure 1.
3D anatomical model reconstructed from gadolinium-enhanced MR images (red: systemic circulation, blue: pulmonary circulation with the homograft shown in dark gray, light gray: myocardium). Measurements in the right panel are in mm.
Flow dynamics
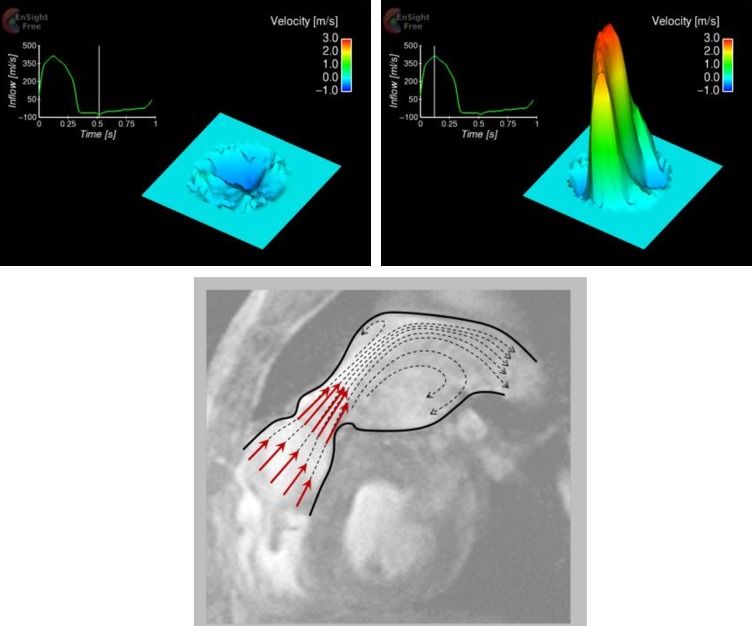
In-plane as well as through-plane, cine phase-contract MR images were acquired over the cardiac cycle in order to assess spatio-temporal flow characteristics. The in-plane images (Figure 2), encoding blood flow velocity in head-foot direction, were acquired in sagittal-oblique plane to depict the long-axis of the main pulmonary trunk with slice thickness 5 mm and encoding velocity (Venc) 3.5 m/s. The through-plane images were acquired immediately downstream to the pulmonary valve with same slice thickness and encoding velocity. The velocity map in Figure 2 illustrates a systolic jet through the homograft and regurgitation in diastole. The peak jet velocity was confirmed to be 2.87 m/s by the through-plane velocity map (Figure 3), equating to 33 mmHg of transvalvular pressure gradient. The regurgitant velocity was − 0.49 m/s. The cardiac output measured 4.55 L/min. Applying the jet shear layer detection method by Garcia et al.1 to the through-plane velocity map, effective orifice area (EOA) was also estimated to be 1.36 cm2.
Figure 2.

In-plane velocity map based on phase-contrast MR images (left: diastole, right: systole). The velocity is in head-foot direction that is the vertical direction in the figures.
Figure 3.
Through-plane velocity map immediately downstream to the pulmonary valve, based on phase-contrast MR images (top: diastole, middle: systole). The waveform superimposed in the figures were reconstructed from cine series of phase-contrast images. The velocity here represents combination of three spatial velocity components (head-foot, right-left and anterior- posterior) and hence the velocity magnitude is larger than that in Figure 2, which is only head-foot component. The diagram in the bottom panel illustrates the flow patterns in systole.
Investigating pressure recovery, energy loss (EL) and indexed energy loss coefficient (ELCi) were also calculated as 26.7 mmHg and 0.89 cm2/m2 following the equations below.2
Here, vo is the systolic peak velocity at the orifice and AMPA is the cross-sectional area of the main pulmonary trunk that was calculated from the diameter. Energy loss is in mmHg and was initially introduced to indicate the portion of the transvalvular pressure that is not recovered, in order to assess the severity of aortic stenosis. Indexed energy loss coefficient is an improved indicator which has been shown better correlated to clinical outcomes, i.e. mortality and reoperation.3–6 We refer to both parameters, former for the direct indication of the ventricular afterload and the latter as more clinically-relevant score.
The diameter of the homograft in proportion to the dilated MPA was 57% and also due to relatively small orifice area equivalent to a moderate stenosis in case of the aorta (Bonow et al.3), the flow through the homograft became a high-speed jet. The jet flowing into the dilated MPA is accompanied by flow separation and recirculation (Figure 3) which are likely cause of disturbance in the flow, resulting in a significant energy loss that was estimated 26.6 mmHg. This means that the RV of this patient is required to provide extra 26.6 mmHg of pressure to overcome energy loss and ensure perfusion of the blood to the lungs.
One of the limitations of this study is that we have used the energy loss equation for the pulmonary valve. This equation was developed and validated for the aortic valve. However, the flow characteristics through the two semilunar valves is similar. Another limitation relates to the fact that we have not studied the effect of turbulence using computational fluid dynamics. This should be explored in future studies.
Conclusions
This report illustrated the utility of multi-modality imaging analysis to fully characterize both the structural and functional changes at different times during follow-up of operations for complex heart disease. This has the potential to influence decision making regarding re-operation, and possibly optimise surgical techniques in the future.
References
- 1.Garcia J, Marrufo OR, Rodriguez AO, Larose E, Pibarot P, Kadem L. Cardiovascular magnetic resonance evaluation of aortic stenosis severity using single plane measurement of effective orifice area. J Cardiovasc Magn Reson. 2012;14:23. doi: 10.1186/1532-429X-14-23. [DOI] [PMC free article] [PubMed] [Google Scholar]
- 2.Garcia J, Pibarot P, Dumesnil JG, Sakr F, Durand LG. Assessment of aortic valve stenosis severity: A new index based on the energy loss concept. Circulation. 2000;101(7):765–771. doi: 10.1161/01.cir.101.7.765. [DOI] [PubMed] [Google Scholar]
- 3.Bonow RO, Carabello BA, Chatterjee K, de Leon AC, Faxon DP, Freed MD, Gaasch WH, Lytle BW, Nishimura RA, O'Gara PT, O'Rourke RA, Otto CM, Shah PM, Shanewise JS, Smith SC, Jacobs AK, Adams CD, Anderson JL, Antman EM, Fuster V, Halperin JL, Hiratzka LF, Hunt SA, Lytle BW, Nishimura R, Page RL, Riegel B. ACC/AHA 2006 Practice guidelines for the management of patients with valvular heart disease: Executive summary. A report of the american college of cardiology/american heart association task force on practice guidelines (writing committee to revise the 1998 guidelines for the management of patients with valvular heart disease) developed in collaboration with the society of cardiovascular anesthesiologists endorsed by the society for cardiovascular angiography and interventions and the society of thoracic surgeons. J Am Coll Cardiol. 2006;48(3):598–675. doi: 10.1016/j.jacc.2006.05.021. [DOI] [PubMed] [Google Scholar]
- 4.Levine RA, Schwammenthal E. Stenosis is in the eye of the observer: impact of pressure recovery on assessing aortic valve area. J Am Coll Cardiol. 2003;41(3):443–445. doi: 10.1016/s0735-1097(02)02765-1. [DOI] [PubMed] [Google Scholar]
- 5.Pibarot P, Garcia J, Dumesnit JG. Energy loss index in aortic stenosis: From fluid mechanics concept to clinical application. Circulation. 2013;127(10):1101–1104. doi: 10.1161/CIRCULATIONAHA.113.001130. [DOI] [PubMed] [Google Scholar]
- 6.Pibarot P, Dumesnil JG. Prosthesis-patient mismatch. Aswan Heart Cent Sci Pract Ser. 2011;7(0):2–20. [Google Scholar]


