Abstract
OBJECTIVE
Response Evaluation Criteria in Solid Tumors (RECIST) is the most widely accepted method to objectively assess response to therapy in renal cell carcinoma (RCC) treated with vascular endothelial growth factor (VEGF)–targeted therapy. Both RECIST 1.0 and 1.1 have been used to assess response to VEGF-targeted therapies; however, systematic comparisons are lacking.
MATERIALS AND METHODS
Sixty-two patients with metastatic RCC treated with VEGF-targeted therapies were retrospectively studied. Tumor measurements and response assessment according to RECIST 1.1 and RECIST 1.0 were compared, including the number of target lesions, baseline measurements, response at each follow-up, best overall response, and time to progression (TTP). Morphologic changes and new enhancement were also assessed over the course of treatment, and TTP was evaluated using morphologic change criteria in combination with RECIST 1.1.
RESULTS
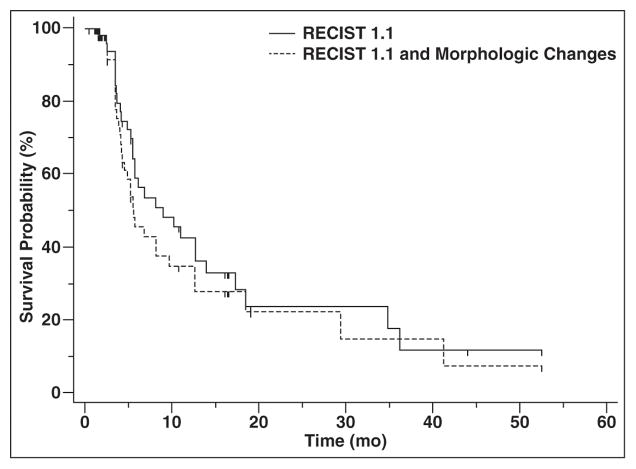
The number of target lesions according to RECIST 1.1 was significantly fewer than by RECIST 1.0 (median, 2 vs 4; p < 0.0001). At first imaging follow-up, the percentage change of the sums of the diameter measurements by RECIST 1.1 and RECIST 1.0 were highly concordant (R = 0.857; mean shrinkage, 12.1% by RECIST 1.1 vs 10.8% by RECIST 1.0). Best response assessment was highly concordant between the two criteria (weighted κ = 0.819). There was no evidence of a difference in TTP by the two criteria, with a median TTP of 8.9 months (95% CI for the median, 5.5–13.9) by RECIST 1.1 and 8.9 months (95% CI for the median, 5.8–13.6) by RECIST 1.0. The median TTP by RECIST 1.1 alone was 8.9 months compared with 5.6 months for RECIST 1.1 and morphologic changes combined.
CONCLUSION
RECIST 1.1 and RECIST 1.0 response assessments were overall highly concordant in patients with RCC treated with VEGF-targeted therapy, with fewer target lesions according to RECIST 1.1 but no difference in TTP.
Keywords: CT, renal cell carcinoma, Response Evaluation Criteria in Solid Tumors (RECIST), tumor response assessment, vascular endothelial growth factor–targeted therapy
Since the initial introduction of Response Evaluation Criteria in Solid Tumors (RECIST) in 2000, RECIST has been widely adopted and applied by the oncology and radiology communities as a means to define response to treatment in clinical trials [1]. The RECIST criteria were developed to describe objective changes in tumor size as a result of therapy and to compare the results of future therapies with current standards of care. The revised RECIST 1.1 guidelines became available in 2009, to simplify, optimize, and further standardize assessments of tumor burden [2]. Updates in RECIST 1.1 include a reduced number of total target lesions and number per organ, the inclusion of short-axis lymph node measurements in sum diameter measurements, clarification of disease progression requiring a 5-mm absolute increase in sum diameter measurements in addition to a 20% increase from the nadir sum measurement, and inclusion of 18F-FDG PET in the detection of new lesions to define progression [2, 3].
Multiple reports have examined the agreement or concordance of response assessment according to RECIST 1.1 and 1.0 in several malignancies, including lung, gastric, breast, and colon cancers and gastrointestinal stromal tumors [4–11]. In general, response assessments according to RECIST 1.1 and 1.0 in these settings have been highly concordant. A comparison of these response assessments in renal cell carcinoma (RCC) has not yet been reported to our knowledge, and this represents a unique context in which to explore potential differences in RECIST 1.1 and 1.0 evaluations. Trials of vascular endothelial growth factor (VEGF)–targeted agents, which are now standard treatment in RCC, characteristically report low objective (partial) response rates using RECIST 1.0 in the range of 10–40%, despite proven progression-free survival benefits [12–16]. Whether RECIST 1.1 assessment corresponds with RECIST 1.0 in this setting or whether version 1.1 may be able to better capture known treatment benefits remains undetermined.
Despite overall low objective response rates, ongoing clinical trials in RCC continue to use study endpoints defined by RECIST to keep or take patients off trials, lending further support to the study of RECIST 1.1 and 1.0 application in patients with RCC. Because a large number of patients with RCC receiving antiangiogenic treatment achieve a best response of stable disease by RECIST, and CT attenuation changes are known to occur in such patients over the course of treatment, several groups have sought to better characterize response and progression using alternative response criteria, such as the Choi criteria; the size, attenuation, and CT criteria; and the morphology, attenuation, size, and structure criteria [17–19]. These criteria incorporate size and CT attenuation changes into response and progression assignments; however, none of these criteria have been widely adopted or integrated into trials to date. Another point of interest to be studied is whether time to progression (TTP) calculations according to RECIST and morphologic criteria are concordant or discordant.
The purpose of this study is to determine whether response assessment according to RECIST 1.1 and 1.0 is concordant among patients with metastatic RCC treated with VEGF-targeted therapies enrolled in clinical trials. We will also determine whether TTP is equivalent using the two RECIST criteria and whether median TTP calculations are similar or discordant when evaluating patients using RECIST 1.1 and morphologic features of progression.
Materials and Methods
Patients and Treatment
The study sample consists of all patients with metastatic RCC enrolled in six recent phase 2 and 3 multicenter open-label studies of VEGF-receptor tyrosine kinase inhibitors at our institution (tivozanib, pazopanib, foretinib, sorafenib, vatalanib, and sunitinib), for whom all baseline and follow-up CT studies obtained during the trial were available. Four patients had CT examinations from 2002 that were not available and these patients were excluded. All patients had histologically confirmed metastatic RCC. Patients were imaged and treated at a single institution, at standard doses of study drug according to the assigned protocol until they experienced disease progression, severe toxicity, or withdrew consent. Compliance was checked after each cycle with a treatment diary. Patients were part of institutional review board–approved HIPAA-compliant protocols for metastatic RCC at the institution where baseline and follow-up clinical data were prospectively collected. The 62 patients studied using RECIST 1.1 and 1.0 in this report were previously described in a separate study of the association of 10% tumor shrinkage at first follow-up imaging and survival, which is different than the scope of the current study [20].
Imaging and Image Analysis
Patients eligible for analysis included those with target lesions determined by RECIST 1.0 who underwent unenhanced or contrast-enhanced CT before and after VEGF-targeted therapy initiation, with pre- and posttherapy scans at the same institution. The routine oncology protocol used a 64-MDCT scanner (Aquilion 64, Toshiba America Medical Systems) or a 4-MDCT scanner (Volume Zoom, Siemens Healthcare). Imaging parameters for the standard clinical protocol were as follows [1]: 64-MDCT scanner, 0.5-mm collimation, 120 kVp, 100–500 mA using dose modulation with noise index of 12.0 HU, 0.5-second gantry rotation time, and a table speed of 53 mm per rotation [2]; 4-MDCT scanner, 2.5-mm collimation, 120 kVp, 165 mA, 0.5-second gantry rotation time, and a table speed of 11.5-mm per rotation. Patients were instructed to maintain suspended inspiration during the CT acquisition. During the study, 75–100 mL (based on estimated glomerular filtration rate) of iopromide (Ultravist 300, 300 mg I/mL, Bayer HealthCare Pharmaceuticals) was injected IV with an automated injector (Spectris Solaris, Medrad) at a rate of 2–3 mL/s in patients with adequate estimated glomerular filtration rate and no known allergy. Scan delay for the chest was 30 seconds for 64-MDCT, 40 seconds for 4-MDCT, and 70 seconds for the abdomen. Axial images (5-mm thickness and 5-mm interval) were reconstructed using standard and lung algorithms. Coronal reformatted images (5-mm thickness and 5-mm interval) were also reconstructed for 64-MDCT. Images were reviewed and measured on a PACS (Centricity, GE Healthcare).
CT Tumor Measurements and Response Assessment
Tumor measurements were performed by an abdominal fellowship-trained oncoradiologist with 10 years’ experience in cancer imaging on baseline and follow-up studies during VEGF-targeted treatments using RECIST 1.0, and the response assessment (partial response, stable disease, and progressive disease) was assigned at each follow-up study using RECIST 1.0 [1]. All follow-up imaging studies that included target lesions were reviewed and measured. If other imaging was performed that did not include target lesions, including brain MRI, FDG PET/CT, and bone scan, the radiology reports were reviewed to determine the presence of new lesions or unequivocal progression of nontarget lesions. Subsequently, the tumor measurements using RECIST 1.0 were reviewed to generate a second set of tumor measurements according to the RECIST 1.1 guidelines, and response assessment according to RECIST 1.1 was recorded for each time point, as described elsewhere [2, 5, 8].
The number of target lesions, sum of the diameters of the target lesions, percentage change since the baseline or tumor nadir (whichever was the least preceding sum diameter), descriptions of nontarget lesions, presence or absence of new lesions, overall response for each study, best response, and TTP were recorded according to RECIST 1.0 and 1.1 [1, 2, 8]. Best response was defined as the best response recorded from the start to the end of treatment or last follow-up, according to RECIST 1.0 and 1.1.
CT Tumor Morphologic Assessment
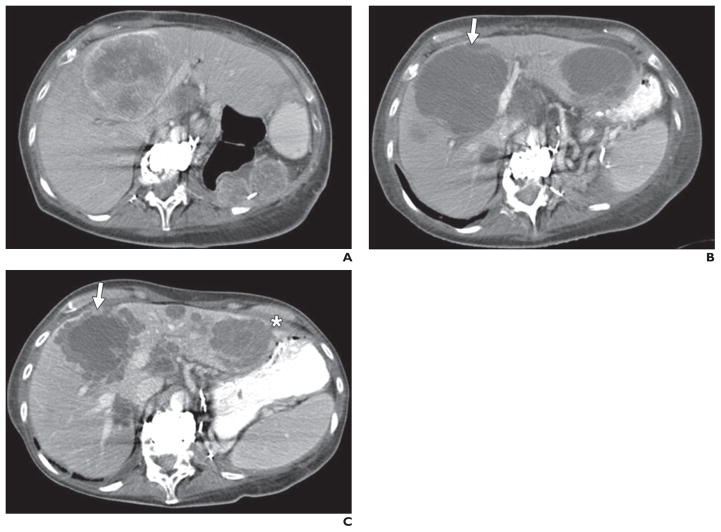
All target lesions were visually assessed for qualitative morphologic changes over the entire course of treatment. Morphologic changes of the tumor, including marked central fill-in, defined as a change from marked central necrosis in a mass to significant or nearly complete enhancement of solid tumor centrally, or new enhancement in hypodense lesions, as described in the size, attenuation, and CT criteria and the morphology, attenuation, size, and structure criteria, were recorded [18, 19]. Examples of new enhancement in previous hypodense lesions include new solid rim enhancement in previously hypodense lymph node or liver target lesions (Fig. 1), or conversion of subsolid lung nodules to solid.
Fig. 1. 63-year-old woman with metastatic renal cell carcinoma treated with sunitinib.
A, CT image obtained at baseline before treatment shows large predominantly solid enhancing central liver metastasis and left nephrectomy bed metastases.
B, CT image obtained 7 weeks after start of therapy shows mildly increased size yet marked central necrosis of central liver metastasis (arrow), now predominantly cystic in attenuation and representing favorable response according to morphology, attenuation, size, and structure criteria. Similar features are observed in left liver metastasis, not shown at baseline because of differences in slice selection.
C, CT image obtained 11 months after start of therapy shows new solid rim enhancement at periphery of central liver metastasis without significant change in size of this lesion (arrow) and similar new rim enhancement in left liver metastasis (asterisk). New solid rim enhancement represents unfavorable morphologic change assessed in this study.
Statistical Analysis
The number of target lesions by RECIST 1.1 and 1.0 and the sum diameter measurements on the baseline scan by RECIST 1.1 and 1.0 were compared using the Wilcoxon signed rank test. The baseline CT measurements by RECIST 1.1 versus 1.0 and the percentage changes of the measurements at the first follow-up scan were compared with the baseline using Spearman rank correlation. A weighted kappa analysis was performed to evaluate the agreement between RECIST 1.1 and 1.0 for best overall response and response assessment at first follow-up, using quadratic weights, as described elsewhere [8]. Agreement between two assessments was categorized as poor (κ < 0), slight (κ = 0–0.20), fair (κ = 0.21–0.40), moderate (κ = 0.41–0.60), substantial (κ = 0.61–0.80), and almost perfect (κ > 0.80) [21]. TTP according to RECIST 1.1 versus 1.0 was estimated using the Kaplan-Meier method [22]. In 25 randomly selected cases, baseline measurements were performed twice, 2 months apart, by the reader to assess intraobserver measurement variability by RECIST 1.1 and 1.0. Measurement variability was assessed using concordance correlation coefficients, and Bland-Altman plots were generated to show the mean relative difference and 95% limits of agreement (percentage) [23, 24]; p < 0.05 was considered statistically significant.
Results
Baseline Patient and Disease Characteristics
Patient and disease characteristics are reported in Table 1. Among 62 eligible patients, 44 (71%) were male. Thirty-eight patients (61%) of the cohort had clear cell RCC histology, 21 patients (34%) had papillary RCC, two patients had chromophobe subtype, and one patient had predominant sarcomatoid features in addition to having clear cell histology. The median age at targeted therapy initiation was 60.9 years.
TABLE 1.
Patient Characteristics (n = 62)
| Characteristic | Value |
|---|---|
|
| |
| Sex | |
| Female | 18 (29) |
| Male | 44 (71) |
| Age (y), median (range) | 60.9 (31.9–84.1) |
| Histologic subtype | |
| Clear cell | 38 (61) |
| Papillary | 21 (34) |
| Chromophobe | 2 (3) |
| Predominant sarcomatoid features with clear cell histology | 1 (2) |
Note—Except for age, data are number (%) of patients.
Number of Target Lesions
The number of target lesions according to RECIST 1.1 was 0–5 (mean, 2.7 lesions; median, 2 lesions; mode, 2 lesions). The number of target lesions according to RECIST 1.1 was significantly smaller than that by RECIST 1.0 (median number of target lesions: 2 by RECIST 1.1, 4 by RECIST 1.0 [range, 1–10 lesions]; Wilcoxon p < 0.0001, Fig. 2). The number of target lesions using RECIST 1.1 was lower than that using RECIST 1.0 among 43 patients; this was because of the rule of up to two target lesions per organ in 26 patients, criteria for measurability of lymph nodes in 10 patients (a lymph node must by 15 mm in short axis to be measurable in RECIST 1.1), the combination of these two reasons in six patients, and the rule of up to five lesions in total in one patient. Of note, three of the 10 patients with reduced number of target lesions because of criteria for lymph node measurability had no measurable target lesions by RECIST 1.1, which would have influenced trial eligibility for these patients.
Fig. 2.
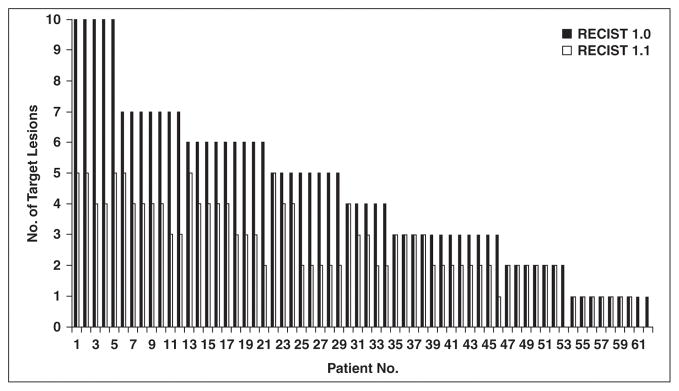
Number of target lesions according to Response Evaluation Criteria in Solid Tumors (RECIST) 1.1 versus that according to RECIST 1.0. Number of target lesions using RECIST 1.1 was significantly lower than that by RECIST 1.0 (Wilcoxon signed rank p < 0.0001).
Comparison of Baseline Measurements
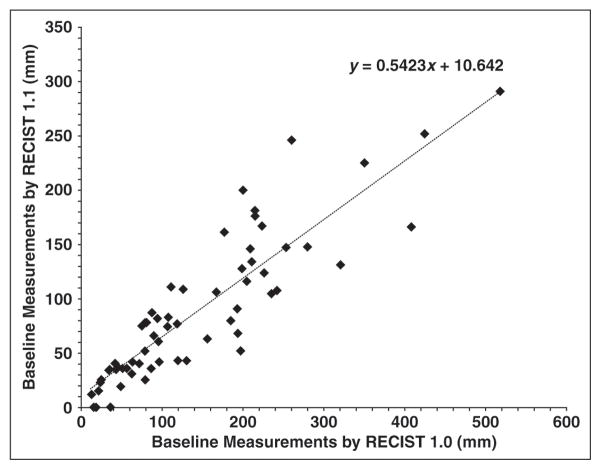
Baseline sum diameter measurements by RECIST 1.1 and RECIST 1.0 were highly concordant (Spearman correlation, R = 0.910; 95% CI, 0.855–0.945; Fig. 3). Baseline sum measurements by RECIST 1.1 were significantly smaller than those by RECIST 1.0 (p < 0.0001, Wilcoxon signed rank test), with a decrease in RECIST 1.1 measurements in 52 of 62 patients. The decrease in baseline measurements was caused by both a decreased number of target lesions and incorporation of short-axis lymph node measurements in 34 patients. A decreased number of targets alone occurred in 10 patients, three of whom had no measurable target lesions by RECIST 1.1. Incorporation of short-axis lymph node measurements alone resulted in decreased baseline measurements in eight patients.
Fig. 3.
Comparison of baseline measurements according to Response Evaluation Criteria in Solid Tumors (RECIST) 1.1 versus RECIST 1.0. High correlation was observed between sum of diameters of target lesions on baseline scans by RECIST 1.1 and 1.0 (R = 0.910).
Percentage Change and Response Assessment
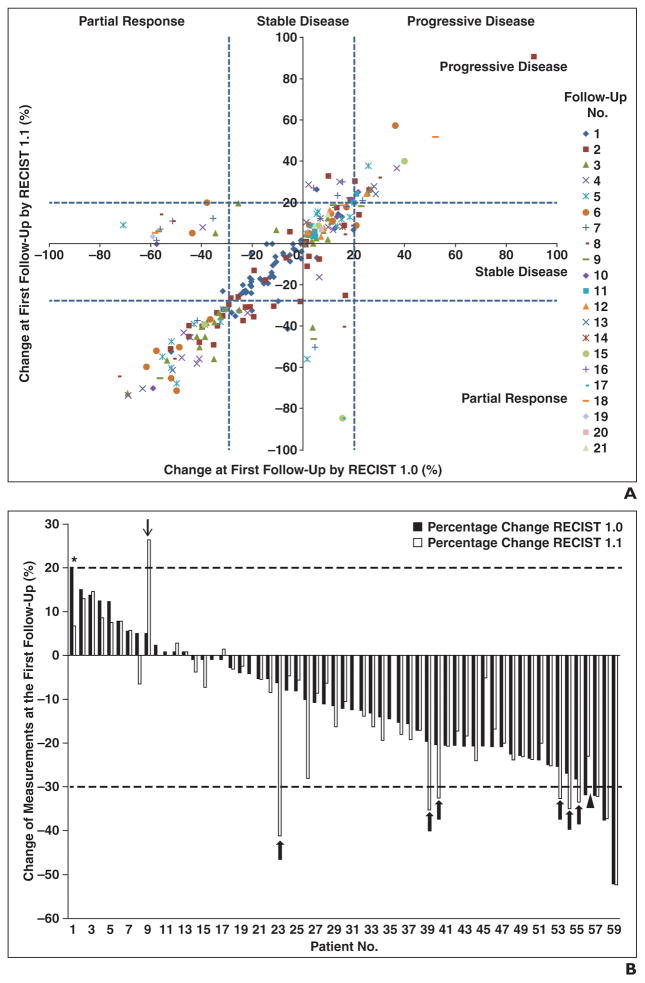
The percentage changes of the sums of the diameter measurements by RECIST 1.1 and RECIST 1.0 at each follow-up scan from the first to 21st follow-up are shown in Figure 4A. The percentage changes by two criteria at the first three follow-up examinations were highly concordant (Spearman R = 0.857 at the first follow-up [n = 59], 0.907 at the second follow-up [n = 44], and 0.804 at the third follow-up [n = 33]).
Fig. 4. Comparison of initial percentage changes in sum of diameters of target lesions according to Response Evaluation Criteria in Solid Tumors (RECIST) 1.1 versus RECIST 1.0.
A, Scatterplot of initial proportional changes of sum of diameters of target lesions by two criteria shows significant correlation (R = 0.857). Concordant observations according to RECIST 1.1 and 1.0 are in bottom left, middle, and top right boxes.
B, Initial percentage changes in sum of diameters of target lesions by two criteria in each patient (n = 59) were ranked by changes according to RECIST 1.0. Six patients were categorized as having stable disease by RECIST 1.0 and as having partial response by RECIST 1.1 (patients 23, 39, 40, 53, 54, and 55; thick arrows). One patient had partial response by RECIST 1.0 and stable disease by RECIST 1.1 (patient 56, arrowhead). One patient had progressive disease by RECIST 1.0 and stable disease by RECIST 1.1 (patient 1, asterisk). One patient had stable disease by RECIST 1.0 and progressive disease by RECIST 1.1 (patient 9, thin arrow).
The best response assessment using RECIST 1.1 was concordant with the best response using RECIST 1.0 in 53 of 59 patients (90%), with a weighted kappa value of 0.819 (Table 2). Two patients had clinically relevant differences in response categorization according to the two response criteria. One patient had stable disease as the best response by RECIST 1.1 and progressive disease by RECIST 1.0; the difference was because two target lesions by RECIST 1.0 markedly increased in size, and these were not target lesions according to RECIST 1.1 (a lymph node was a nontarget according to RECIST 1.1 because of a short-axis diameter of 12 mm at baseline; one pleural target was a nontarget according to RECIST 1.1 because there were more than two pleural mass targets at baseline). Another patient had progressive disease as the best response by RECIST 1.1 and stable disease by RECIST 1.0, in which the difference was because three lymph node targets by 1.0 only were relatively stable in size, and this diluted the influence of two increasing liver targets according to both criteria. Four patients had partial response as the best response by RECIST 1.1 and stable disease as the best by RECIST 1.0.
TABLE 2.
Best Response by Response Evaluation Criteria in Solid Tumors (RECIST) 1.1 Versus RECIST 1.0
| RECIST 1.1 | RECIST 1.0
|
Total | ||
|---|---|---|---|---|
| 1: Partial Response | 2: Stable Disease | 3: Progressive Disease | ||
|
| ||||
| 1: Partial response | 18 | 4 | 0 | 22 (37.3%) |
| 2: Stable disease | 0 | 34 | 1 | 35 (59.3%) |
| 3: Progressive disease | 0 | 1 | 1 | 2 (3.4%) |
|
| ||||
| Total | 18 (30.5%) | 39 (66.1%) | 2 (3.4%) | 59 |
Note—Data are number of patients. There was almost perfect agreement in best overall response between RECIST 1.1 and 1.0 (weighted κ = 0.819).
Time to Progression by RECIST 1.1 and RECIST 1.0
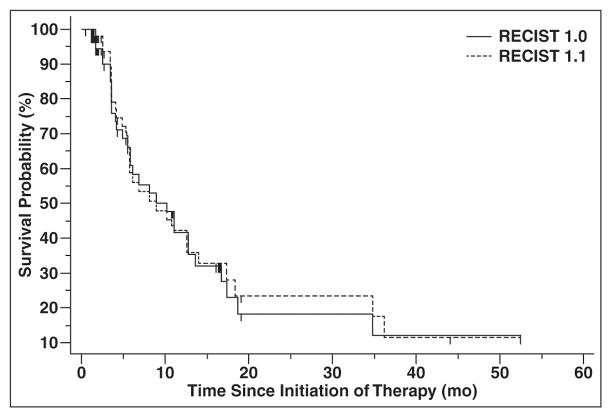
Median TTP was 8.9 months (95% CI, 5.5–13.9 months) according to RECIST 1.1 and was 8.9 months (95% CI, 5.8–13.6 months) by RECIST 1.0 (Fig. 5). On the basis of the identical median TTP and very similar 95% CIs for the median, there was no evidence of a difference between TTPs by two criteria.
Fig. 5.
Time to progression (TTP) by Response Evaluation Criteria in Solid Tumors (RECIST) 1.1 versus RECIST 1.0. There was no evidence of difference in TTP according to RECIST 1.1 or RECIST 1.0, with median TTP of 8.9 months according to each criteria.
Time to Progression by RECIST 1.1 and Morphologic Changes
The median TTP by RECIST 1.1 alone was 8.9 months (95% CI, 5.5–13.9 months), compared with 5.6 months (95% CI, 4.2–9.7 months) for RECIST 1.1 and morphologic changes combined (Fig. 6). In the 16 of 59 patients who had morphologic changes of new enhancement in previously hypodense target lesions (lymph node, liver, lung, and pleural masses) during the course of treatment, the morphologic changes preceded RECIST 1.1 progression in 12 patients and occurred simultaneously with RECIST 1.1 progression in four patients.
Fig. 6.
Time to progression (TTP) by Response Evaluation Criteria in Solid Tumors (RECIST) 1.1 versus RECIST 1.1 and morphologic changes. Median TTP by RECIST 1.1 alone was 8.9 months compared with 5.6 months for RECIST 1.1 and morphologic changes combined.
Intraobserver Agreement of Baseline Measurements
The intraobserver agreement of the measurements on baseline scans in 25 randomly selected patients was high for RECIST 1.1 and RECIST 1.0, with concordance correlation coefficients of 0.9941 (95% CI, 0.9867–0.9974) for RECIST 1.1 and 0.9927 (95% CI, 0.9838–0.9967) for RECIST 1.0. The 95% limits of agreement for the two criteria were also similar, with −13.1% and 9.3% for RECIST 1.1 and −14.1% and 9.3% for RECIST 1.0.
Discussion
The current study of patients with RCC treated with VEGF-targeted therapy shows that RECIST 1.1 and RECIST 1.0 first and best response assessments are highly concordant, using fewer target lesions according to RECIST 1.1. In addition, there was no statistically significant difference in TTP according to the two RECIST criteria. The results of this study in patients with RCC treated with class-specific systemic agents is in keeping with multiple prior reports of RECIST 1.1 versus 1.0 assessment in other malignancies, showing concordant response assessments with RECIST versions 1.1 and 1.0. Therefore, low objective response rates in RCC will likely continue to be reported in trials using RECIST 1.1 to define study endpoints.
The number of target lesions was statistically significantly lower using RECIST 1.1 as opposed to RECIST 1.0, most often because of the maximum of two permitted target lesions per organ. The second most common reason for the decrease in target lesions was the change in criteria for measurability for lymph nodes, with a short axis of 15 mm required in version 1.1. In fact, three patients with lymph node–only targets according to RECIST 1.0 were left with no measurable targets according to RECIST 1.1. This is an important consideration to maximize patient eligibility for clinical trials, particularly for patients with low-volume disease. Nevertheless, similar findings have been reported previously in prostate and gastric cancer, where 25 of 75 lymph nodes remained targets by RECIST 1.1 in prostate cancer [4] and 66 of 172 lymph nodes remained targets according to RECIST 1.1 in gastric cancer [6]. Similarly, the number of target lymph nodes was decreased in 24 of 70 patients with lung cancer [8].
On first follow-up CT scans, the initial response category by RECIST 1.1 and 1.0 was concordant in 50 patients (85%) and different in nine patients, with seven of the nine discrepancies occurring between partial response and stable disease assignments when using the two criteria. Because patients with either partial response or stable disease continued in the trial, these distinctions are not considered clinically significant. There were only two progressive disease or stable disease differences by RECIST 1.1 and 1.0, which would alter the length of time enrolled in the trial or receiving treatment. Although it is interesting that a few more partial responses were observed at first follow-up using RECIST 1.1, especially considering the correlation of first follow-up tumor shrinkage with survival outcomes [21, 25], the increase in mean tumor shrinkage overall (12.1% by RECIST 1.1 vs 10.8% by RECIST 1.0) is well within the range of measurement error and is unlikely to translate into a clinically meaningful difference [26].
Best response assessment (tumor burden nadir) using RECIST 1.1 and 1.0 was concordant in 53 patients (90%). Four patients had partial response as the best response by RECIST 1.1 and stable disease as the best response by RECIST 1.0, showing that patients were slightly more likely to achieve partial response status using RECIST 1.1. Although most of the differences in best response assignment were between partial response and stable disease, there were two patients in whom the difference was between stable disease and progressive disease, and this again is an important difference because these two patients would be required to stop the trials on progressive disease assignment. A few such important differences in response assignment between RECIST stable disease and progressive disease have been reported elsewhere [5].
There was no evidence of a difference in the TTP according to RECIST 1.1 or RECIST 1.0, on the basis of identical median TTPs (8.9 months) by the criteria and almost identical 95% CIs for the median. TTP was unchanged in 54 of 59 patients. TTP was longer by RECIST 1.1 in two patients and longer by RECIST 1.0 in three patients. Somewhat surprisingly, the 5-mm absolute increase in sum diameter of targets only contributed to a delay in RECIST 1.1 TTP in one patient, who had a low tumor burden at baseline (only two small lung nodule target lesions). Therefore, the 5-mm absolute increase requirement in RECIST 1.1 is unlikely to prolong TTP in a large number of patients with RCC, who typically have at least a moderate burden of metastatic tumor burden when they initiate therapy and relatively modest amounts of tumor shrinkage during therapy. Similarly, the new addition of PET/CT to define progressive disease by RECIST 1.1 did not change TTP in our patient population, because very few patients underwent PET/CT during the treatment period and were instead followed up by diagnostic CT.
When morphologic CT changes were considered in addition to RECIST 1.1 calculations, TTP was shorter than when using RECIST 1.1 alone (median, 5.6 months for both morphologic changes and RECIST 1.1 vs 8.9 months for RECIST 1.1 alone). Typically, few patients had new enhancement in previously hypoattenuating lesions over the course of therapy (16 of 59), as evidenced by new enhancement in hypodense lymph nodes or liver lesions, or by subsolid lung nodules developing solid enhancing components. These findings preceded RECIST 1.1 progression in 12 patients and coincided with RECIST 1.1 progression in four patients. Given the limited number of therapeutic options for patients with metastatic RCC, it is unclear whether there is any treatment advantage to diagnosing progression earlier. In fact, recent literature suggests that there may be some therapeutic effect of sorafenib occurring at the time of RECIST progression, as evidenced by a reduced tumor growth rate of metastases at progression compared with tumor growth rate before the start of treatment [27]. Furthermore, most sorafenib-treated patients in that study had an increased growth rate after discontinuation of therapy when compared with tumor growth rate at the time of progression. Therefore, although morphologic changes may forecast tumor growth or RECIST progression in some patients, it remains to be determined whether treatment change decisions should be based on these findings.
Intraobserver agreement of the measurements on baseline scans in 25 randomly selected patients was high for RECIST 1.1 and RECIST 1.0, with high concordance correlation coefficients above 0.99 and similar 95% limits of agreement. The range of the 95% limits of agreement, reflecting the differences in the measurements that could be attributed to measurement variation, is similar to those reported elsewhere [26].
Limitations of the current study include its retrospective design and relatively small number of patients in the RCC cohort, who were treated at a single center with multiple antiangiogenic agents. The use of a single radiologic reader for the tumor measurements according to RECIST is another important limitation. The use of class-specific treatment cohort is a somewhat novel approach in comparison of RECIST 1.1 versus 1.0, but it is of particular interest when considering that multiple prior studies of imaging treatment response in RCC use similar patient groups [17–21]. Also, few patients with RCC in our cohort underwent PET/CT during the course of therapy, limiting the assessment of this technique and its contribution to potential differences in this RECIST 1.1 and 1.0 evaluation.
In conclusion, RECIST 1.1 and RECIST 1.0 response assessments were overall highly concordant in patients with RCC treated with VEGF-targeted therapy, using fewer target lesions according to RECIST 1.1 compared with RECIST 1.0. Because RECIST 1.1 and 1.0 performed comparably and RECIST 1.1 requires fewer measurements and therefore less time, our findings support the use of RECIST 1.1 in this setting. In terms of first and best responses, a few more partial response categorizations were observed according to RECIST 1.1. There was no evidence of a difference in median TTP according to RECIST 1.1 and RECIST 1.0. When considering morphologic changes in combination with RECIST 1.1 assessment, median TTP was shorter, but the clinical relevance of such a finding has not yet been defined. Additional studies are needed to optimize the definition of progressive disease in this cancer-specific and treatment-specific cohort, to maximize the therapeutic benefits of antiangiogenic treatments.
Acknowledgments
K. M. Krajewski received a research grant from GE Healthcare and the Association of University Radiologists. M. Nishino received support from the National Cancer Institute (grant 1K23CA157631). T. K. Choueiri serves on the advisory boards for Pfizer, Aveo, GlaxoSmithKline, and Novartis and has received research support from Pfizer, the Trust family, Loker Pinard, and Michael Brigham funds for Kidney Cancer Research.
References
- 1.Therasse P, Arbuck SG, Eisenhauer EA, et al. New guidelines to evaluate the response to treatment in solid tumors. European Organization for Research and Treatment of Cancer, National Cancer Institute of the United States, National Cancer Institute of Canada. J Natl Cancer Inst. 2000;92:205–216. doi: 10.1093/jnci/92.3.205. [DOI] [PubMed] [Google Scholar]
- 2.Eisenhauer EA, Therasse P, Bogaerts J, et al. New response evaluation criteria in solid tumours: revised RECIST guideline (version 1. 1) Eur J Cancer. 2009;45:228–247. doi: 10.1016/j.ejca.2008.10.026. [DOI] [PubMed] [Google Scholar]
- 3.Nishino M, Jagannathan JP, Ramaiya NH, Van den Abbeele AD. Revised RECIST guideline version 1. 1: what oncologists want to know and what radiologists need to know. AJR. 2010;195:281–289. doi: 10.2214/AJR.09.4110. [DOI] [PubMed] [Google Scholar]
- 4.Piatek CI, Desai BB, Wei-Tsao D, et al. J Clin Oncol. suppl. Vol. 29. American Society of Clinical Oncology; 2011. [Accessed November 17, 2014]. RECIST 1.0 versus 1.1: implications for trial interpretation and design in advanced prostate cancer; p. abstr 2563. website meetinglibrary.asco.org/content/84825-102. [Google Scholar]
- 5.Nishino M, Jackman DM, Hatabu H, et al. New Response Evaluation Criteria in Solid Tumors (RECIST) guidelines for advanced nonsmall cell lung cancer: comparison with original RECIST and impact on assessment of tumor response to targeted therapy. AJR. 2010;195:W221–W228. doi: 10.2214/AJR.09.3928. [web] [DOI] [PMC free article] [PubMed] [Google Scholar]
- 6.Fuse N, Nagahisa-Oku E, Doi T, et al. Effect of RECIST revision on classification of target lesions and overall response in advanced gastric cancer patients. Gastric Cancer. 2013;16:324–328. doi: 10.1007/s10120-012-0187-9. [DOI] [PubMed] [Google Scholar]
- 7.Jeh SK, Kim SH, Kang BJ. Comparison of the diagnostic performance of response evaluation criteria in solid tumor 1.0 with response evaluation criteria in solid tumor 1. 1 on MRI in advanced breast cancer response evaluation to neoadjuvant chemotherapy. Korean J Radiol. 2013;14:13–20. doi: 10.3348/kjr.2013.14.1.13. [DOI] [PMC free article] [PubMed] [Google Scholar]
- 8.Nishino M, Cardarella S, Jackman DM, et al. RECIST 1.1 in NSCLC patients with EGFR mutations treated with EGFR tyrosine kinase inhibitors: comparison with RECIST 1.0. AJR. 2013;201:W64–W71. doi: 10.2214/AJR.12.9668. [web] [DOI] [PMC free article] [PubMed] [Google Scholar]
- 9.Jang GS, Kim MJ, Ha HI, et al. Comparison of RECIST version 1.0 and 1. 1 in assessment of tumor response by computed tomography in advanced gastric cancer. Chin J Cancer Res. 2013;25:689–694. doi: 10.3978/j.issn.1000-9604.2013.11.09. [DOI] [PMC free article] [PubMed] [Google Scholar]
- 10.Shinagare AB, Jagannathan JP, Kurra V, et al. Comparison of performance of various tumour response criteria in assessment of regorafenib activity in advanced gastrointestinal stromal tumours after failure of imatinib and sunitinib. Eur J Cancer. 2014;50:981–986. doi: 10.1016/j.ejca.2013.11.037. [DOI] [PMC free article] [PubMed] [Google Scholar]
- 11.Jang HJ, Kim BC, Kim HS, et al. Comparison of RECIST 1.0 and RECIST 1. 1 on computed tomography in patients with metastatic colorectal cancer. Oncology. 2014;86:117–121. doi: 10.1159/000357714. [DOI] [PubMed] [Google Scholar]
- 12.Yang JC, Haworth L, Sherry RM, et al. A randomized trial of bevacizumab, an anti-vascular endothelial growth factor antibody, for metastatic renal cell carcinoma. N Engl J Med. 2003;349:427–434. doi: 10.1056/NEJMoa021491. [DOI] [PMC free article] [PubMed] [Google Scholar]
- 13.Escudier B, Eisen T, Stadler WM, et al. TARGET Study Group. Sorafenib in advanced renal cell carcinoma. N Engl J Med. 2007;356:125–134. doi: 10.1056/NEJMoa060655. [DOI] [PubMed] [Google Scholar]
- 14.Motzer RJ, Hutson TE, Tomczak P, et al. Sunitinib versus interferon alfa in metastatic renal-cell carcinoma. N Engl J Med. 2007;356:115–124. doi: 10.1056/NEJMoa065044. [DOI] [PubMed] [Google Scholar]
- 15.Motzer RJ, Michaelson MD, Rosenberg J, et al. Sunitinib efficacy against advanced renal cell carcinoma. J Urol. 2007;178:1883–1887. doi: 10.1016/j.juro.2007.07.030. [DOI] [PubMed] [Google Scholar]
- 16.Sternberg CN, Davis ID, Mardiak J, et al. Pazopanib in locally advanced or metastatic renal cell carcinoma: results of a randomized phase III trial. J Clin Oncol. 2010;28:1061–1068. doi: 10.1200/JCO.2009.23.9764. [DOI] [PubMed] [Google Scholar]
- 17.van der Veldt AA, Meijerink MR, van den Eertwegh AJM, Haanen JB, Boven E. Choi response criteria for early prediction of clinical outcome in patients with metastatic renal cell carcinoma treated with sunitinib. Br J Cancer. 2010;102:803–809. doi: 10.1038/sj.bjc.6605567. [DOI] [PMC free article] [PubMed] [Google Scholar]
- 18.Smith AD, Leiber ML, Shah SN. Assessing tumor response and detecting recurrence in metastatic renal cell carcinoma on targeted therapy: importance of size and attenuation on contrast-enhanced CT. AJR. 2010;194:157–165. doi: 10.2214/AJR.09.2941. [DOI] [PubMed] [Google Scholar]
- 19.Smith AD, Shah SN, Rini BI, Lieber ML, Remer EM. Morphology, attenuation, size and structure (MASS) criteria: assessing response and predicting clinical outcome in metastatic renal cell carcinoma on antiangiogenic targeted therapy. AJR. 2010;194:1470–1478. doi: 10.2214/AJR.09.3456. [DOI] [PubMed] [Google Scholar]
- 20.Krajewski KM, Franchetti Y, Nishino M, et al. 10% Tumor diameter shrinkage on the first follow-up computed tomography predicts clinical outcome in patients with advanced renal cell carcinoma treated with angiogenesis inhibitors: a follow-up validation study. Oncologist. 2014;19:507–514. doi: 10.1634/theoncologist.2013-0391. [DOI] [PMC free article] [PubMed] [Google Scholar]
- 21.Cohen J. A coefficient of agreement for nominal scales. Educ Psychol Meas. 1960;20:37–46. [Google Scholar]
- 22.Kaplan EL, Meier P. Nonparametric estimation from incomplete observations. J Am Stat Assoc. 1958;53:457–481. [Google Scholar]
- 23.Lin LI. A concordance correlation coefficient to evaluate reproducibility. Biometrics. 1989;45:255–268. [PubMed] [Google Scholar]
- 24.Bland JM, Altman DG. Statistical methods for assessing agreement between two methods of clinical measurement. Lancet. 1986;1(8476):307–310. [PubMed] [Google Scholar]
- 25.Krajewski KM, Guo M, Van den Abbeele AD, et al. Comparison of four early posttherapy imaging changes (EPTIC; RECIST 1. 0, tumor shrinkage, computed tomography tumor density, Choi criteria) in assessing outcome to vascular endothelial growth factor-targeted therapy in patients with advanced renal cell carcinoma. Eur Urol. 2011;59:856–862. doi: 10.1016/j.eururo.2011.01.038. [DOI] [PubMed] [Google Scholar]
- 26.Krajewski KM, Nishino M, Franchetti Y, Ramaiya NH, Van den Abbeele AD, Choueiri TK. Intraobserver and interobserver variability in computed tomography size and attenuation measurements in patients with renal cell carcinoma receiving antiangiogenic therapy: implications for alternative response criteria. Cancer. 2014;120:711–721. doi: 10.1002/cncr.28493. [DOI] [PMC free article] [PubMed] [Google Scholar]
- 27.Ferté C, Koscielny S, Albiges L, et al. Tumor growth rate provides useful information to evaluate sorafenib and everolimus treatment in metastatic renal cell carcinoma patients: an integrated analysis of the TARGET and RECORD phase 3 trial data. Eur Urol. 2014;65:713–720. doi: 10.1016/j.eururo.2013.08.010. [DOI] [PubMed] [Google Scholar]


