

Significance
Broca’s area is widely recognized to be important for speech production, but its specific role in the dynamics of cortical language networks is largely unknown. Using direct cortical recordings of these dynamics during vocal repetition of written and spoken words, we found that Broca’s area mediates a cascade of activation from sensory representations of words in temporal cortex to their corresponding articulatory gestures in motor cortex, but it is surprisingly quiescent during articulation. Contrary to classic notions of this area’s role in speech, our results indicate that Broca’s area does not participate in production of individual words, but coordinates the transformation of information processing across large-scale cortical networks involved in spoken word production, prior to articulation.
Keywords: Broca, speech, ECoG
Abstract
For over a century neuroscientists have debated the dynamics by which human cortical language networks allow words to be spoken. Although it is widely accepted that Broca’s area in the left inferior frontal gyrus plays an important role in this process, it was not possible, until recently, to detail the timing of its recruitment relative to other language areas, nor how it interacts with these areas during word production. Using direct cortical surface recordings in neurosurgical patients, we studied the evolution of activity in cortical neuronal populations, as well as the Granger causal interactions between them. We found that, during the cued production of words, a temporal cascade of neural activity proceeds from sensory representations of words in temporal cortex to their corresponding articulatory gestures in motor cortex. Broca’s area mediates this cascade through reciprocal interactions with temporal and frontal motor regions. Contrary to classic notions of the role of Broca’s area in speech, while motor cortex is activated during spoken responses, Broca’s area is surprisingly silent. Moreover, when novel strings of articulatory gestures must be produced in response to nonword stimuli, neural activity is enhanced in Broca’s area, but not in motor cortex. These unique data provide evidence that Broca’s area coordinates the transformation of information across large-scale cortical networks involved in spoken word production. In this role, Broca’s area formulates an appropriate articulatory code to be implemented by motor cortex.
Spoken word production is fundamental to human communication. Paul Broca was the first to link word production to a cortical region in the posterior inferior frontal gyrus, since referred to as “Broca’s area” (1). His iconic findings are among the most influential in the field of cortical specialization, and Broca’s area is still considered to be critically involved in speech production (2, 3).
The role of Broca’s area in production has been extensively studied using paradigms that vary in complexity from single words to full discourse (4, 5). Although these tasks engage multiple different cognitive demands (e.g., phonological, semantic, and syntactic processing), they all share a common set of core operations consisting of retrieving a word’s phonological representation, translating it into an articulatory code, and coordinating the fine motor movements of the vocal articulators (6). However, current neuropsychological and neurolinguistic theories still debate the exact role that Broca’s area plays in this set of core operations (7–9). Indefrey and Levelt (4) proposed that Broca’s area accesses a phonological word representation that is compiled sequentially into segments of syllables (i.e., syllabification). This segmental representation is then forwarded to motor regions where it is transformed into an articulatory (i.e., phonetic) code. Recent models of speech production (9), as well as the dual-stream model of speech processing (10), do not limit the articulatory transformation to motor cortices but rather implicate Broca’s area in processing articulatory representations. Finally, neuropsychological and lesion studies have implicated Broca’s area and other regions, such as the insula, in the coordination of the articulators themselves (3, 11, 12). These models predict recruitment of Broca’s area during different stages of word production: phonological processing (before articulatory encoding), generating the articulatory code (phonetic encoding), and coordinating the articulators.
To understand how word production is neurally implemented, methods with both spatial and temporal information, as well as techniques modeling the interactions between cortical regions, are required (7). To date, the role of Broca’s area in word production has been mostly derived from neuroimaging and noninvasive electrophysiological techniques that do not provide a sufficiently detailed picture of the spatial-temporal dynamics (4, 5, 7, 13). In contrast, direct intracranial cortical recordings offer a unique opportunity to acquire neural signals with an unprecedented combination of temporal and spatial resolution. Several such studies have implicated the inferior frontal lobe in word production (14–19), but did not focus on the specific role of Broca’s area in production. Conversely, a recent intracranial study was, to our knowledge, the first to focus on Broca’s area, finding evidence for lexical, grammatical, and phonological processing (20), but did not examine the processes required for overt word production (phonetic encoding and articulation). In the present study, we used overt verbal production of words cued through different perceptual modalities (written and spoken words) to study the fine temporal dynamics by which neural populations engage, disengage, and interact with one another during the core operations of spoken word production.
Results
We used electrocorticographic (ECoG) recordings obtained directly from the surface of the cortex, which have exceptional temporal resolution and spatial specificity, and which provide a robust neurophysiological signal for analysis of the brain dynamics underlying speech production (21). Seven patients with electrode implantations over peri-sylvian language regions, including Broca’s area, consented and participated in the study during lulls in clinical management. Subjects participated in a battery of three overt word production tasks including auditory word repetition of monosyllabic words, auditory repetition of multisyllabic words, and word reading (Table S1 and Fig. S1). We used increases in high-frequency ECoG signal power to measure task-related neural activation in peri-sylvian language cortex (high gamma frequencies between 70 and 150 Hz provided the most reliable spectral measure of cortical activation, Fig. S2).
During auditory word repetition, cortical activation exhibited a systematic temporal propagation of peak activity from auditory cortices [superior temporal gyrus (STG) and superior temporal sulcus (STS)] to Broca’s area (pars triangularis and opercularis), eventually reaching premotor and motor cortex during word articulation. This pattern is shown in a representative subject during perception and subsequent production of spoken monosyllabic words (Fig. 1). Activation in temporal cortex commenced as early as 39 ms and was closely followed by activation in Broca’s area, starting within 240 ms of stimulus onset and peaking at 340 ms, during which time the spoken-word stimuli were still being presented. Surprisingly, by the time speech commenced, activation in Broca’s area ended whereas motor cortex activity was apparent before and during speech production (mean onset of articulation reaction time, RT = 1,200 ms poststimulus onset). This temporal window of activity constrains Broca’s area processing to prearticulatory stages rather than to the on-line coordination of the speech articulators.
Fig. 1.

Repetition of monosyllabic words in a representative subject. (A) Event-related spectral perturbations (ERSPs), averaged across trials, and locked to the onset of auditory word stimulus. Cortical activation indexed by power increases in high frequencies is first apparent in STG during word perception, subsequently in Broca’s area, and finally extends to motor cortex during word production (vertical lines mark mean articulation onset). (B) High-frequency power (γhigh, 70–150 Hz) traces, averaged across trials, and locked to word stimulus onset are shown for STG (blue), Broca (green), and Motor (red) electrodes. The first electrode in every pair is marked by a black circle and corresponds to the ERSP plotted on the left. The shaded gray area marks the distribution of articulation onset for this subject (1 SD in each direction).
We assessed the generalizability of these findings across subjects and different production tasks by examining multisyllabic articulatory movements, as well as word reading, and by examining neural activation time-locked to articulation. Active electrodes (defined by significant increases in γHigh power) across tasks (Table S2) and subjects were assessed based on the latency of peak neural activation. Electrodes covering Broca’s area showed peak activity before the onset of articulation but not during articulation (Fig. 2A). By the time speech commenced, an overwhelming majority of electrodes were no longer active (offset of significance, Fig. S3). Electrodes were classified according to within-subject gyral anatomy (STG and STS; pars opercularis, pars triangularis, and precentral gyrus) to assess the temporal propagation of neural activation across anatomical regions in relation to stimulus onset as well as articulatory onset (Fig. 2B and Fig. S3). An analysis of variance was conducted on the latencies of peak neural activity in relation to articulatory onset, confirming that latencies were significantly different for each anatomical site [i.e., an effect of anatomical site F(2,50) = 107.32, P < 0.001; see Fig. S3 for details and post hoc pairwise tests].
Fig. 2.

(A) The spatial distribution of activation timing is shown for all subjects. Electrodes marked in blue peaked in activity before articulation onset (peak activity was at least 100 ms before articulation onset) whereas electrodes marked in red peaked in activity during and after articulation onset. (B) Peak activity locked to stimulus onset (x axis) and locked to speech onset (y axis) is displayed for electrodes in three anatomical locations: STG (cyan), Broca’s area (green), and motor cortex (orange). Activity in both dimensions temporally propagates from STG to Broca’s area and culminates in the precentral gyrus.
To verify the temporal-spatial patterns that we observed in averaged cortical responses (Fig. 2 and Fig. S3), we investigated activation of Broca’s area at the single-trial level. Pooled trials from all tasks (auditory and visual) and all subjects were sorted according to response latency (Fig. 3A) and assessed for significance (at least 100 ms of sustained significance compared with baseline; P < 0.05). The latency of peak single-trial activity correlated with articulation onset [r(2,513) = 0.22, P < 0.001]. We quantified the temporal lag between different cortical sites using the cross-correlation of single trials in each electrode pair. The temporal lag from STG to Broca’s area was tightly distributed around 160 ms (μ = 159.96, σ = 79.08, SEM = 10.48), whereas the temporal lag from Broca’s area to motor cortex was distributed around 241 ms (μ = 241.12, σ = 288.25, SEM = 44.78) with a larger variance (Fig. S4, permutation test, P < 0.0001) due to the variable onset of motor cortical activity before articulation (Fig. 3A). The single-trial analyses constrain the latest significant activity in Broca’s area to articulation onset and provide evidence for a consistent temporal link to temporal as well as motor cortices.
Fig. 3.

(A) Vertically stacked single trials are shown for all subjects and production tasks, sorted by response time (black line). Single-trial activity (z-scores within each trial compared with a baseline distribution) temporally cascades from STG to Broca’s area and culminates in motor cortex. (B) Significant Granger causal influence across all electrodes in five patients from STG to Broca (Top, blue), Broca to STG (Middle, red), Broca to motor cortex (Middle, blue), and motor cortex to Broca (Bottom, red). The shaded area in each trace represents the SEM.
To investigate the directionality and Granger causality of signal propagation, we used a recently developed technique, Event-Related Causality (ERC), which estimates the direction and intensity of Granger causal influences among different recording sites simultaneously (22, 23) (Materials and Methods). We focused on the monosyllabic repetition task, which minimizes the process of syllabification (words contained only one syllable). Results from five different patients who completed the word repetition task (task 1, Table S2) are grouped according to anatomy in Fig. 3B. Granger causal influences from STG to Broca’s area peak within the first 200 ms after stimulus onset (Top), followed closely by reciprocal feedback from Broca’s area to STG in the next 200 ms (Middle, red). This reciprocal propagation may represent formation or access to a phonological representation of the acoustic word. Critically, Broca’s area exhibits a feed-forward influence over processing in motor cortices (Middle, blue), which is absent by the time of articulation. The reciprocal influence between Broca’s area and motor cortices (Middle and Bottom) before articulation onset provides additional evidence for the formation and propagation of an articulatory representation of the word to motor cortices.
To investigate the nature of this representation, we leveraged the controlled statistics of the stimuli in the monosyllabic task. Half the stimuli consisted of a three-phoneme combination comprising a real word (e.g., book /bʊk/), whereas the other half consisted of a three-phoneme combination comprising a pseudoword (e.g., yode /joʊd/). Critically, both the real words and pseudowords were pronounceable and were controlled for sublexical properties (neighborhood density, positional probability, transitional probability). Broca’s area activity was higher and more sustained for pseudowords compared with real words even though both categories were controlled for length and phonotactic density (Fig. 4A). Although subjects were able to produce both real words (mean RT = 953.27 ms) and pseudowords (mean RT = 1,053.96 ms), the latency of articulation onset (reaction time) was greater for pseudowords [t(727) = 4.24, P < 0.001] and was correlated with the average high gamma power in Broca’s area [600–1,000 ms, r(727) = 0.12, P < 0.001]. Articulation of pseudowords requires formulation of a novel string of articulatory gestures, never produced before, taxing the speech production system. This significantly increased load is evident in Broca’s area after perception of the word (Fig. 4A and Fig. S5) and lasts up to articulation onset [Fig. 4B, −400 → 0 ms, t(727) = 3.51, P < 0.001]. By the time the articulatory code arrives in motor cortices, there is no significant difference between the two categories (Fig. 4B, P = 0.27), implicating Broca’s area in the formulation of novel articulatory combinations, which are then implemented and executed in motor cortex. This finding suggests that Broca’s area is engaged in articulatory encoding and is not limited to phonological processes such as syllabification.
Fig. 4.
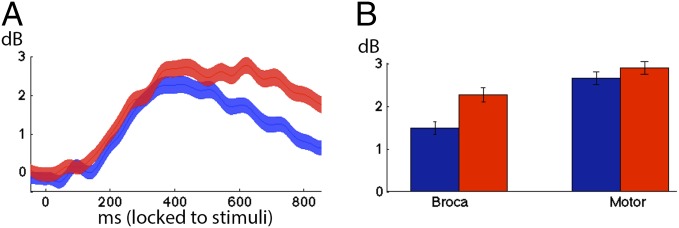
(A) Averaged power traces of electrodes in Broca’s area locked to hearing real words (blue) and pseudowords (red). Shaded area denotes SEMs across electrodes. (B) Average power locked to producing (pre-articulatory −400 → 0 ms) hearing real words (blue) and pseudowords (red) in Broca’s area and motor cortex.
Discussion
Our analyses span multiple levels of stimulus complexity and different linguistic modalities and address cortical Granger causal dynamics. Our data provide evidence that, during word production tasks such as auditory word repetition, the neural representation of a spoken word is forwarded from sensory areas to the prefrontal cortex, where Broca’s area links the representations to an articulatory code that is subsequently implemented by motor cortices responsible for coordination of the articulators. Given the disabling impairment of speech production in Broca’s aphasia (1), it may seem surprising that Broca’s area is not involved during actual articulation. However, our observation is consistent with studies that have shown that cortical lesions limited to Broca’s area do not cause a Broca’s aphasia but result in a transient, rapidly improving mutism (24). Likewise, cortical regions such as the insula have been associated with coordination of the articulators themselves (12). Although our findings provide physiological insights into these clinical observations, they are limited to the cortical networks that were sampled by the electrode coverage and that were engaged during the production tasks. Furthermore, the frequency domain Granger analysis takes into account partial contributions from selected recording sites but cannot elucidate the entire circuit or assess causality in the same sense as lesion studies. Nevertheless, based on previous stimulation studies, as well as the variable cross-correlations in our data (Fig. S4), it is reasonable to propose that the influences that we observe arise from a mixture of direct cortico-cortical projections as well as indirect projections from other cortical and subcortical sources (25–27).
Indefrey and Levelt viewed Broca’s area as critically involved in phonological processing whereas subsequent articulatory encoding is supported by motor cortices (4, 7). However, our data control for syllabification (both real and pseudowords are one syllable) and suggest that Broca’s area is engaged in articulatory encoding. Although this is in agreement with the dual-stream model wherein Broca’s area is part of a dorsal articulatory network (10), it is also true that earlier activity in Broca’s area supports other linguistic processes. For example, Sahin et al. identified lexical, inflectional, and phonological processing occurring up to 500 ms poststimulus (20) without overt articulation. Our data are consistent with this time line and identify an articulatory encoding stage commencing as early as 250 ms poststimulus onset, as evidenced by the increased load when processing a novel string of articulatory gestures (Fig. 4A).
Broca’s area has been previously associated with a variety of processes, including phonological segmentation, syntactic processing, and unification, all of which involve segmenting and linking different types of linguistic information (13, 28, 29). Although repeating and reading single words do not engage semantic and syntactic processing, they do require an operation linking phonemic sequences with motor gestures. Our findings indicate that this linkage is coordinated by Broca’s area through reciprocal interactions with temporal and frontal cortices responsible for phonemic and articulatory representations, respectively, including interactions with motor cortex before the actual act of speech. Based on these unique findings, we propose that Broca’s area is not the seat of articulation per se, but rather is a key node in manipulating and forwarding neural information across large-scale cortical networks responsible for key components of speech production.
Materials and Methods
Subjects, Tasks, and Stimuli.
Seven subjects (S1–S7) undergoing neurosurgical treatment for refractory epilepsy at The Johns Hopkins Hospital participated in the study (Table S1 and Fig. S1). Electrode placement and medical treatment were dictated solely by the clinical needs of each patient. All subjects gave written consent to participate in the study as well as an additional oral consent immediately before recording the task. The study protocol was approved by the University of California (UC) Berkeley and Johns Hopkins Committees on Human Research. Six subjects were left-hemisphere dominant for language, and all subjects had left-hemisphere electrode coverage. Subject S4 did not undergo a Wada test; however, the subject was right-handed and electrical stimulation at sites in the left inferior frontal gyrus interfered with speech production (picture naming and sentence reading). Subjects S1–S3 and S5 and S6 took part in a previously described word repetition task (21, 30). Subjects were asked to repeat aloud each word that they heard as soon as they were ready. Words were one syllable and three phonemes in length (mean duration = 525 ms, SD = 100 ms; word repetition 1). All words were controlled for length (400–700 ms) as well as sublexical phonotactic probabilities. Real words were all high frequency (Kucera–Francis log scale 2–2.4). Pseudowords were created by substituting one phoneme from a matched list of real words. Real words and pseudowords were matched for the following sublexical properties: phonological neighborhood density (range 15–30), biphoneme probability (range 0.0001–0.0039), and positional probability (range 0.011–0.065). Estimates are in log units, calculated using the Irvine Phonotactic Online Dictionary (31). Phonotactic probabilities (both stressed and unstressed estimates) were not significantly different between real words and pseudowords (t test, P > 0.05). Stimuli were presented with a jittered interstimulus interval of 4 s ± 250 ms (random jitter).
Subjects S1–S5 and S7 took part in a previously described word-reading task (21, 32). Subjects were asked to read aloud each visually presented word. Stimuli consisted of mono- and bisyllabic words. Subjects S2, S3, and S5 participated in an additional word repetition task, which consisted of words varying in length (word repetition 2; see Table S2 for stimuli details). All peripheral signals and responses were recorded together with intracranial EEG signals to ensure proper synchronization (sampled at 1,000 Hz using a clinical 128-channel Harmonie system from Stellate).
Electrode Localization.
A structural preoperative MRI as well as a postimplantation computed tomography (CT) scan was acquired for all subjects. The MRI and CT scans were coregistered to the same space using two nonlinear transformations based on normalized mutual information implemented in the Bioimage suite (33) (the second transformation was used to correct for slight shifts in brain morphology caused by the electrodes). The results were then compared with an intraoperative photo image of the exposed grid after it was sutured to the dura. Electrodes were classified according to anatomical location (superior temporal gyrus, precentral gyrus, pars opercularis, pars triangularis) within each subject’s anatomical space.
Electrode Selection.
All electrodes containing sustained ictal activity and sustained artifacts (electrical line noise, jaw clenching artifacts, etc.) were removed. All remaining electrodes that covered either the left frontal lobe or the superior temporal gyrus were selected for analyses. Electrodes were tested for significant activity during the entire task (collapsed across time) within seven frequency bands and corrected for multiple comparisons (Data Analysis and Fig. S1, white filled circles). All significant electrodes were then analyzed across time, focusing on sustained temporal activity in the high gamma band (γHigh: 70–150 Hz), locked to stimulus onset and speech production onset (Data Analysis). All electrode labels (“STG,” “Broca,” “Motor”) were based on within-subject anatomy. STG included the superior temporal gyrus as well as coverage of the lateral surface of the superior temporal sulcus; Broca’s area included pars opercularis and triangularis; and Motor included the precentral gyrus. Each electrode's gyral anatomy was based on an in-depth review of each subject’s anatomy including an anatomical MRI, coregistered CT, and intraoperative images.
Data Analysis.
Electrodes were defined as significant if they showed a statistical difference (two-sample t test, α = 0.001, Bonferroni-corrected) in at least one of seven frequency bands (raw power: 1–300 Hz, theta: 4–8 Hz, alpha: 8–12 Hz, beta: 12–30 Hz, gamma: 30–70 Hz, high gamma: 70–150 Hz, very high gamma: 150–300 Hz) by comparing log-transformed power during prestimulus baseline (−450 → −50 ms) with the poststimulus epoch (0 ms → speech response + 500 ms). Power spectral densities were computed for the baseline and poststimulus epochs to assess event-related changes in the frequency domain (Fig. S2). Event-related spectral perturbations (event-related spectrograms, Fig. 1) were computed using log-transformed power as previously reported (30); power was assessed by using a frequency domain half-max, full-width Gaussian filter and a subsequent Hilbert transform). Power was assessed for significance using a bootstrapping approach comparing power estimates to pooled distributions from baseline (Statistical Bootstrapping). Based on our results showing peak activity at 100 Hz (Fig. 1 and Fig. S2) as well as previously reported findings (15–17, 19, 21, 30) we focused on the high gamma band (γHigh: 70–150 Hz). Averaged event-related log-transformed γHigh traces were computed and transformed to units of z-score significance compared with a bootstrapped baseline distribution (Statistical Bootstrapping). Estimates were smoothed using a Hanning window (100 samples), and peak γHigh value was defined as the maximum value within a significant window (a minimum of 100 ms of contiguous points passing a significance threshold corresponding to α = 0.0023) and was calculated separately locked to stimulus onset and articulation. Onsets and offsets of γHigh activity were computed by taking the first and last time sample that passed significance (trials were aligned to either stimulus or articulation onset, averaged, and then assessed for onset, peak, and offset in relation to stimulus or articulation onset).
Statistical Bootstrapping.
For each subject, averaged power estimates for all trials within a specific task and electrode were compared with a bootstrapped distribution of prestimulus baseline (−250 ms → −50 ms) power values within each frequency band. N random samples were pooled from all of the baselines and averaged to produce a surrogate power sample (where N is the number of trials within a specific task). This process was repeated 1,000 times to create a surrogate distribution with a normal distribution. Real power estimates (poststimulus) were compared with this distribution to assess significance. For the event-related spectral perturbations, all time and frequency significance values were corrected for multiple comparisons using an FDR correction (q = 0.05) (34). Averaged event-related γHigh estimates were computed in the same manner without FDR correction; instead, a threshold for contiguous significant samples was used (100 samples with a P value of 0.0023).
Single-Trial Analysis.
Single-trial γHigh traces were computed for all electrodes with a peak γHigh value in every subject and task (STG electrodes were excluded for the visual reading task). The log transform of the γHigh power time series was smoothed using a Hanning window (100 samples) and changed to units of z-score compared with a pooled baseline (−250 ms → 0 ms) distribution of all trials within that block. This transforms single-trial samples to units of significant activity within that single trial (compared with the normal distribution formed by all baseline samples).
Connectivity Analysis.
ERC is a method to estimate causal influences between brain regions, i.e., the direction, intensity, spectral content, and temporal course of brain activity propagation along a cortical network. ERC stems from the signal-processing technique of Granger causality where signal Y is causally influenced by signal X if knowledge of X’s past significantly improves the prediction of Y. ERC uses a multivariate autoregressive technique that enables estimation of causality in multichannel data. ERC estimates only direct causal influences by using short-time direct Directed Transfer Function (22, 35) and employs a semiparametric regression model to investigate statistically significant event-related changes in effective connectivity across time (22, 23). Data analysis was identical to procedures described in Korzeniewska et al. (23). For each subject, ERC values locked to stimulus or response onset were statistically tested (using a 2D spline; see refs. 36 and 37) with a baseline distribution and corrected for multiple comparisons (Bonferroni). ERC values passing significance (P < 0.05, corrected for multiple comparisons) were retained in the frequency range of 90–120 Hz, normalized within subject, and averaged across subjects and anatomical region to produce the time series in Fig. 3.
Supplementary Material
Acknowledgments
This work was supported by the National Institute of Neurological Disorders and Stroke (NINDS) Grant NS40596 (to N.E.C.), the Nielsen Corporation and the NIH Grant 2R37NS21135 (to R.T.K.), NINDS Grant F31NS065656 (to A.F.), a VA CSR&D Research Career Scientist Award (to N.F.D), and the National Institute of Mental Health Grant F32MH075317 (to A.Y.S).
Footnotes
The authors declare no conflict of interest.
This article is a PNAS Direct Submission.
This article contains supporting information online at www.pnas.org/lookup/suppl/doi:10.1073/pnas.1414491112/-/DCSupplemental.
References
- 1.Broca P. Remarques sur le siege de la faculté du langage articulé, suivies d’une observation d’aphémie (perte de la parole) [Remarks on the seat of the faculty of articulated language, following an observation of aphemia (loss of speech)] Bull Mem Soc Anat Paris. 1861;36:330–357. [Google Scholar]
- 2.Lazar RM, Mohr JP. Revisiting the contributions of Paul Broca to the study of aphasia. Neuropsychol Rev. 2011;21(3):236–239. doi: 10.1007/s11065-011-9176-8. [DOI] [PubMed] [Google Scholar]
- 3.Trupe LA, et al. Chronic apraxia of speech and Broca’s area. Stroke. 2013;44(3):740–744. doi: 10.1161/STROKEAHA.112.678508. [DOI] [PMC free article] [PubMed] [Google Scholar]
- 4.Indefrey P, Levelt WJ. The spatial and temporal signatures of word production components. Cognition. 2004;92(1-2):101–144. doi: 10.1016/j.cognition.2002.06.001. [DOI] [PubMed] [Google Scholar]
- 5.Démonet JF, Thierry G, Cardebat D. Renewal of the neurophysiology of language: Functional neuroimaging. Physiol Rev. 2005;85(1):49–95. doi: 10.1152/physrev.00049.2003. [DOI] [PubMed] [Google Scholar]
- 6.Levelt WJM. Models of word production. Trends Cogn Sci. 1999;3(6):223–232. doi: 10.1016/s1364-6613(99)01319-4. [DOI] [PubMed] [Google Scholar]
- 7.Indefrey P. The spatial and temporal signatures of word production components: A critical update. Front Psychol. 2011;2:255. doi: 10.3389/fpsyg.2011.00255. [DOI] [PMC free article] [PubMed] [Google Scholar]
- 8.Rapp B, Buchwald A, Goldrick M. Integrating accounts of speech production: The devil is in the representational details. Lang Cogn Neurosci. 2014;29(1):24–27. [Google Scholar]
- 9.Hickok G. Computational neuroanatomy of speech production. Nat Rev Neurosci. 2012;13(2):135–145. doi: 10.1038/nrn3158. [DOI] [PMC free article] [PubMed] [Google Scholar]
- 10.Hickok G, Poeppel D. The cortical organization of speech processing. Nat Rev Neurosci. 2007;8(5):393–402. doi: 10.1038/nrn2113. [DOI] [PubMed] [Google Scholar]
- 11.Caplan D. Language Structure Processing and Disorders. MIT Press; Cambridge, MA: 1992. [Google Scholar]
- 12.Dronkers NF. A new brain region for coordinating speech articulation. Nature. 1996;384(6605):159–161. doi: 10.1038/384159a0. [DOI] [PubMed] [Google Scholar]
- 13.Friederici AD. Towards a neural basis of auditory sentence processing. Trends Cogn Sci. 2002;6(2):78–84. doi: 10.1016/s1364-6613(00)01839-8. [DOI] [PubMed] [Google Scholar]
- 14.Fried I, Ojemann GA, Fetz EE. Language-related potentials specific to human language cortex. Science. 1981;212(4492):353–356. doi: 10.1126/science.7209537. [DOI] [PubMed] [Google Scholar]
- 15.Towle VL, et al. ECoG gamma activity during a language task: Differentiating expressive and receptive speech areas. Brain. 2008;131(Pt 8):2013–2027. doi: 10.1093/brain/awn147. [DOI] [PMC free article] [PubMed] [Google Scholar]
- 16.Edwards E, et al. Spatiotemporal imaging of cortical activation during verb generation and picture naming. Neuroimage. 2010;50(1):291–301. doi: 10.1016/j.neuroimage.2009.12.035. [DOI] [PMC free article] [PubMed] [Google Scholar]
- 17.Pei X, et al. Spatiotemporal dynamics of electrocorticographic high gamma activity during overt and covert word repetition. Neuroimage. 2011;54(4):2960–2972. doi: 10.1016/j.neuroimage.2010.10.029. [DOI] [PMC free article] [PubMed] [Google Scholar]
- 18.Llorens A, Trébuchon A, Liégeois-Chauvel C, Alario FX. Intra-cranial recordings of brain activity during language production. Front Psychol. 2011;2:375. doi: 10.3389/fpsyg.2011.00375. [DOI] [PMC free article] [PubMed] [Google Scholar]
- 19.Cogan GB, et al. Sensory-motor transformations for speech occur bilaterally. Nature. 2014;507(7490):94–98. doi: 10.1038/nature12935. [DOI] [PMC free article] [PubMed] [Google Scholar]
- 20.Sahin NT, Pinker S, Cash SS, Schomer D, Halgren E. Sequential processing of lexical, grammatical, and phonological information within Broca’s area. Science. 2009;326(5951):445–449. doi: 10.1126/science.1174481. [DOI] [PMC free article] [PubMed] [Google Scholar]
- 21.Flinker A, et al. Single-trial speech suppression of auditory cortex activity in humans. J Neurosci. 2010;30(49):16643–16650. doi: 10.1523/JNEUROSCI.1809-10.2010. [DOI] [PMC free article] [PubMed] [Google Scholar]
- 22.Korzeniewska A, Crainiceanu CM, Kuś R, Franaszczuk PJ, Crone NE. Dynamics of event-related causality in brain electrical activity. Hum Brain Mapp. 2008;29(10):1170–1192. doi: 10.1002/hbm.20458. [DOI] [PMC free article] [PubMed] [Google Scholar]
- 23.Korzeniewska A, Franaszczuk PJ, Crainiceanu CM, Kuś R, Crone NE. Dynamics of large-scale cortical interactions at high gamma frequencies during word production: Event related causality (ERC) analysis of human electrocorticography (ECoG) Neuroimage. 2011;56(4):2218–2237. doi: 10.1016/j.neuroimage.2011.03.030. [DOI] [PMC free article] [PubMed] [Google Scholar]
- 24.Mohr JP, et al. Broca aphasia: Pathologic and clinical. Neurology. 1978;28(4):311–324. doi: 10.1212/wnl.28.4.311. [DOI] [PubMed] [Google Scholar]
- 25.Greenlee JD, et al. A functional connection between inferior frontal gyrus and orofacial motor cortex in human. J Neurophysiol. 2004;92(2):1153–1164. doi: 10.1152/jn.00609.2003. [DOI] [PubMed] [Google Scholar]
- 26.Brugge JF, Volkov IO, Garell PC, Reale RA, Howard MA., III Functional connections between auditory cortex on Heschl’s gyrus and on the lateral superior temporal gyrus in humans. J Neurophysiol. 2003;90(6):3750–3763. doi: 10.1152/jn.00500.2003. [DOI] [PubMed] [Google Scholar]
- 27.Matsumoto R, et al. Functional connectivity in the human language system: A cortico-cortical evoked potential study. Brain. 2004;127(Pt 10):2316–2330. doi: 10.1093/brain/awh246. [DOI] [PubMed] [Google Scholar]
- 28.Hagoort P. On Broca, brain, and binding: A new framework. Trends Cogn Sci. 2005;9(9):416–423. doi: 10.1016/j.tics.2005.07.004. [DOI] [PubMed] [Google Scholar]
- 29.Burton MW, Small SL, Blumstein SE. The role of segmentation in phonological processing: An fMRI investigation. J Cogn Neurosci. 2000;12(4):679–690. doi: 10.1162/089892900562309. [DOI] [PubMed] [Google Scholar]
- 30.Flinker A, Chang EF, Barbaro NM, Berger MS, Knight RT. Sub-centimeter language organization in the human temporal lobe. Brain Lang. 2011;117(3):103–109. doi: 10.1016/j.bandl.2010.09.009. [DOI] [PMC free article] [PubMed] [Google Scholar]
- 31.Vaden KI, Hickok GS, Halpin HR. 2009 Irvine Phonotactic Online Dictionary, Version 1.4*. Available at www.iphod.com.
- 32.Crone NE, et al. Electrocorticographic gamma activity during word production in spoken and sign language. Neurology. 2001;57(11):2045–2053. doi: 10.1212/wnl.57.11.2045. [DOI] [PubMed] [Google Scholar]
- 33.Papademetris X, Jackowski M, Rajeevan N, Constable RT, Staib LH. 2006 BioImage Suite: An integrated medical image analysis suite. Section of Bioimaging Sciences, Department of Diagnostic Radiology, Yale School of Medicine. Available at bioimagesuite.yale.edu/ [PMC free article] [PubMed]
- 34.Benjamini Y, Hochberg Y. Controlling the false discovery rate: A practical and powerful approach to multiple testing. J R Stat Soc B. 1995;57(1):289–300. [Google Scholar]
- 35.Korzeniewska A, Mańczak M, Kamiński M, Blinowska KJ, Kasicki S. Determination of information flow direction among brain structures by a modified directed transfer function (dDTF) method. J Neurosci Methods. 2003;125(1-2):195–207. doi: 10.1016/s0165-0270(03)00052-9. [DOI] [PubMed] [Google Scholar]
- 36.Ruppert D, Wand MP, Carroll RJ. Semiparametric Regression. Cambridge University Press; Cambridge, UK: 2003. [Google Scholar]
- 37.Crainiceanu CM, Ruppert D, Claeskens G, Wand MP. Exact likelihood ratio tests for penalized splines. Biometrika. 2005;92(1):91–103. [Google Scholar]
Associated Data
This section collects any data citations, data availability statements, or supplementary materials included in this article.