

Abstract
Recommendations for laboratories to report incidental findings from genomic tests have stimulated interest in such results. In order to investigate the criteria and processes for assigning the pathogenicity of specific variants and to estimate the frequency of such incidental findings in patients of European and African ancestry, we classified potentially actionable pathogenic single-nucleotide variants (SNVs) in all 4300 European- and 2203 African-ancestry participants sequenced by the NHLBI Exome Sequencing Project (ESP). We considered 112 gene-disease pairs selected by an expert panel as associated with medically actionable genetic disorders that may be undiagnosed in adults. The resulting classifications were compared to classifications from other clinical and research genetic testing laboratories, as well as with in silico pathogenicity scores. Among European-ancestry participants, 30 of 4300 (0.7%) had a pathogenic SNV and six (0.1%) had a disruptive variant that was expected to be pathogenic, whereas 52 (1.2%) had likely pathogenic SNVs. For African-ancestry participants, six of 2203 (0.3%) had a pathogenic SNV and six (0.3%) had an expected pathogenic disruptive variant, whereas 13 (0.6%) had likely pathogenic SNVs. Genomic Evolutionary Rate Profiling mammalian conservation score and the Combined Annotation Dependent Depletion summary score of conservation, substitution, regulation, and other evidence were compared across pathogenicity assignments and appear to have utility in variant classification. This work provides a refined estimate of the burden of adult onset, medically actionable incidental findings expected from exome sequencing, highlights challenges in variant classification, and demonstrates the need for a better curated variant interpretation knowledge base.
Whole genome and exome tests are increasingly applied in clinical medicine. The American College of Medical Genetics and Genomics (ACMG) has recommended identification and return of incidental findings (IFs) from a minimum set of 56 actionable genes when a genomic test is performed (Green et al. 2013), unless patients opt out (American College of Medical Genetics and Genomics 2014). Some clinical laboratories return a broader set of IFs. However, there are limited data on frequency of such actionable pathogenic variants, and a standardized level of evidence for determining the pathogenicity of these variants has not been identified. We previously reviewed the primary literature for possible actionable, high penetrance pathogenic single-nucleotide variants (SNVs) in 114 genes in 500 European- and 500 African-ancestry participants randomly selected from the NHLBI Exome Sequencing Project (ESP) and posted on the exome variant server (EVS; http://evs.gs.washington.edu/EVS/) (Dorschner et al. 2013). We now extend these analyses to the 5503 additional participants in the ESP and revise from 114 to 112 genes associated with medically actionable genetic disorders that may remain undiagnosed in adults. These data give a more precise estimate of the frequency of such actionable findings in individuals of European or African ancestry. Such an estimate will allow a better understanding of the implications, including cost, of recommendations to return IFs from genomic tests.
Lack of consensus criteria for pathogenicity classification of variants is an ongoing issue in genomic medicine. It is common for clinicians to disagree with classifications from clinical laboratories. Therefore, we compare the results of our variant classification system to the classification of these variants by different clinical and research laboratories. A goal of these analyses is to investigate consistency in variant classification using criteria from different classification systems and to understand the features of these approaches that lead to discrepant pathogenicity assignments.
Results
Characteristics of the variants reviewed
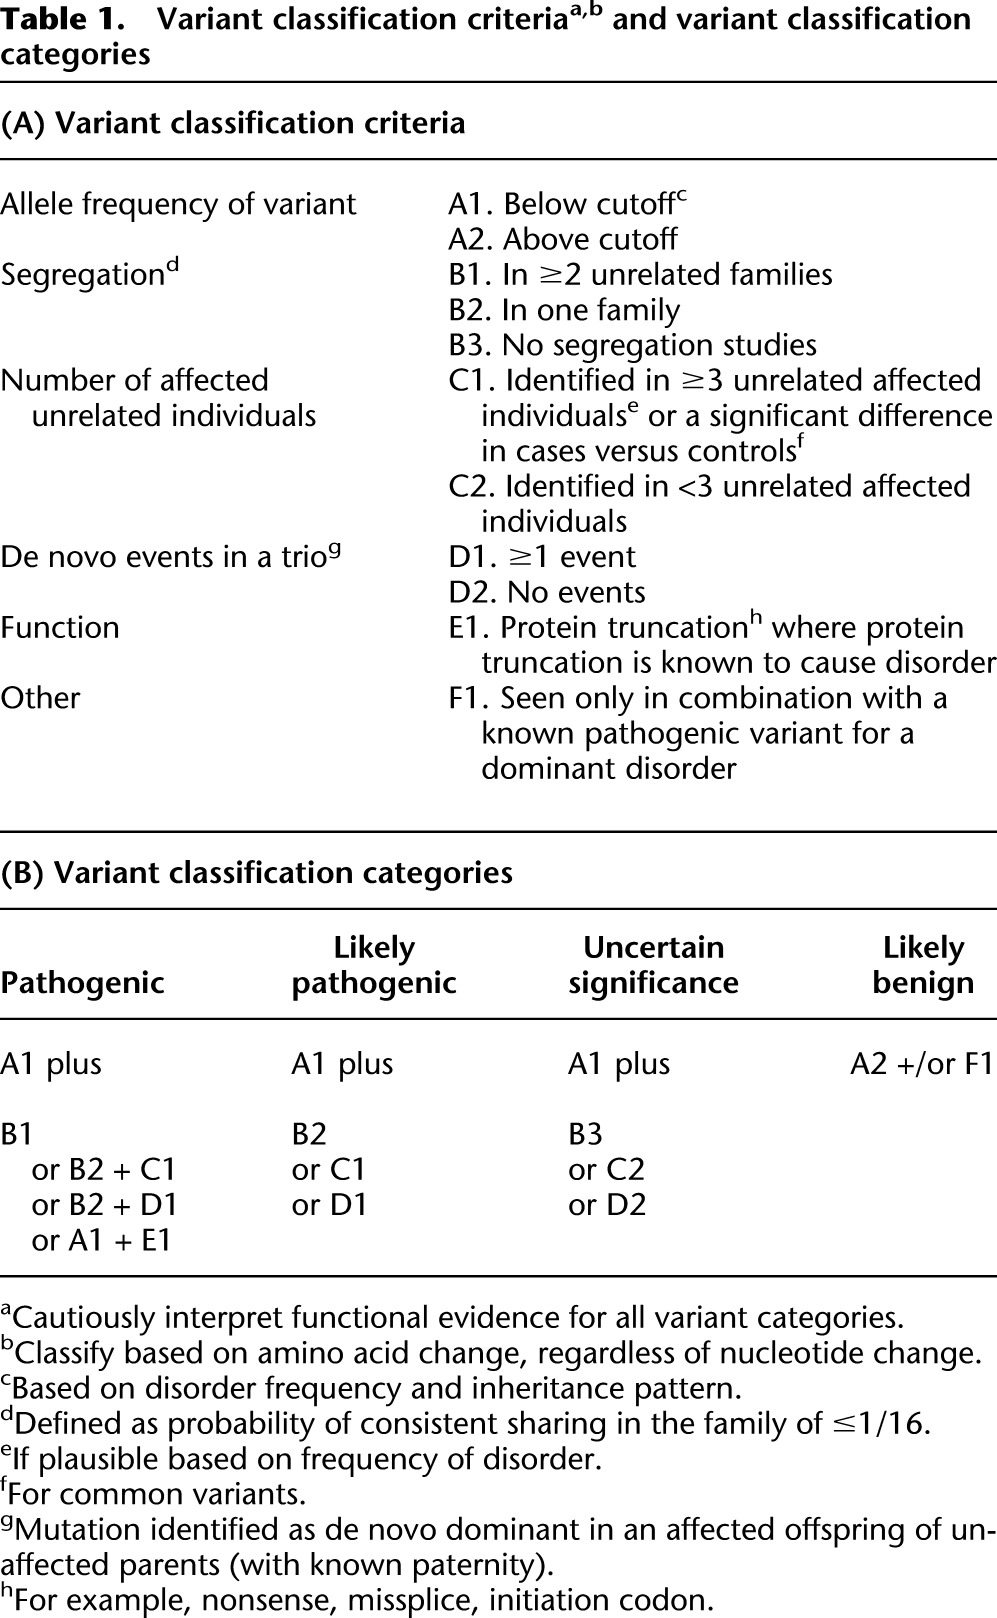
Variants in 112 genes paired with medically actionable phenotypes of interest were reviewed in the 6503 participants from the NHLBI ESP. The variant classification criteria and categories are presented in Table 1A and Table 1B, respectively. There were 615 distinct variants annotated in the Human Gene Mutation Database (HGMD) as disease causing in these 6503 participants’ exomes: 224 were identified in the original 1000 participants (500 European ancestry and 500 African ancestry) in Dorschner et al. (2013) and 391 additional variants in the remaining 5503 (4300 European-ancestry and 2203 African-ancestry) participants. This is attributable to the most common variants being identified in the first set analyzed, leaving fewer novel variants in the second set. Of the 615 unique variants, 116 (18.9%) variants had a minor allele frequency (MAF) greater than the allowable estimated disorder allele frequency and were not compatible with a highly penetrant disorder. On review of the literature, none of these 116 variants was classified as pathogenic or likely pathogenic by reviewers.
Table 1.
Variant classification criteriaa,b and variant classification categories
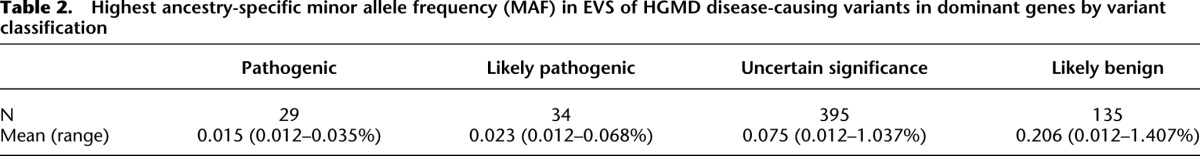
Most variants were observed more than once. Of the 599 variants in genes associated with dominant disorders, 44% (261/599) were seen only once. These singleton variants represented 51 (79.7%) of the 64 pathogenic or likely pathogenic variants in genes associated with dominant disorders. This frequency represented a significant excess of rare pathogenic variants relative to those variants observed more than once (P = 4.6 × 10⁻⁹). The distribution of the MAF of these variants for disorders inherited in an autosomal dominant pattern by classification is summarized in Table 2. The highest ancestry-specific MAF is a strong predictor of variant classification, excluding the likely benign class and variants in genes associated with recessive disorders (P = 0.01).
Table 2.
Highest ancestry-specific minor allele frequency (MAF) in EVS of HGMD disease-causing variants in dominant genes by variant classification
Variants classified as pathogenic or likely pathogenic
We used stringent criteria to classify variants as pathogenic or likely pathogenic given that we are addressing potential IFs. The details of the variant classification framework and review process are described in Methods. Variant classifications are summarized in Table 3 and the classification for each variant is given in Supplemental Table 1. We found 32 unique variants in 16 genes in all 6503 participants when considering the “pathogenic” variants from those annotated as disease causing in HGMD. The genes with these variants are summarized in Table 4 and the individual variants are listed in Supplemental Table 2. Pathogenic variants were found in 36/6503 (0.6%) of the ESP participants. Thirty-one participants had pathogenic variants in ACMG genes, whereas five had pathogenic variants in non-ACMG genes. Note that four of these 36 individuals were compound heterozygotes for two pathogenic variants assumed to be in trans in genes associated with disorders inherited in an autosomal recessive pattern. None of these 36 participants had more than one pathogenic or likely pathogenic variants in genes associated with dominant disorders. One individual was heterozygous for a pathogenic variant in ATP7B; however, this individual is not counted in the total number of participants with pathogenic results because carrier status was not considered reportable. Pathogenic variants were found in 30/4300 (0.7%) European-ancestry participants versus 6/2203 (0.3%) African-ancestry participants. No pathogenic variants were found in the 208 participants of Ashkenazi Jewish ancestry.
Table 3.
Summary of number of participants with variant classifications in 112 genes and the 56 ACMG genes
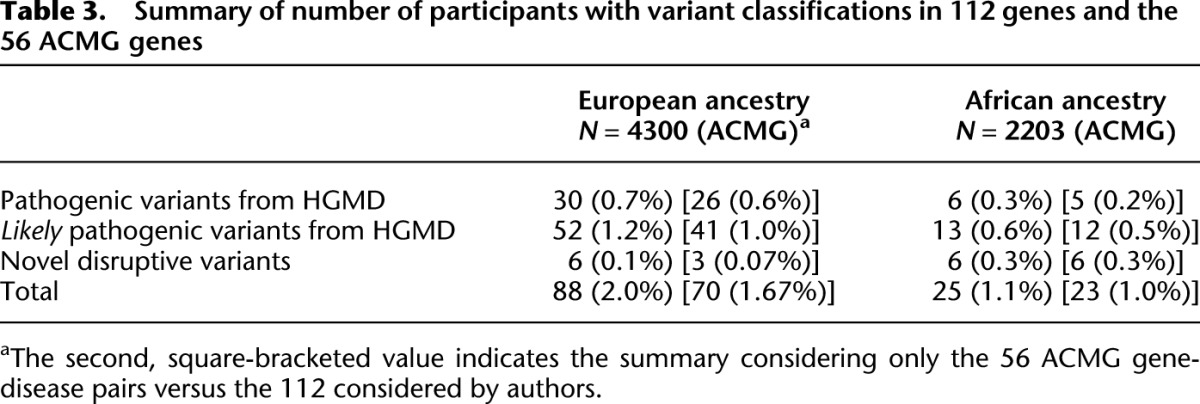
Table 4.
Pathogenic and likely pathogenic variants

We found 38 unique variants in 23 genes when evaluating the “likely pathogenic” variants from those annotated as disease causing in HGMD for all 6503 participants. The genes with these variants are summarized in Table 4, and the individual variants are listed in Supplemental Table 1. A total of 65/6503 (1.0%) ESP participants had likely pathogenic mutations. Three individuals were compound heterozygous for one pathogenic and one likely pathogenic variant assumed to be in trans in genes associated with disorders inherited in an autosomal recessive pattern. A total of 53/65 (81.5%) had likely pathogenic variants in genes for which pathogenic variants are recommended for return by the ACMG report. Of these 65 participants with likely pathogenic variants, 52 (80%) were of European ancestry and 13 (20%) of African ancestry. Four of the European ancestry individuals with likely pathogenic variants also had Ashkenazi ancestry.
Variants classified as expected pathogenic
“Disruptive” expected pathogenic variants were defined as truncating and missplice-causing variants in the EVS that are not identified by HGMD as disease causing. The classification process for these variants included identifying those within the part of the transcript that likely lead to nonsense-mediated mRNA decay and investigating if truncating and missplice-causing variants are known to cause the associated phenotype of interest. There were 11 of these expected “disruptive” variants that were not listed in HGMD as disease-causing variants (Supplemental Table 3). There was no significant difference in distribution of expected pathogenic variants between ancestry groups; of the 12 participants with such variants, six were in the African-ancestry group and six in the European-ancestry group (P = 0.12), although power was limited.
A flowchart summarizing the number of HGMD disease-causing variants and non-HGMD expected disruptive variants reviewed, and the classifications of these variants in ACMG and non-ACMG genes, is presented in Figure 1.
Figure 1.

Variants reviewed and classifications in actionable ACMG and non-ACMG genes: (P) pathogenic; (LP) likely pathogenic; (VUS) variant of uncertain significance; (LB) likely benign; (EP) expected pathogenic.
Ancestry differences in identification of pathogenic or likely pathogenic variants
The number of pathogenic or likely pathogenic variants in individuals of African and European ancestry was compared. Among all 6503 subjects, the participants of African ancestry had fewer pathogenic or likely pathogenic variants annotated in HGMD (Table 3) than those of European ancestry, consistent with the prior analysis of 1000 participants. Only 19 (18.8%) of the 101 participants with likely pathogenic or pathogenic variants were in individuals of African ancestry, again significantly less than the proportion (2203/6503, 33.8%) that would be expected at random under the null hypothesis (binomial test P = 0.0004). This result replicates the previously reported deficit of HGMD derived pathogenic or likely pathogenic variants among African-ancestry individuals.
Median time and concordance in double review of variants
The time spent for the literature review and categorization step for each HGMD disease-causing variant by the initial reviewer was recorded. The median recorded time was 37 min (range: 1–175 min). This time did not include the time to generate the list of potential variants, collect the references, or resolve variants by secondary review.
Several quality control exercises were undertaken including the examination of 156 of the 615 disease-causing HGMD variants by a second reviewer. In addition, all variants initially classified as pathogenic or likely pathogenic (79) were reanalyzed by an experienced reviewer. Of the 156 variants that were initially double reviewed, 83 (53%) of the classifications were discrepant. Of the 79 variants initially classified as pathogenic and likely pathogenic that underwent blinded expert review, 56% (44/79) were reclassified. Nearly all of these reclassifications (42/44) were from the pathogenic or likely pathogenic classification to the variant of uncertain significance (VUS) classification. A repeated error was counting EVS participants as a person who is affected with the disorder and has the variant, even though the phenotypes of those participants were unknown. This was compounded when papers had reported the variants in EVS without relevant phenotype information for specific disorders (e.g., cardiomyopathy). As a result, all articles summarizing EVS data were identified, and the named variants were re-reviewed to be sure that papers referring to EVS data were not included in the calculation of the number of affecteds carrying the variant of interest. Geneticists of all experience levels made classification errors.
Variant classifications were compared with those collected through the Sharing Clinical Reports Project (SCRP). There was complete agreement (45/45) between classifications from the SCRP and those made by our reviewers. The classification of variants reviewed by both this project and the Partners Laboratory for Molecular Medicine (LMM) were also compared and agreement was high (97/99, 98%) (Supplemental Table 4). A summary of the evidence supporting the two different classifications is also presented. These few discrepancies are due, in part, to differences in classification criteria, including Partners LLM’s inclusion of in silico predictions and use of functional data as supporting pieces of evidence, as well as reducing the significance of a variant when it has been reported in a person with an alternate explanation of the disorder. These results demonstrate that discrepant variant classifications may result even when the same public resources are used when different types of evidence are given different weights.
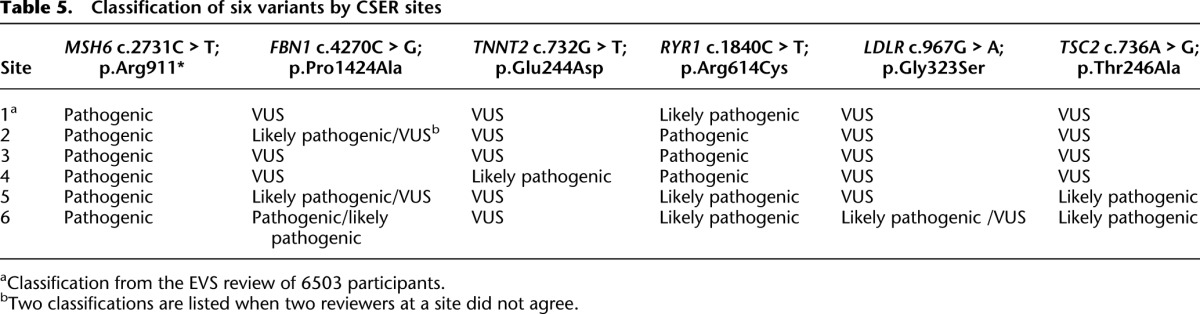
In addition, six variants were randomly selected within groups of varying pathogenicity assignments and were classified blindly by five research and clinical laboratories within the Clinical Sequencing Exploratory Research (CSER) consortium (http://www.genome.gov/27546194) according to their routine laboratory procedures. These variants along with each laboratory’s classification are listed in Table 5. Complete agreement was attained only for the truncating variant; in contrast, for one variant, classification ranged from pathogenic to variant of uncertain significance. One laboratory appeared to have a lower threshold for calling variants likely pathogenic than the others. This difference in threshold raises concern for the consistency of variant assignments across laboratories. An investigation of the basis for discrepant classifications (data not shown) found that discrepancies appeared to result from differences in how cosegregation was used, how functional and in silico evidence were weighted, as well as in differences in resources used among reviewers.
Table 5.
Classification of six variants by CSER sites
Association of in silico pathogenicity scores with pathogenicity assignment
To address the utility of incorporating in silico pathogenicity scores into the interpretation of variants, Genomic Evolutionary Rate Profiling (GERP) and Combined Annotation Dependent Depletion (CADD) scores were compared across pathogenicity assignments (Table 6; Fig. 2). As previously noted, these scores were not used in our classifications. High CADD and GERP scores were found in all pathogenicity categories. Low and negative scores were seen more often in the likely benign class, while all variants in the pathogenic class had GERP ≥ 2.95 and CADD ≥ 12.37.
Table 6.
GERP and CADD scores for nondisruptive variants by classification
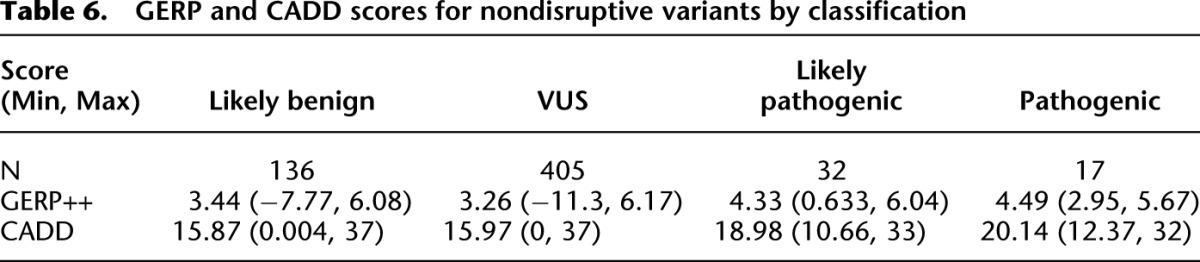
Figure 2.

GERP versus CADD scores of pathogenic, likely pathogenic, and likely benign nondisruptive variants for dominant disorders. Likely benign variants with a GERP score of less than −1.0 are shown with their corresponding CADD scores along the −1 x-axis. Their true coordinates are (GERP, CADD): (−7.77, 0.15), (−7.34, 0.00), (−5.43, 1.93), (−4.01, 11.16), (−2.76, 8.66), (−2.25, 0.66).
Discussion
We have analyzed exomes of 6503 ESP participants for variants in 112 medically actionable genes. We found that some 2.0% of adults of European ancestry and 1.1% of adults of African ancestry can be expected to have actionable highly penetrant pathogenic (including novel expected pathogenic) or likely pathogenic single-nucleotide variants (SNVs). If we analyze only pathogenic variants in the subset of genes that are included in the ACMG recommendations for reporting of IFs (Green et al. 2013), the proportion of individuals with returned IFs would be 0.7% in European-ancestry participants and 0.5% in African-ancestry participants.
Our classification of these reviewed variants is expected to be useful to clinical geneticists who commonly consult the EVS to determine allele frequencies and when evaluating SNV pathogenicity. Based on the few differences in our classification and those of Partners LMM, we may be overcalling variants that are truly VUS as likely pathogenic, as all of our differences are of this type. These data are based on contemporary variant databases and such databases are expected to include more classified variants over time. Our variant classifications in Supplemental Table 1 are annotated for which variants might be moved to a lower class if the base position’s evolutionary conservation were incorporated into our criteria. The use of conservation would not affect the classifications of any variants we classified as pathogenic.
Notably, these data do not suggest that <2% of individuals will have abnormal genomic tests. Abnormal tests will also include results for the primary indication, copy number variants, and nonactionable disorders, none of which are considered in these analyses. Further, we consider only high penetrance variants. The results presented here reflect expected actionable IFs from SNVs identified in exome sequencing.
This report is consistent with the proportion of participants with pathogenic variants estimated for the non-Ashkenazi ancestry participants in ClinSeq, despite differences in criteria for classification. Considering 37 cancer risk genes, ClinSeq found four of 475 non-Ashkenazi (0.8%) participants had pathogenic variants, whereas four of 97 participants of Ashkenazi ancestry (4.1%) did (Johnston et al. 2012); seven of these eight variants were in BRCA1 or BRCA2. We considered 34 of the 37 genes included by ClinSeq. ClinSeq reported no pathogenic variants in the remaining three genes: RB1, WT1, and CDKN2A. Examining only those 34 genes in the non-Ashkenazi ancestry group separately, our proportion of participants with pathogenic variants did not differ with those of ClinSeq (both P = 0.78). Alternatively, for those of Ashkenazi ancestry, our data was not comparable to that of ClinSeq due to our lack of insertion and deletion (indel) data. BRCA1 or BRCA2 founder mutations, all indels, have been reported to be found in 2.4% of 3742 Ashkenazi ancestry women (Hartge et al. 1999).
The proportion of participants with pathogenic and likely pathogenic variants reported here is slightly lower than that reported in our previous work with 1000 EVS samples (Dorschner et al. 2013). The revised estimates are likely due to (1) imprecision related to the smaller sample size, and (2) the absence of double review of all pathogenic and likely pathogenic variants in the original paper. After correction following double review, 2.4% of the original 500 European-ancestry participants and 0.8% of the original 500 African-ancestry participants had pathogenic or likely pathogenic SNVs.
The estimates reported here of ∼2.0% of adults of European ancestry and 1.1% of adults of African ancestry having high penetrance actionable variants are substantially different from the estimate of 5% of participants (14 variants in 27 of 543 participants, with each variant only seen in a single family) expected to have a pathogenic variant in one of the 56 ACMG genes (but not limited to ACMG gene-phenotype pairs) recently published by Lawrence et al. (2014). These authors attributed differences in their estimates and those published in our prior paper on 1000 participants (Dorschner et al. 2013) to a variety of factors; however, it appears that their inclusion of family data, extension of phenotypes, and differences in classification criteria were the major factors. First, nearly half of the variants they reported as pathogenic (13/28) were the second occurrence of a variant in the same family, with the double counting yielding a higher estimate than might be found in unrelated individuals. Despite 13/14 variants being observed in two participants, none of their families was clearly segregating the phenotypes of interest. Second, although the ACMG suggests gene-disease pairs for highly penetrant actionable disorders, Lawrence et al. (2014) considered a different phenotype than the ACMG for five of their 14 variants, did not consider MAF, allowed fewer meiotic segregations to count as evidence, and relied heavily on functional assays. Interestingly, the participant they report with a putative pathogenic APOB variant had a normal lipid profile. As the authors note, we classified three of their putative pathogenic variants as VUSs. Of these, SCN5A T220I is also classified by Partners LMM as a VUS. Also, CACNA1S T1354S was seen 48 times in the 6503 EVS participants, yet the relevant disorder, malignant hyperthermia, would be expected in only one person in this cohort; this variant therefore was reclassified as benign for this phenotype by the NIH ClinSeq project (Gonsalves et al. 2013), despite abnormal in vitro function (Pirone et al. 2010). These lines of evidence suggest that the Lawrence et al. (2014) publication overestimates IFs. Further, it appears that the phenotypes considered and their classification criteria, not deeper exome coverage, are the critical factors contributing to their higher estimate.
The larger sample reported here confirms the deficiency of literature-derived HGMD pathogenic variants in those of African versus European ancestry that we previously reported (Dorschner et al. 2013). This deficit occurs in the portion of variants identified from the literature (summarized in HGMD) rather than in novel disruptive variants in which the proportion of variants identified in African-ancestry and European-ancestry individuals was the same. This is likely due to the underrepresentation of individuals of African ancestry in the literature or databases.
Even with clear criteria, there appears to be substantial inter-reviewer discordance and a bias toward classifying variants into higher pathogenicity categories. Discrepancies between any two reviewers of a variant were common (83/156, 53%). In the process of adjudication, the final classification of a variant generally agreed with the reviewer who initially assigned it the lower pathogenicity score. It is possible that had reviewers each considered more than 10–15 assigned variants then review would have become more consistent. High discordance among reviewers leads to some concern about plans for crowd-sourced variant classification.
Our findings suggest that discordant classification can be overcome by using multiple data sources and many experts providing input. Indeed, we had 100% concordance of our final variant classifications with the SCRP (N = 45) and 98% concordance with the Partners LMM (N = 99). Additionally, despite use of different criteria, the most common classifications made by the CSER laboratories also matched our classifications.
The criteria for pathogenicity classification should be standardized across laboratories in a way that promotes consistent determinations. A new ACMG classification proposal has been presented and is under internal review; however, this was unavailable when the University of Washington Return of Results Committee (RORC) began, and we opted for a simpler system that worked well, but that might have been improved by the consideration of in silico data. We consider six lines of evidence to be most important for variant classification:
Population minor allele frequency was a useful factor for variant classification, and variants observed only once in EVS were most likely to be pathogenic, supporting inclusion of MAF in classification criteria (Table 2). MAF is used by most classification systems (Duzkale et al. 2013; Eggington et al. 2013; Thompson et al. 2014) and by the ACMG draft guidelines. Highly penetrant alleles should be considerably less common than the associated dominantly inherited disorder, particularly as most disorders have high allelic heterogeneity. In general, high allele frequency in any ancestry group is evidence against pathogenicity, particularly for dominant disorders; however, founder mutations in populations with a high incidence of the associated disorder should be taken into account.
Although we did not use in silico pathogenicity scores, we find that lower conservation scores may be of utility in categorizing variant pathogenicity. In these data, variants classified as pathogenic had GERP > 2.95 or CADD > 12.37, but high GERP and CADD scores were seen across all variant classification categories. Using a GERP < 2 as a criterion to lower the pathogenicity assignment for nondisruptive variants by one level would result in two of 32 likely pathogenic variants being reclassified as variants of uncertain significance, and 84 variants classified as uncertain significance would be reclassified as likely benign. Variants with higher in silico prediction scores would be more likely to be published and thus cited in HGMD; therefore, our analysis does not suggest that the high scores are unreliable, but that when taken in context of published literature, those with high scores may not be as helpful as low scores in identifying false positive reports of pathogenicity. In silico algorithms, particularly measures of evolutionary conservation, are considered in several other classification systems (Duzkale et al. 2013; Eggington et al. 2013; Thompson et al. 2014). However, the numerous tools can yield disparate results for any one variant.
Cosegregation of variant and disorder within families is useful for variant classification, but needs to be carefully defined. One reason for a discordant CSER laboratory classification was differing weighting of cosegregation data reported in the literature. To address this, the statistic for defining cosegregation in a pedigree should be established. The probability of variant sharing in the pedigree (e.g., one-half for an affected parent-child pair) is a simple number to compute and interpret. The odds ratio is simply 1 divided by that probability (2 for an affected parent-child pair), and the LOD score is the log base 10 of the odds ratio (0.3 for that pair). All of these numbers can be computed across multiple families with equal ease and, of these, the probability stated as a fraction is most intuitive. We found that computation of probability can vary if reviewers do not consider lack of the variant of interest in unaffected individuals in their cosegregation evidence and whether adjustments are made for incomplete or age-dependent penetrance. There is some disagreement regarding the level of cosegregation that should be considered evidence for pathogenicity. In this context, it is important to acknowledge that we are not mapping genes with a small prior probability of being at one specific site on the genome, for which a LOD score of 3 or 3.3 would be a usual criterion. Instead, we know the location of our genes of interest, though there may be dozens of genes of interest for a cardiomyopathy and only one for some disorders. For this reason a lower threshold is likely warranted. The Next Medicine RORC somewhat arbitrarily selected a probability of 1/16, due to its proximity to a P-value of 0.05. Others have suggested lower (Thompson et al. 2014) or higher thresholds (Duzkale et al. 2013; Eggington et al. 2013). Whatever threshold can be agreed on, we support the need to have a second line of evidence that supports pathogenicity in addition to cosegregation in a single family. This is because it is possible, though generally unlikely in the era of full coding sequencing, to have the correct gene segregating with disease but to have missed the true pathogenic variant and instead identified a benign variant in cis. Therefore, in addition to quantifying segregation, additional variant-specific evidence is needed.
Co-occurrence of variant with disorder is a well-accepted criterion that can be identified by careful case-control studies for more common variants. However, this evidence can be misapplied by comparing data from two studies, which should be done with great caution. Additionally, variants common enough to have been tested in a case-control study are often not highly penetrant. For very rare variants, statistically significant case-control comparisons will be unavailable. We looked for three or more affected unrelated individuals with a variant as a major component of our evidence criteria, in agreement with the criteria proposed for classifying incidental findings in 61 genes associated with cardiomyopathy and arrhythmia (Ng et al. 2013). However, we recognize that others could suggest higher or lower thresholds, depending on the desired positive predictive value and sensitivity.
Novel or very rare truncation variants expected to lead to nonsense-mediated decay and loss of canonical splice sites, when haploinsufficiency is known to cause the associated disorder, can be considered to be highly predictive of pathogenicity. This prediction can be confounded by a number of issues. For example, the truncation variants at the 3′ end of the gene may not be subject to nonsense-medicated decay, and thus may not cause the same phenotype as haploinsufficiency. Therefore, we excluded such variants. However, the exact location no longer susceptible to nonsense-mediated decay is likely to be gene specific and will depend on which exons are transcribed. As noted elsewhere, noncanonical splice site variants may require mRNA testing to determine if missplicing occurs and at what rate (Eggington et al. 2013).
A de novo mutation in an individual with a de novo disorder is evidence of pathogenicity as acknowledged by others (Duzkale et al. 2013). However, these data are rare in the literature and it is important to prove parentage when concluding that any variant is de novo (Biesecker 2012).
Other considerations have been proposed. We did not consider functional data, such as in vitro assays. We do recognize that some evidence can be very predictive. It is critical to use evidence from functional assays that are highly correlated with the associated disorder (MacArthur et al. 2014) and sufficiently validated with known variants. These assays are not widely available and we believed that their inclusion in our criteria would lead to poor and inconsistent classifications. The development and cataloging of reliable assays should be a high priority for our field. Myriad Genetics, Inc. considers “history weighting” data (Eggington et al. 2013). This considers that patients with true mutations should have the disorder in their families, even in the absence of cosegregation data. Similarly, Myriad Genetics and others (Duzkale et al. 2013) consider that, for a dominant disorder, when a variant is seen in trans with a known pathogenic variant in an affected person, that is evidence against pathogenicity. Finally, expert databases are considered by some. We did accept Myriad BRCA1 and BRCA2 variant classifications because they have a large amount of data that is not public. However, when possible, evaluation of the primary data supporting the variant classification is optimal.
An important limitation of our study is our inability to assess if the participants were ascertained based on phenotypes that enriched for any of the pathogenic or likely pathogenic variants identified. This might lead to an overestimate of the frequency of such IFs. Of most concern, several cohorts were enriched for lipid disorders, vascular disease, or chronic obstructive lung disease. This could have led to enrichment in LDLR and SERPINA1 pathogenic variants. However, we do not see a marked excess in pathogenic or likely pathogenic variants in these genes, considering that the population frequencies of these disorders in participants of European ancestry are 1/500 for familial hypercholesterolemia and between 1/500 and 1/3500 for alpha-1-antitrypsin deficiency (Rader et al. 2003; Kircher et al. 2014). Similarly, the number of variants classified as pathogenic or likely pathogenic for disorders expected to be at usual population frequencies were in the expected range, supporting the classifications for variants in genes such as BRCA1or BRCA2 and those for Lynch syndrome (Janavicius 2010; Hampel and de la Chapelle 2011), expected to be found in 1/350 to 1/1000 people.
A second limitation is that some pathogenic variants may have been missed due to incomplete exome coverage or our inability to consider indels. However, as seen in Supplemental Table 5, only six genes associated with dominant disorders and two genes associated with recessive disorders had less than eightfold coverage of 90% of the coding regions. Indels and copy number variants (CNVs) may be missed in our analyses due to limitations in calling these types of variants by the exome sequencing shorter read length (50 base pairs) technology used when the ESP data was generated. However, indels and CNVs are not known to comprise a large portion of the known pathogenic variants for most disorder-gene pairs considered.
A third limitation is that this estimate of the frequency of IFs expected to be returned from exome sequencing results may not be generalizable to other ethnic groups or to children. We only considered gene-disease pairs in which the disorder could remain undiagnosed in adulthood. The addition of genes associated with disorders that would manifest before adulthood might result in more returned results.
A fourth limitation is the use of HGMD to identify potential pathogenic variants for review. It is possible that a small number of known pathogenic or likely pathogenic variants exist in the EVS that have not been published and thus would not be contained in the HGMD database. However, in the absence of a HGMD entry, it is unlikely enough data would be available for other than a VUS classification. The review of all expected disruptive variants also decreased this likelihood.
With regard to returning these results to the ESP participants, the primary authors do not have access to these cohorts. However, each cohort can address return separately. A substantial proportion of the sample contributing to the ESP included participants from one of six NHLBI cohorts in the HeartGO Consortium, including the Multi-Ethnic Study of Atherosclerosis (MESA), Framingham Heart Study, and Jackson Heart Study. Many participants in these cohorts provided consent to be recontacted for return of actionable genetic research results. Findings from the current study will inform future plans for return of results to consenting research participants.
In summary, we find that ∼2.0% of adults of European ancestry and 1.1% of adults of African ancestry can be expected to have actionable highly penetrant pathogenic or likely pathogenic SNVs identified by exome sequencing at this time. These estimates are reduced to 1.6% and 1.0% for pathogenic or likely pathogenic variants in genes for which the ACMG recommends review and return of IFs to adults. Individuals of Ashkenazi ancestry are expected to have a higher rate of pathogenic variants due to founder mutations alone (Hartge et al. 1999). In addition, reviewers are likely to be inconsistent in their categorizations and biased toward more pathogenic categories. This suggests the need for simple, consistent criteria for classifying variant pathogenicity and improved variant-specific databases and knowledge bases. Finally, current literature identifies fewer pathogenic variants in those of African ancestry, likely due to the underrepresentation of these individuals in clinical and research studies.
Methods
Gene list development
The list of 112 actionable genes paired with diseases was agreed upon unanimously by the University of Washington National Human Genome Research Institute (NHGRI)-funded CSER “NEXT Medicine study” RORC; this committee, its membership, and process are detailed elsewhere (Dorschner et al. 2013). “Actionable” genes in adults were defined as having deleterious variant(s) whose penetrance would result in specific, defined medical recommendation(s) that are supported by evidence, the implementation of which would be expected to avoid significant morbidity and mortality. The benefit of intervention must be sufficient to counter any anxieties raised by the identification of an unexpected predisposition to a disorder. The University of Washington NEXT Medicine study is developing an actionable variant database for an adult population, and the EVS has ESP cohorts that were largely adults at the time of recruitment, and thus, may exclude subjects with pediatric disorders. For these reasons, only gene-disorder pairs that might remain undiagnosed in adulthood were included. The list of genes determined to date to have actionable variants has been previously published (Berg et al. 2013; Dorschner et al. 2013) and is continually updated as new and putative gene-disease associations are reviewed. Since the publication of Dorschner et al. (2013), three genes have been added to the list (MAX, TGFB2, and TMEM127) and five genes have been removed: (GPD1L, HCN4, KCNE3, SCN1B, and SCN3B). These five genes were removed based on RORC consensus that the evidence to support the gene-disease association did not reach the threshold for inclusion. The list of actionable genes is likely to grow as evidence for novel genes accumulates; however, it is likely that further genes will be rarer and rarer causes of disease and therefore a source of IFs. The full list of gene-disease pairs along with the percentage of each gene’s coding region covered by the ESP sequencing technology is in Supplemental Table 5.
Criteria for classification of variants
Given that we are addressing potential IFs, our criteria for the classification of highly penetrant pathogenic variants (Table 1A,B) were stringent. Each variant from HGMD was classified as “pathogenic,” “likely pathogenic,” “variant of uncertain significance” (VUS), or “likely benign.” Additionally, we defined “disruptive” expected pathogenic variants as truncating and missplice-causing variants not identified by HGMD as disease causing. We did not assign variants to the “benign” category, as all variants selected for review were either listed as disease-causing variants in HGMD or were disruptive SNVs (predicted to cause a premature termination or missplice). Finally, we accepted Myriad BRCA1 and BRCA2 variant classifications that were known to us because their classifications use data that are not available.
Multiple sources of data were evaluated to classify the pathogenicity of each variant. Ancestry-specific allele frequencies from the EVS were used to exclude variants that were too common to be highly penetrant pathogenic variants for the relevant disorder, based on the prevalence of the disorder. The references cited by HGMD Professional 2013.3 (Stenson et al. 2009), PubMed, and Google were evaluated. Additional supporting references for each variant were searched for in other databases, including the Leiden Open Variant Databases (LOVD), ClinVar, and InSiGHT, and these references were also reviewed. Variants in some of the genes of interest were also associated with disorders that were not considered highly actionable (e.g., RYR1 may be associated with neuromuscular disease as well as the target phenotype malignant hyperthermia), or their association with disease was not established to our required evidence level. Only variants putatively producing the phenotype of interest were considered pathogenic.
Participants and variant selection
The NHLBI ESP has 6503 participants whose variants are summarized on the EVS. We had previously evaluated variants in 1000 participants (500 European ancestry and 500 African ancestry) and now have evaluated variants in the remaining 5503 participants. These variant annotations were derived from accessing the ESP database on November 7, 2013, using the EVS version v.0.0.22. We pooled these data to improve ancestry-specific estimates. ESP participants are from 18 cohorts with heart, lung, and blood phenotypes. Further details regarding these phenotypes are available on the ESP website (http://evs.gs.washington.edu/EVS/). The sequence data from this study have been submitted to the NCBI database of Genotypes and Phenotypes (dbGaP; http://www.ncbi.nlm.nih.gov/dbgap) under accession numbers phs000254.v2.p1, phs000279.v2.p1, phs000281.v5.p3, phs000290.v1.p1, phs000291.v2.p1, phs000296.v3.p2, phs000327.v1.p1, phs000334.v1.p1, phs000347.v1.p1, phs000362.v1.p1, phs000398.v2.p1, phs000399.v1.p2, phs000400.v3.p1, phs000401.v7.p9, phs000402.v2.p1, phs000403.v3.p3, phs000422.v1.p1, phs000518.v1.p1, phs000546.v1.p1, phs000556.v1.p1, phs000581.v1.p1, phs000582.v1.p1, phs000587.v1.p1, and phs000632.v1.p1.
Ancestry was inferred from analysis of principal components (Patterson et al. 2006; Price et al. 2006). It has been previously reported that ∼3.2% of the entire cohort of 6503 participants have Ashkenazi ancestry (Dorschner et al. 2013). All of these 6503 participants’ exome variants were reviewed for the 112 genes paired with phenotypes of interest (so that the initial 1000 participants were investigated for variants in the three new genes) for any SNV listed as disease causing in HGMD and any disruptive expected pathogenic variants. Indels were not included due to difficulty of accurately calling these with the shorter read length used in generating the ESP sequence data. Variants with a MAF greater than 0.005 in genes associated with autosomal dominant disorders were not evaluated as they were too common to be considered a highly penetrant pathogenic variant for a dominant disorder given the frequencies of the disorders under consideration. This is the same allele frequency used as a threshold by the International Society for Gastroenterology and Hereditary Tumors (InSiGHT) (Thompson et al. 2014). We did not eliminate the possibility of low penetrance pathogenic variants with MAF > 0.005. A single reviewer classified 20 variants with MAF < 0.005, but with 10 or more occurrences in EVS (MAF ∼0.0008). Variants for disorders inherited in an autosomal recessive pattern were reviewed regardless of MAF, but only when a single participant had two potentially pathogenic variants, each annotated in HGMD or considered disruptive. We assumed that the recessive variants were carried on separate alleles, in trans, as this is more likely than the variants being in cis. Carrier status was not assessed in this study.
Expert variant review of EVS variants
Each of 52 expert reviewers considered a subset of all potential pathogenic variants. All reviewers were geneticists or reviewed with a geneticist partner: 48 were clinical geneticists, genetic counselors, or molecular geneticists, and the remainder had significant relevant genomic expertise. Each reviewer was provided an Excel spreadsheet with detailed information on the 10–15 variants assigned to them for classification and links to publications cited in HGMD. They were each asked to determine whether the allele frequency was less than a disease-specific maximum frequency (DAF) and to review the primary literature and databases to document these data and to determine if the evidence met the pathogenicity criteria (Table 1A,B). Reviewers were instructed to calculate the maximum allowable allele frequencies for each disorder under a conservative model, which included the assumption that the given disorder was wholly due to that variant considering the mode of inheritance of the disorder. When disorder frequencies were unknown, reviewers were asked to conservatively overestimate. Reviewers were provided with total minor allele frequency and ancestry-specific allele frequencies from EVS and from the 1000 Genomes Project data (Brownstein et al. 2014) for each variant. Reviewers were instructed to ignore the first occurrence of the variant when considering the EVS derived MAF, because all SNVs were ascertained from the EVS, biasing the MAF upward. We did not have EVS identifiers or phenotypes, so that genotype–phenotype correlation was not possible. Reviewers were trained on all aspects of review by an in-person conference or a videoconference, and a YouTube training video was available for reference at all times (https://www.youtube.com/watch?v=fa01IZzNc20). The training video file can also be accessed in the Supplemental Material. A genetic counselor was available at all times to answer questions, and articles that reviewers could not locate were provided to them.
Each reviewer filled out a spreadsheet that summarized the findings relevant to the pathogenicity categorization; these data were reviewed by a genetic counselor to ensure that the classification matched the evidence summarized by the reviewer. Reviewers recorded the time in minutes it took to review each variant and were asked to nominate very difficult-to-categorize variants for committee review.
Classification of non-HGMD disruptive variants
Any variants in the first 90% of the predicted amino acid sequence that were not listed in HGMD as disease-causing variants but may introduce a premature termination codon directly or as a result of ±1,2 splice site variant were also evaluated. We did not include variants at the 3′ end of the gene that met the “position-of-an-exon-exon-junction” rule of being <50 nucleotides from the final exon–exon junction to be expected to escape nonsense-mediated decay of the mRNA (Maquat 2004; Conti and Izaurralde 2005) and result in functional protein products, albeit sometimes pathogenic products (Isidor et al. 2011). We reviewed whether truncating variants were reported to cause the disorder of interest. Literature, ClinVar, and other relevant databases were reviewed to search for prior reports of these variants. In rare cases, available expert knowledge of the pathogenic variant spectrum for certain genes and disorders was also taken into account.
Classification quality control
For quality control, initially 25% (156/615) of the variants were also examined for pathogenicity by a second reviewer, blinded to the first review. Discordant classifications were reanalyzed by an experienced third reviewer. Discordance between reviewers was evaluated in a number of ways, including comparison of reviewers who had participated in the prior analysis (Dorschner et al. 2013) and those who had not. Several reviewers made systematic errors, such as including EVS participants with unknown phenotype as affected with the disorder; such variants were reclassified by a second, experienced reviewer. Additionally, to minimize erroneous classifications, all variants that were initially classified as pathogenic or likely pathogenic were evaluated by a second, experienced reviewer.
Comparison with other variant classification systems
All variant classifications from the initial 1000 ESP participants and from the remaining 5503 ESP participants with a MAF <0.0008 (n = 595) were compared to classifications by the Partners LMM (http://personalizedmedicine.partners.org/Laboratory-For-Molecular-Medicine/Default.aspx) and collected through the SCRP (http://sharingclinicalreports.org/). In addition, six variants were randomly selected within groups of varying pathogenicity assignments and were classified blindly by five research and clinical laboratories within the CSER consortium (http://www.genome.gov/27546194) according to their routine laboratory procedures.
Evaluation of pathogenicity measures
We evaluated two measures of predicted pathogenicity, GERP mammalian conservation scores and the CADD summary score of conservation, substitution, and regulation (Cooper et al. 2005; Davydov et al. 2010; Kircher et al. 2014), to determine if these scores were correlated with pathogenicity classification. Scores for nondisruptive variants in genes associated with dominant and recessive disorders were compared across pathogenicity assignments. These measures were not used as part of our classification criteria, which allowed us to assess their utility in predicting classification.
Statistical analyses
One-sided binomial tests were used to evaluate whether variants seen only once, versus those seen more than once, were seen in excess among 64 pathogenic or likely pathogenic variants in genes associated with dominant disorders. Disruptive variants not listed as disease causing in HGMD were excluded from this exercise. The null hypothesis that the MAF of each variant was independent of pathogenic, likely pathogenic, and variant of uncertain significance (VUS) classifications was tested using an analysis of variance (ANOVA). We excluded the likely benign class from this test, as many variants were placed in this class due to their high MAF. This test considered only variants in genes associated with dominantly inherited disorders, given that variants in genes associated with disorders with a recessive inheritance pattern would have different MAF ranges. Further, this test considered the higher ancestry-specific MAF for each variant because a higher MAF in either population would be considered evidence of a benign variant.
Data access
All 626 variant annotations have been submitted to the NCBI ClinVar (http://www.ncbi.nlm.nih.gov/clinvar) under submitter name CSER_CC_NCGL.
Supplementary Material
Acknowledgments
We thank Joshua Akey for sharing his group’s ancestry analyses. This work was funded by the NIH, NHGRI/NCI U01HG006507, U01HG007307, U01HG006375, U01HG006485, U01HG006500, U01HG006546, UM1HG007301, UM1HG007292, U01HG006487, U01HG006492, U41HG006834, U41HG006834, NIH/NIGMS T32 GM007454, 1K23HL114724, 5P30CA015704, Burroughs Wellcome Fund (WMG), and Washington State Life Sciences Discovery Fund (2065508, to the Northwest Institute of Genetic Medicine). The authors wish to acknowledge the support of the National Heart, Lung, and Blood Institute (NHLBI) and the contributions of the research institutions, study investigators, field staff, and study participants in creating this resource for biomedical research. Funding for GO ESP was provided by NHLBI grants RC2 HL-103010 (HeartGO), RC2 HL-102923 (LungGO), and RC2 HL-102924 (WHISP). The exome sequencing was performed through NHLBI grants RC2 HL-102925 (BroadGO) and RC2 HL-102926 (SeattleGO). Dr. Pritchard is supported by a 2013 Prostate Cancer Foundation Young Investigator Award. The NEXT Medicine return of results committee included A.M., B.W., B.S., C.G., D.N., F.H., G.J., J.P.E., J.K., J.B., K.L., L.A., M.D., M.M., P.B., R.B., R.S., S.M.F., T.B., V.S., W.R., W.G., and W.B. The variant reviewers were A.J., A.D.J., A.S., B.S., C.G., D.H., D.K., E.R., E.J., E.T., F.H., G.J., H.T., J.B., J.R., J.S., J.R., J.K., J.B., J.S., K.F., K.J., K.T., K.C., K.L., L.A., L.C., L.K., L.B., L.R., M.T., M.D., M.D., M.M., N.S., O.G., P.B., R.H., R.B., R.S., S.L., S.R., S.M., T.W., W.R., W.B., and X.G.
Footnotes
[Supplemental material is available for this article.]
Article published online before print. Article, supplemental material, and publication date are at http://www.genome.org/cgi/doi/10.1101/gr.183483.114.
Freely available online through the Genome Research Open Access option.
References
- American College of Medical Genetics and Genomics 2014. ACMG updates recommendation on “opt out” for genome sequencing return of results. https://www.acmg.net/docs/Release_ACMGUpdatesRecommendations_final.pdf.
- Berg JS, Amendola LM, Eng C, Van Allen E, Gray SW, Wagle N, Rehm HL, DeChene ET, Dulik MC, Hisama FM, et al. 2013. Processes and preliminary outputs for identification of actionable genes as incidental findings in genomic sequence data in the Clinical Sequencing Exploratory Research Consortium. Genet Med 15: 860–867. [DOI] [PMC free article] [PubMed] [Google Scholar]
- Biesecker L. 2012. Improving the rigor of mutation reports: biologic parentage and de novo mutations. Hum Mutat 33: 1501–1502. [DOI] [PMC free article] [PubMed] [Google Scholar]
- Brownstein CA, Beggs AH, Homer N, Merriman B, Yu TW, Flannery KC, Dechene ET, Towne MC, Savage SK, Price EN, et al. 2014. An international effort towards developing standards for best practices in analysis, interpretation and reporting of clinical genome sequencing results in the CLARITY Challenge. Genome Biol 15: R53. [DOI] [PMC free article] [PubMed] [Google Scholar]
- Conti E, Izaurralde E. 2005. Nonsense-mediated mRNA decay: molecular insights and mechanistic variations across species. Curr Opin Cell Biol 17: 316–325. [DOI] [PubMed] [Google Scholar]
- Cooper GM, Stone EA, Asimenos G, NISC Comparative Sequencing Program, Green ED, Batzoglou S, Sidow A. 2005. Distribution and intensity of constraint in mammalian genomic sequence. Genome Res 15: 901–913. [DOI] [PMC free article] [PubMed] [Google Scholar]
- Davydov EV, Goode DL, Sirota M, Cooper GM, Sidow A, Batzoglou S. 2010. Identifying a high fraction of the human genome to be under selective constraint using GERP++. PLoS Comput Biol 6: e1001025. [DOI] [PMC free article] [PubMed] [Google Scholar]
- Dorschner MO, Amendola LM, Turner EH, Robertson PD, Shirts BH, Gallego CJ, Bennett RL, Jones KL, Tokita MJ, Bennett JT, et al. 2013. Actionable, pathogenic incidental findings in 1,000 participants’ exomes. Am J Hum Genet 93: 631–640. [DOI] [PMC free article] [PubMed] [Google Scholar]
- Duzkale H, Shen J, McLaughlin H, Alfares A, Kelly MA, Pugh TJ, Funke BH, Rehm HL, Lebo MS. 2013. A systematic approach to assessing the clinical significance of genetic variants. Clin Genet 84: 453–463. [DOI] [PMC free article] [PubMed] [Google Scholar]
- Eggington JM, Bowles KR, Moyes K, Manley S, Esterling L, Sizemore S, Rosenthal E, Theisen A, Saam J, Arnell C, et al. 2013. A comprehensive laboratory-based program for classification of variants of uncertain significance in hereditary cancer genes. Clin Genet 86: 229–237. [DOI] [PubMed] [Google Scholar]
- Gonsalves SG, Ng D, Johnston JJ, Teer JK, Stenson PD, Cooper DN, Mullikin JC, Biesecker LG. 2013. Using exome data to identify malignant hyperthermia susceptibility mutations. Anesthesiology 119: 1043–1053. [DOI] [PMC free article] [PubMed] [Google Scholar]
- Green RC, Berg JS, Grody WW, Kalia SS, Korf BR, Martin CL, McGuire AL, Nussbaum RL, O’Daniel JM, Ormond KE, et al. 2013. ACMG recommendations for reporting of incidental findings in clinical exome and genome sequencing. Genet Med 15: 565–574. [DOI] [PMC free article] [PubMed] [Google Scholar]
- Hampel H, de la Chapelle A. 2011. The search for unaffected individuals with Lynch syndrome: do the ends justify the means? Cancer Prev Res (Phila) 4: 1–5. [DOI] [PMC free article] [PubMed] [Google Scholar]
- Hartge P, Struewing JP, Wacholder S, Brody LC, Tucker MA. 1999. The prevalence of common BRCA1 and BRCA2 mutations among Ashkenazi Jews. Am J Hum Genet 64: 963–970. [DOI] [PMC free article] [PubMed] [Google Scholar]
- Isidor B, Lindenbaum P, Pichon O, Bézieau S, Dina C, Jacquemont S, Martin-Coignard D, Thauvin-Robinet C, Le Merrer M, Mandel JL, et al. 2011. Truncating mutations in the last exon of NOTCH2 cause a rare skeletal disorder with osteoporosis. Nat Genet 43: 306–308. [DOI] [PubMed] [Google Scholar]
- Janavičius R.2010. Founder BRCA1/2 mutations in the Europe: implications for hereditary breast-ovarian cancer prevention and control. EPMA J 1: 397–412. [DOI] [PMC free article] [PubMed] [Google Scholar]
- Johnston JJ, Rubinstein WS, Facio FM, Ng D, Singh LN, Teer JK, Mullikin JC, Biesecker LG. 2012. Secondary variants in individuals undergoing exome sequencing: screening of 572 individuals identifies high-penetrance mutations in cancer-susceptibility genes. Am J Hum Genet 91: 97–108. [DOI] [PMC free article] [PubMed] [Google Scholar]
- Kircher M, Witten DM, Jain P, O’Roak BJ, Cooper GM, Shendure J. 2014. A general framework for estimating the relative pathogenicity of human genetic variants. Nat Genet 46: 310–315. [DOI] [PMC free article] [PubMed] [Google Scholar]
- Lawrence L, Sincan M, Markello T, Adams DR, Gill F, Godfrey R, Golas G, Groden C, Landis D, Nehrebecky M, et al. 2014. The implications of familial incidental findings from exome sequencing: the NIH Undiagnosed Diseases Program experience. Genet Med 16: 741–750. [DOI] [PMC free article] [PubMed] [Google Scholar]
- MacArthur DG, Manolio TA, Dimmock DP, Rehm HL, Shendure J, Abecasis GR, Adams DR, Altman RB, Antonarakis SE, Ashley EA, et al. 2014. Guidelines for investigating causality of sequence variants in human disease. Nature 508: 469–476. [DOI] [PMC free article] [PubMed] [Google Scholar]
- Maquat LE. 2004. Nonsense-mediated mRNA decay: splicing, translation and mRNP dynamics. Nat Rev Mol Cell Biol 5: 89–99. [DOI] [PubMed] [Google Scholar]
- Ng D, Johnston JJ, Teer JK, Singh LN, Peller LC, Wynter JS, Lewis KL, Cooper DN, Stenson PD, Mullikin JC, et al. 2013. Interpreting secondary cardiac disease variants in an exome cohort. Circ Cardiovasc Genet 6: 337–346. [DOI] [PMC free article] [PubMed] [Google Scholar]
- Patterson N, Price AL, Reich D. 2006. Population structure and eigenanalysis. PLoS Genet 2: e190. [DOI] [PMC free article] [PubMed] [Google Scholar]
- Pirone A, Schredelseker J, Tuluc P, Gravino E, Fortunato G, Flucher BE, Carsana A, Salvatore F, Grabner M. 2010. Identification and functional characterization of malignant hyperthermia mutation T1354S in the outer pore of the Cavα1S-subunit. Am J Physiol Cell Physiol 299: C1345–C1354. [DOI] [PMC free article] [PubMed] [Google Scholar]
- Price AL, Patterson NJ, Plenge RM, Weinblatt ME, Shadick NA, Reich D. 2006. Principal components analysis corrects for stratification in genome-wide association studies. Nat Genet 38: 904–909. [DOI] [PubMed] [Google Scholar]
- Rader DJ, Cohen J, Hobbs HH. 2003. Monogenic hypercholesterolemia: new insights in pathogenesis and treatment. J Clin Invest 111: 1795–1803. [DOI] [PMC free article] [PubMed] [Google Scholar]
- Stenson PD, Mort M, Ball EV, Howells K, Phillips AD, Thomas NS, Cooper DN. 2009. The Human Gene Mutation Database: 2008 update. Genome Med 1: 13. [DOI] [PMC free article] [PubMed] [Google Scholar]
- Thompson BA, Spurdle AB, Plazzer JP, Greenblatt MS, Akagi K, Al-Mulla F, Bapat B, Bernstein I, Capella G, den Dunnen JT, et al. 2014. Application of a 5-tiered scheme for standardized classification of 2,360 unique mismatch repair gene variants in the InSiGHT locus-specific database. Nat Genet 46: 107–115. [DOI] [PMC free article] [PubMed] [Google Scholar]
Associated Data
This section collects any data citations, data availability statements, or supplementary materials included in this article.