

Abstract
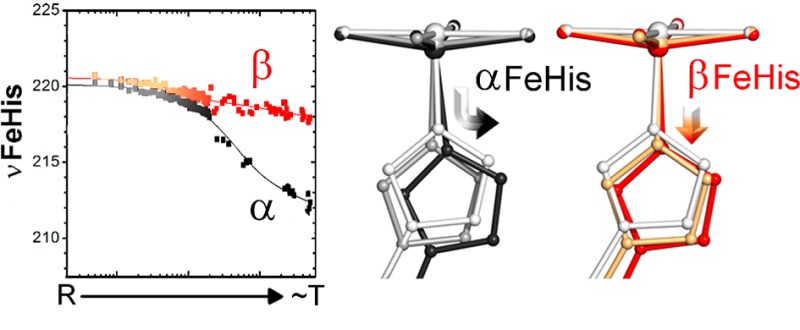
The use of hybrid hemoglobin (Hb), with mesoheme substituted for protoheme, allows separate monitoring of the α or β hemes along the allosteric pathway. Using resonance Raman (rR) spectroscopy in silica gel, which greatly slows protein motions, we have observed that the Fe–histidine stretching frequency, νFeHis, which is a monitor of heme reactivity, evolves between frequencies characteristic of the R and T states, for both α or β chains, prior to the quaternary R–T and T–R shifts. Computation of νFeHis, using QM/MM and the conformational search program PELE, produced remarkable agreement with experiment. Analysis of the PELE structures showed that the νFeHis shifts resulted from heme distortion and, in the α chain, Fe–His bond tilting. These results support the tertiary two-state model of ligand binding (Henry et al., Biophys. Chem.2002, 98, 149). Experimentally, the νFeHis evolution is faster for β than for α chains, and pump–probe rR spectroscopy in solution reveals an inflection in the νFeHis time course at 3 μs for β but not for α hemes, an interval previously shown to be the first step in the R–T transition. In the α chain νFeHis dropped sharply at 20 μs, the final step in the R–T transition. The time courses are fully consistent with recent computational mapping of the R–T transition via conjugate peak refinement by Karplus and co-workers (Fischer et al., Proc. Natl. Acad. Sci. U. S. A.2011, 108, 5608). The effector molecule IHP was found to lower νFeHis selectively for α chains within the R state, and a binding site in the α1α2 cleft is suggested.
Introduction
From the earliest days of Perutz’ crystal structures1,2 and the celebrated two-state ligation model of Monod, Changeux and Wyman,3 hemoglobin (Hb) has served as a paradigm for allosteric systems. Our understanding of the complex mechanism whereby the high-affinity R structure shifts to the low-affinity T structure continues to advance through new experimental and computational developments. This shift accounts for the cooperative release of O2 from the four subunits in the Hb tetramer, which is essential to efficient delivery of O2 from the lungs to tissues.4
Hb is a tetrameric protein, built as a dimer of dimers, each containing two different, though structurally similar chains, α and β. Superposition of crystal structures shows that the R–T shift mainly involves a rotation of the α1β1 dimer against α2β2, by ∼15°.5 The main intersubunit contact changes are at the α1β2 interface, specifically contacts between opposing C helices and FG corners of the two chains (Figure 1). These have been called the “hinge” and “switch” contacts, the former involving a reorientation and the latter a shifted interdigitation of the contacting residues. We note that a range of R structures are seen in different crystal structures of ligated Hb,6 and the solution structure is a dynamical ensemble of these structures.7 However, the critical quaternary contacts are unaffected by these variations.
Figure 1.

Left: View of the interdimer α1β2 interface of T-state Hb (PDB code 1A3N),8 emphasizing the “allosteric core” (E and F helices and FG corner). Critical H-bonds (highlighted dashes) at tertiary (A–E and F–H helices) and quaternary (hinge and switch) contacts are labeled. Top right: Visible absorption spectrum in the Soret band of αpβm and αmβp hybrids decomposed into protoheme and mesoheme contributions, showing the much greater absorptivity of protoheme at 440 nm (contribution from vibronic side bands is in green; data from ref (9)). Lower right: Chain-selective mesoheme substitution permits selective resonance Raman spectroscopy (440 nm excitation) of protoheme in the low-frequency region for deoxy HbA (black), αmβp (red) and αpβm (blue) Hb sol–gels. The positions of the νFeHis and other heme bands are indicated.
An important recent finding is that the R–T shift is not concerted, but involves separate stages, with 3 and 20 μs time constants, the first involving the “hinge” and the second the “switch” contacts, as monitored by UVrR10 and UV MCD11 spectroscopies. WAXS (wide-angle X-ray scattering) measurements12 indicate that most of the molecular shape alteration occurs in the first transition. These experimental observations strongly support the two-stage quaternary pathway that has emerged from computational mapping of the Hb energy landscape by Karplus and co-workers.13 This pathway is not an interpolation between the end-states, but instead, a succession of two separate rotations, one involving the αβ dimers, and the other involving mainly the α chains. The first carries most of the conformational change, consistent with the WAXS results, and involves the “hinge” contacts, while the second involves the “switch”.
In addition to quaternary shifts, there are tertiary structural differences within ligated and unligated subunits. These can be seen in the crystal structures of the canonical R and T states, and also of tetramers that have been trapped, via chemical or mutational modifications, in partially ligated forms.6 The occurrence of tertiary changes along the allosteric pathway has been implicit in many models of binding cooperativity. These include the Koshland–Nemethy–Filmer “induced fit” model for successive binding steps,14 and the “molecular code” model of Ackers and co-workers, based on microstate thermodynamics derived from extensive measurements of tetramer-dimer dissociation equilibria.15 Tertiary as well as quaternary changes have also been analyzed computationally, starting with Gelin and Karplus’ pioneering description of the “allosteric core”.16 However, the structures of tertiary intermediates remain to be defined, and are essential to a mechanistic understanding of cooperativity. These are the focus of the present study.
An important experimental development is the finding that tertiary and quaternary changes can be separated in time by encapsulating Hb in silica gel.17 The protein retains function in the gel, which permits access to buffer and to ligands,18−20 but greatly slows protein motion, especially quaternary rearrangement. The gels are transparent and permit application of optical spectroscopies.17−25 By monitoring both UVrR and visible rR spectra, we have shown that the Fe–histidine stretching frequency, νFeHis, undergoes evolution between high- and low-reactivity values prior to the R–T quaternary rearrangement, and vice versa in the reverse direction. The Fe–His bond transmits force from the protein to the heme, and its stretching frequency has been shown to reflect heme reactivity.26 Evolution of νFeHis prior to changes in the quaternary markers seen in UVrR spectra provided direct support for the tertiary two-state model of Eaton and co-workers,27 in which both high- and low-affinity tertiary structures are accessible in either quaternary state. However, these results represented the average behavior of the α and β chains, which are known to have differing intrinsic νFeHis values.9,17,28−30
In the present work, we use a combined spectroscopic and computational approach to probe the distinct conformational transitions experienced by the α and β chains of Hb. In the spectroscopic work, the two chains are monitored separately by using hybrid Hb’s, in which the native protoheme is replaced with mesoheme in either the α or β subunits. The shifted electronic transition energy of the mesoheme permits selective excitation of the protoheme rR spectrum.9,28 We find that each chain evolves between high and low νFeHis values. However, the extent of the νFeHis change is greater in the α chains, while the β chains evolve faster in the R–T direction. In solution, the β chain progress curve shows an inflection coincident with the “hinge” quaternary step, while the α chains evolve in concert with the “switch”. These results are also consistent with the computational mapping of Karplus and co-workers.13
In the computational work, we apply the PELE method31 to predict the structural evolution of the heme and E and F helices of the α and β chains in response to removal of CO from a single Hb subunit, with the quaternary structure fixed in the R state. CO is a chemically stable surrogate for O2, inducing the same electronic and structural changes in the heme.32 We previously used this technique together with a QM/MM treatment of the heme and its surroundings, to successfully predict the helix displacements in myoglobin, Mb, in response to heme deligation.33 νFeHis is calculated via QM/MM and normal-mode analysis, including benchmark testing on myoglobin. Remarkably, PELE predicts an evolution from high to low νFeHis, with the same shifts for each chain as those observed in the gel experiments. In addition, the PELE structures showed similar heme perturbations to those observed in the deoxyHb (T state) crystal structure: out-of-plane distortions of the heme, and, in the α chains, a tilted Fe–His bond. In other respects, however, the intermediate structure is distinct from the tertiary structure in deoxyHb. This result establishes the competency of computational techniques to monitor force transmission between the heme and the protein, and gives further insight into the allosteric mechanism.
Methods
Experimental Section
Materials
Tetramethyl orthosilicate (TMOS), sodium phosphate buffers, and IHP were all purchased from Sigma-Aldrich and were of the highest purity available. Sodium dithionite (Aldrich) was of technical grade, was stored in a desiccator, and was used within six months of purchase. All solutions were prepared using Milli-Q deionized water.
The purification of human HbA and its chain-selective reconstitution with mesoheme has been described previously.9 Briefly, Hb was isolated from expired human blood32,34 and the heme was extracted by acetone-acid treatment.35,36 The apoHb was then reconstituted and incubated for 3 days with synthetic iron(III) mesoporphyrin IX.28,35,36 The α and β chains of native HbA and mesoHb were then isolated and purified by published procedures,28,37−39 and α(proto)-β(meso) (αpβm) and α(meso)-β(proto) (αmβp) Hb tetramers were recombined by incubating a 1.2-fold molar excess of the beta subunit with the corresponding alpha subunit in 100 mM phosphate buffer, pH 7.4, overnight at 4 °C in a CO-containing environment, followed by cation exchange to remove excess monomeric chains.28,40−42 Samples were then treated with dithionite to ensure complete reduction to the ferrous state, and were subject to gel-filtration chromatography to remove any residual porphyrin. The proto/mesoheme content and concentration of the hybrid Hb solutions were established by UV–vis absorbance,43 and the molecular weights of the alpha and beta chains were verified by electrospray ionization mass spectrometry. Hybrid Hb solutions were stored in the CO-bound form at −80 °C until use.
Sample Preparation
Sol–gel encapsulation of Hb was performed as described in our earlier study.17 COHb solutions were converted to the oxy form by photolysis on ice under 1 atm O2. These oxyHb solutions were then used directly for oxyHb gels, or were converted to the deoxy form by purging with Ar and adding ∼1 mM sodium dithionite for deoxyHb gels. Equal volumes of TMOS and 50 mM sodium phosphate buffer (pH 6.5) were then mixed in an NMR tube and vortexed until cloudy, at which point a third volume (i.e., 1/3 of final total volume) of Hb solution was added and the solution vortexed until homogeneous. The sol–gel emulsion was then rotated horizontally until hardened into a film on the inner surface of the sample tube, typically in 5–10 min. The gel was then bathed in O2- or Ar-saturated phosphate buffer and stored in the dark at 4 °C for 48 h prior to use, with one change of the bathing buffer (1 mL for 180 μL of gel) after 24 h to remove methanol and nonencapsulated protein. These steps were performed under ambient conditions for oxyHb gels and under 1 atm Ar for deoxyHb gels. The final concentration of Hb tetramers in the sol–gels was 100 μM (oxyHb) or 50 μM (deoxyHb). The estimated ferric Hb subunits was <5% under these conditions.17 Conversion of oxyHb gels to deoxyHb was initiated by adding sodium dithionite via needle to a final concentration of ∼2 mM in the bathing buffer. Conversion of deoxyHb gels to the CO-bound state was achieved by removing the degassed bathing buffer and replacing it with CO-saturated buffer.
Hb solution samples were prepared as described previously,9 in 50 mM sodium phosphate, pH 7.4, at a final Hb concentration of 100 μM tetramer. About 400 μL of this solution was transferred by cannula to a sealed, purged NMR tube under 1 atm CO or Ar pressure for COHb or deoxyHb samples, respectively.
Heme-rR Spectroscopy of Hybrid Hb Sol–Gels
Resonance Raman spectra of Hb sol–gels were obtained using an experimental apparatus described elsewhere.17 Excitation (440 nm) was obtained from the frequency-doubled output of a titanium-sapphire laser (1 kHz, 20 ns pulse, 5 μJ/pulse) pumped by a Q-switched (1 kHz), intracavity frequency-doubled Nd:yttrium–lithium–fluoride laser (Photonics Industries International). Excitation light was focused through a spherical lens onto the surface of the spinning sample tube, and backscattered (135°) light was collected through a camera lens and focused on the 0.200 mm entrance slit of a 0.8 m spectrometer (Spex 1401) equipped with a liquid N2-cooled charge-coupled device detector (Roper Scientific). A 442 nm cutoff notch filter (angle tuned) was placed at the slit to minimize the spectral contribution of Rayleigh scattering. For experiments on deoxyHb gels with added CO, the sample tube was vertically translated back and forth through an 8 mm zone (with a ∼100 μm laser spot size) at a rate of 1 mm/s during spectral acquisition, using a Thorlabs APT motorized stage (motor Z812). This step was found to be necessary to prevent probe-beam photolysis from suppressing the T–R transition in hybrid Hb sol–gels (data not shown). Experiments were conducted at 22 ± 0.5 °C. Spectra were calibrated with respect to standard Raman spectra of dimethylformamide and carbon tetrachloride, and the νFeHis band was fit by a single Gaussian function and a linear baseline in the 180–260 cm–1 region of the spectrum. Error surface analysis on the νFeHis-derived time constants of tertiary relaxation was performed as described by Beechem and Haas44 and our previous paper.17
Time-Resolved UVrR Spectroscopy and Heme-rR of Hybrid Hb Solutions
The experimental setup and the spectral acquisition scheme has been described.9,10 Photolysis pulses at 419 nm (20 ns, 65 μJ/pulse, 1 kHz) were generated by frequency doubling the output of a Ti-sapphire laser, which was pumped (527 nm, ∼10 mJ/pulse, 70 ns, 1 kHz) by an intracavity frequency-doubled Nd:YLF laser (GM30, Photonics International Inc.). Probe pulses (20 ns, 1 kHz) at 440 (0.5 μJ/pulse) or 229 (0.5–1 μJ/pulse) nm were obtained by frequency doubling or quadrupling a second Ti-sapphire laser. About 0.4 mL of sample solution was contained in a CO-saturated, septum-sealed 5 mm quartz or glass NMR tube. The solution was stirred via a stationary stirrer bar/magnet combination through spinning of the sample tube. The timing between pump and probe pulses was adjusted with a computer-controlled pulse generator (DG 535, Stanford Research Systems). The data acquisition sequence subtracts averages of paired readings, pump–probe minus probe–pump, in order to cancel effects of slowly changing conditions.45
For UVrR, the pump and probe beams were spatially overlapped and focused to a rectangular spot on the sample, matched to the dimensions of the detector, through a pair of cylindrical quartz lenses. Scattered light was collected at 135° with a pair of fused quartz lenses, f-matched to a 1.26 m spectrograph (Spex 1269) equipped with a holographic grating (3600 groove mm–1) and UV enhanced liquid nitrogen cooled CCD (back illuminated, Spec-10, Roper Scientific). Spectra were obtained by averaging three 30 min measurements at each time delay.
For visible rR, the pump and probe beams were spatially overlapped and focused at the sample using a spherical lens. Scattered light was collected at 135° with a camera lens (f # 1.2) and focused using an f-matched singlet lens at the entrance slit of the 0.8 m spectrograph equipped with a holographic grating (1800 groove mm–1) and intensified CCD (PI/MAX, Princeton Instruments). The probe pulse wavelength, 440 nm, was selected to provide selective resonance enhancement of protoheme in deoxy-HbA and deoxy-proto/meso-hybrids (Figure 1). Interfering signals from the pump laser were eliminated by electronically gating the detector. Spectra were averaged for 4 min at each time delay.
The spectral data were processed with Grams/AI (7.0) software (Thermo Galactic). The νFeHis band near 220 cm–1 was fit with a Gaussian peak to obtain the center frequency. Examples of the νFeHis spectra are presented in reference9 for seven of the 20 pump–probe delay times plotted in Figure 3. The time dependence of these deconvoluted Fe–His stretching frequencies was modeled by a three-exponential function with fixed time constants obtained from UVRR spectroscopy, which tracks both tertiary and quaternary changes.
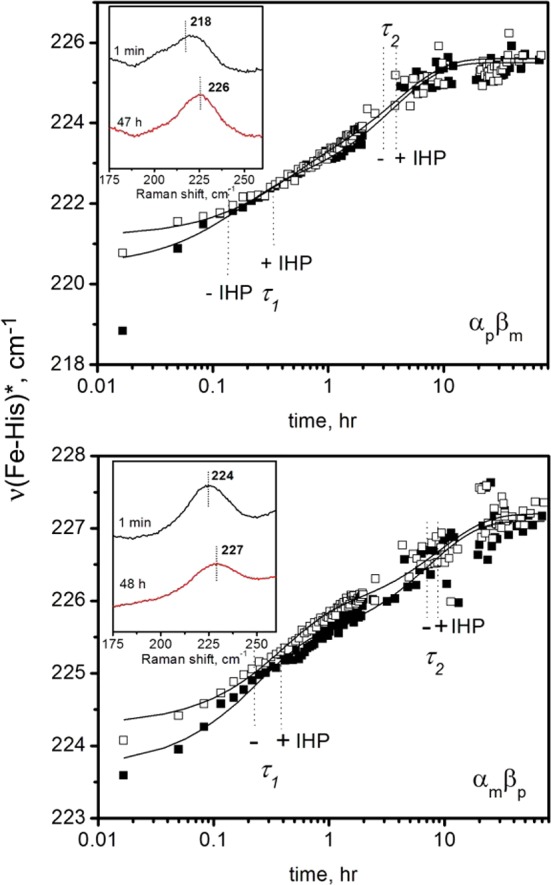
Figure 3.
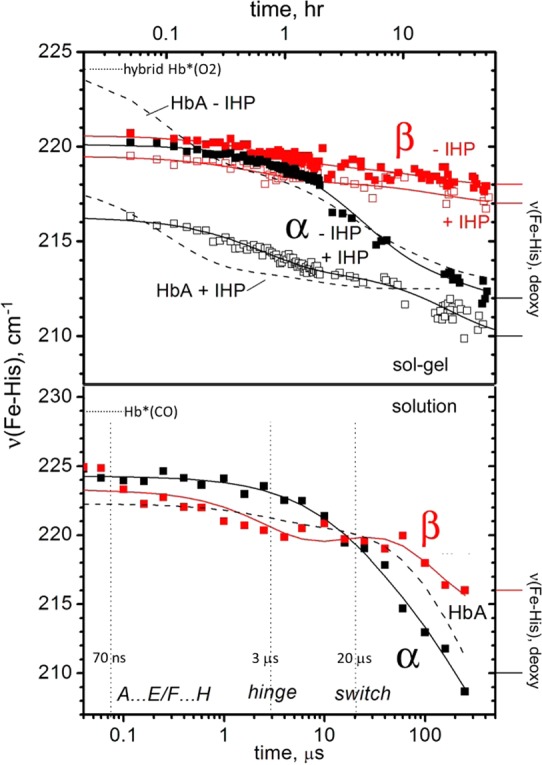
Time courses for νFeHis for the indicated subunit containing protoheme in the αpβm (black) and αmβp (red) hybrid Hbs, following HbO2 deoxygenation in gels (top) or HbCO photodissociation in solution (bottom). The effect of IHP addition (open squares) in gels is also shown. Time courses for HbA (αpβp) under the same conditions are given as dashed lines for comparison. Dotted horizontal lines indicate frequencies for unrelaxed deoxy heme, after photolysis of HbO2 in gels, or of HbCO in solution (bottom). Marked at right are the chain frequencies for deoxyHb in gels (top) and solution (bottom). Dotted vertical lines are labeled along the bottom axis showing time constants for tertiary and quaternary contact changes.
Computational Methods
Computer simulations involved the following procedure: (1) systems setup for R, T and oxy/deoxyMb, (2) initial conformational sampling using molecular dynamics (MD), (3) QM/MM geometry optimization and frequency calculations, (4) PELE sampling for the R deligated species, and (5) QM/MM geometry optimization and frequency calculations for PELE’s intermediates.
System Setup and Molecular Dynamics
The following structures were taken from the Protein Data Bank: 1A3N8 (T, deoxyHb), 1BBB46 (R2, HbCO), 2 V1K47 (deoxyMb) and 1MBO48 (oxyMb), and prepared with Protein Preparation Wizard49 in the Schrödinger suite of programs. After appropriate solvation, neutralization and 0.15 M NaCl addition, a short MD simulation was performed with Desmond50 for each structure, in order to obtain some conformational sampling. More in detail, the systems were equilibrated with Desmond’s default protocol followed by a 1 ns NPT production phase at 300 K (this short MD was intended to keep the initial quaternary/tertiary arrangements). Along equilibration and short production, the Cα RMSD from the initial crystal structures stays below 1.3 Å. The OPLS-2005 force-field51 and the SPC water model were used. The temperature was regulated with the Nose–Hoover chain thermostat52 with a relaxation time of 1.0 ps, and the pressure was controlled with the Martyna–Tobias–Klein53 barostat with isotropic coupling and a relaxation time of 2.0 ps. The RESPA54 integrator was employed with bonded, near, and far time steps of 2.0, 2.0, and 6.0 fs, respectively. A 9 Å cutoff was used for nonbonded interactions together with the smooth particle mesh Ewald method.55 For each system, six snapshots, at times 0, 0.2, 0.4, 0.6, 0.8, and 1 ns were selected for the QM/MM study.
QM/MM Calculations
Structures were optimized followed by frequency calculations using Qsite.56 The heme, the proximal histidine and the sixth ligand (molecular oxygen or carbon monoxide, if present) of a given chain subunit (either α of β) were included in the QM region. The rest of the subunit containing the QM region, the other chains and a 12 Å water layer were treated classically (the remainder of the solvent was removed). The MM minimization included the chain under study, containing the QM region, plus all other residues within 5 Å. The density functional method with the B3LYP57−60 functional and the lacvp*61 basis set was used for the quantum region, while the OPLS-AA51 force field was used for the classical part. In the case of R and oxyMb, the sixth ligand was removed after geometry optimization and reoptimized before frequency calculation. In doing so, the five-coordinated Rα, Rβ, Tα, Tβ, Mb and “oxy” Mb were obtained, allowing direct comparison with the Raman data, which is limited to five-coordinate heme. Quintet and singlet states were used for five- and six-coordinated heme, respectively. As expected, along the QM/MM optimizations, there were no substantial structural changes except for residues in direct contact with the QM region. Thus, significant tertiary changes require a wider level of sampling, which can be achieved with PELE as shown previously.62,63 Additionally, a constrained R structure (R*) was modeled by keeping all backbone frozen along the MM and QM minimization.
PELE Simulation
The five-coordinated Rα and Rβ states obtained after QM/MM geometry optimizations were used as initial models for the PELE simulation, aiming to reproduce tertiary changes that accompany deligation of HbCO. PELE involves three moves, a protein backbone perturbation, side chain sampling and minimization, in a Monte Carlo step. At the end of each step, a Metropolis acceptance criterion is applied to accept or reject the new conformation. The collection of accepted steps forms a stochastic trajectory in the conformational space. The initial backbone move is based on α-carbon (Cα) displacements according to an anisotropic network model (ANM), a simple model for normal-mode analysis.64 During side chain sampling, the algorithm proceeds by optimally arranging the top 25 “hot” side chains, those with the largest increase in energy as a result of the Cα-ANM perturbation. Finally a truncated Newton minimization, using the OPLS all-atom force field51 and an implicit surface-generalized Born continuum solvent,64 is performed to obtain a new local structure. Along this minimization, Cα atoms are constrained to their final position obtained in the ANM perturbation. Additionally, side chain perturbation and the implicit solvent model introduce also entropic contributions, moving away from a minimum energy pathway. We have recently shown that this level of sampling provides accurate binding free energies.65 Importantly, the Cα-ANM perturbation was applied only to the chain under study. Furthermore, only residues within 25 Å of the heme were minimized in order to avoid quaternary rearrangement of the tetramer, while allowing relaxation of the intersubunit interface. Some intermediates generated by PELE were than subjected to QM/MM geometry optimization and frequency calculation to track the dependence on heme reactivity on tertiary changes.
Cross-Correlation Analysis
A normalized covariance matrix, Cij, of the Cα positional fluctuations along the PELE trajectory was calculated to assess the extent of correlation between the residues within a given subunit. Cij is given by
where ΔRi is the displacement vector of the i-th atom from its average position along the trajectory and the angle brackets represent an average over the ensemble of structures generated. Cij ranges from +1 to −1. Positive values represent correlated motion (i.e., in the same direction), whereas negative values represent an anticorrelated motion (i.e., in opposite directions). Null values indicate no correlation (i.e., motion in orthogonal directions).
Results
UVrR Spectra Establish Kinetic Competency of Meso/Proto-Hb Hybrids
While mesoheme is a close analogue of protoheme, the electronic and steric effects of saturating the vinyl substituents do have detectable effects on function in the reconstituted hybrid hemoglobins. Relative to native HbA, the meso/proto hybrids have slightly higher O2 affinities, and slightly lower cooperativity.66−69 Consequently we were concerned about the integrity of the protein structure, and used UVrR spectroscopy to confirm that both hybrids in fact retain the key quaternary contacts, and also the conformational kinetics of HbA.
Excitation at 229 nm produced spectra for deoxyHb and HbCO with the same tyrosine and tryptophan band frequencies and intensities for the hybrids and HbA, and subtraction gives identical difference spectra (Figure S1, Supporting Information). This difference spectrum is known to result from the breaking of key H-bonds at the hinge and switch intersubunit contacts (Figure 1) when the T structure is converted to R.10,70,71
Pump–probe UVrR difference spectroscopy has shown that these quaternary contacts are formed in two successive time steps following ligand photodissociation from HbCO, first the hinge (2 μs) and then the switch (20 μs).10 We found (Figure 2) that the difference spectra were identical for the hybrids and HbA at 3.0 and 50 μs, before and after the switch contact is formed. Likewise identical spectra were obtained at 0.15 μs, following the first detectable tertiary transition (0.07 μs)10,70−72 and before the quaternary movements. This difference spectrum is associated with the breaking of interhelical H-bonds due to the concerted motion of the E and F helices.33,72,73
Figure 2.
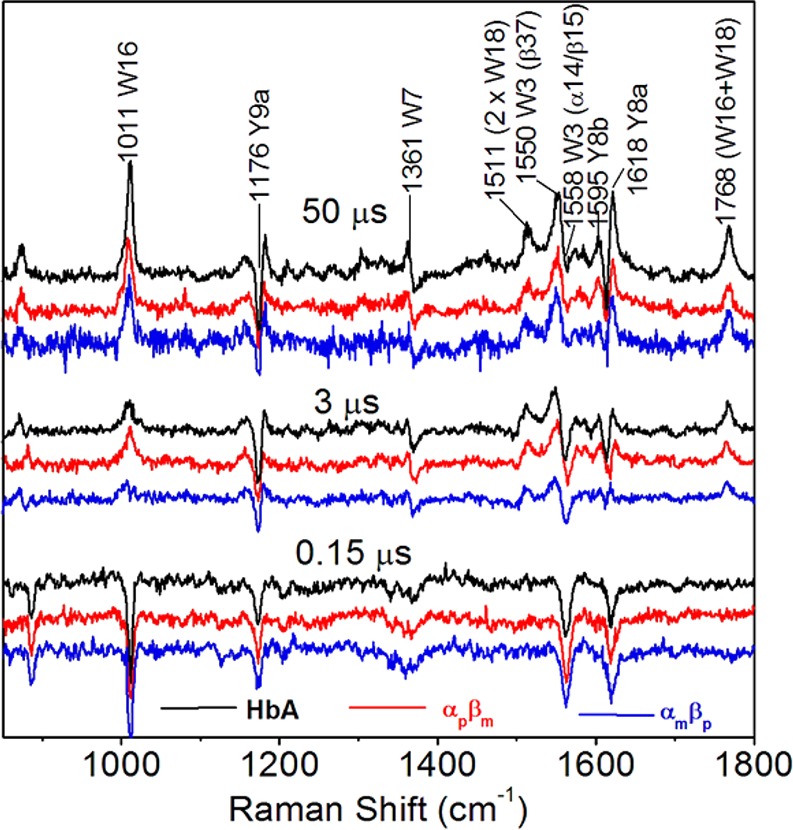
Pump–probe difference spectra at the indicated delay times, reflecting alterations in tertiary (0.15 μs) and quaternary (3 and 50 μs) H-bonds,10 which reveal the same dynamics for HbA and the Hb hybrids.
Thus, despite the slight functional alteration associated with substitution of meso- for protoheme, the conformational dynamics, as monitored by UVrR spectroscopy, remain unaffected.
Nanosecond–Microsecond νFeHis Evolution in Aqueous Hybrids
The mesoheme Soret absorption band is blue-shifted relative to that of protoheme, so that in meso/proto hybrids, one can achieve selective excitation of protoheme rR modes (Figure 1).74,75 We have previously exploited this characteristic to monitor the evolution of the Fe–histidine stretching mode frequency, νFeHis, separately in the α and β chains, after CO photodissociation from aqueous HbCO, using pump–probe rR spectroscopy.9 In the previous work, νFeHis spectra are shown for seven time points corresponding to important UVrR changes. In the present work, we show the full time course and reanalyzed these data, using curve-fitting to extract the band frequency at each time point. The νFeHis time-course is plotted in Figure 3, for comparison with the gel data (see below). Comparable data for native Hb (dotted line)17 is seen to be an intensity-weighted average of the two chains, confirming that the hybrids provide a faithful representation of the Fe–histidine dynamics in the native protein. The νFeHis intensity is greater for α than for β chains (Figure 1); thus the Hb data are closer to those of the α than the β chains.
νFeHis evolves differently in the two chains, as noted previously.9 The α chain value is nearly constant at early times, but drops dramatically at ∼20 μs, coincident with the formation of the final quaternary contact (switch),10 after which it descends to the value seen in deoxyHb (Figure 1; this value is somewhat arbitrary, as the deoxyHb band is asymmetric, and has two components ∼204 and ∼214 cm–1).9,28−30,76 The β chain νFeHis begins its decline earlier than the α chain, although the final value is considerably higher, as it is in deoxyHb (Figure 1). There is a clear inflection in the β chain time course at ∼3 μs, coincident with formation of the first quaternary contact (hinge).10
Prompt Evolution of νFeHis after Ligand Dissociation
It has long been known that HbCO photodissociation produces a prompt deoxy-heme rR spectrum with significantly elevated νFeHis, relative to that observed at later times.70,77−80 We have previously attributed this elevation to Fe–His bond compression due to protein resistance to heme relaxation after the Fe–CO bond breaks,70 an effect confirmed by the computational results described below.
However, the reported frequency of this prompt signal has been somewhat variable. We discovered that one reason for this variability is that the measured frequency decreases with the increasing incident laser power. Figure 4 shows the power-dependent νFeHis values obtained from rR spectra produced by our 16 ns laser pulses (which act as simultaneous pump and probe). At low power levels only a fraction of the HbCO is photodissociated; this fraction (calculated from the normalized intensity ratio of the separate ν4 porphyrin bands of deoxy and CO-heme9,80) is also plotted in Figure 4. The νFeHis values were determined by Guassian peak fitting, after subtraction of the CO-heme spectrum (there is a weak 238 cm–1 CO-heme band), using the isolated 508 cm–1 Fe–CO stretching band81 for normalization. At 1 μJ/pulse, where the photolyzed fraction is <5%, νFeHis = 228.5 cm–1, but drops rapidly to a plateau value of 225.5 cm–1 beyond 5 μJ/pulse. Importantly, this effect is much weaker for myoglobin (Mb), which shows only a 1 cm–1 initial drop, to 220.5 cm–1, which is the equilibrium deoxyMb value. An even larger νFeHis difference between Hb and Mb was reported by Mizutani and Nagai,82,83 using picosecond pump–probe spectroscopy. A few ps after HbCO photolysis, νFeHis was 232 cm–1 for Hb, while for Mb it was 221 cm–1.
Figure 4.
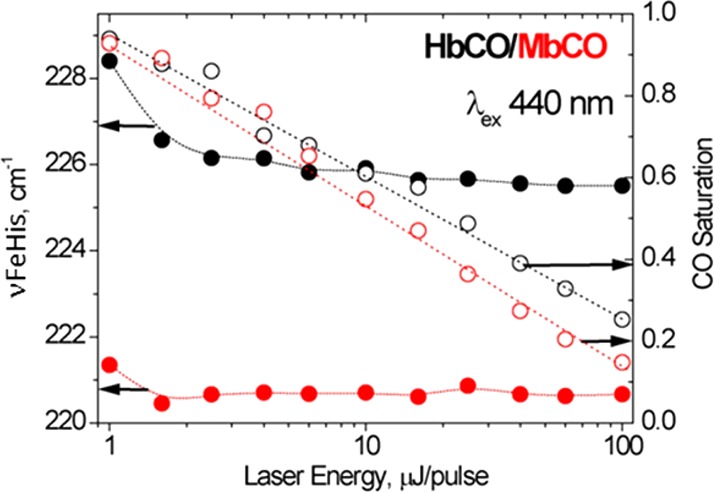
νFeHis (filled circles) and CO saturation (open circles) in HbCO (black) and MbCO (red) solutions, as functions of the incident 16 ns laser pulse energy.
Thus, there is a protein-specific νFeHis elevation in the prompt HbCO photoproduct, which remains largely conserved out to 16 ns (our laser pulse width). Our nanosecond pump–probe data gave νFeHis = 224 cm–1 at the earliest time point, 70 ns (Figure 3), slightly lower than the 225.5 cm–1, obtained within the 16 ns pump pulse at laser power levels above 5 μJ/pulse. The pump power exceeds this value in the pump–probe experiments, in order to photolyze all of the HbCO molecules. Consequently, most of the frequency drop at early times is attributable to the laser power effect. We attribute this effect to relaxation of the heme pocket due to energy transfer from multiple excitations of the heme chromophore. The effect is not seen for Mb because full relaxation of its heme occurs in picoseconds. We infer that the heme pocket is considerably more constrained in Hb than in Mb, retarding heme relaxation into the nanosecond time regime.
Hybrid νFeHis Evolution in Silica Gel
As in our study of native Hb embedded in silica gel,17 the protoheme νFeHis evolution of the hybrid Hb’s was monitored in the R–T and T–R directions by deoxygenating gel-encapsulated HbO2 (R–T), and by adding CO to gel-encapsulated deoxyHb (T–R). Figure 3 shows that in the R–T direction νFeHis falls to the final deoxyHb values within 2 days for both the α and β chains, whereas the UVrR markers of quaternary change were previously found to become detectable only after a week.17 The final values are, of course, quite different in the two chains, as they are in equilibrium deoxyHb.9,28 The corresponding gel data for native Hb (dashed line)17 tracks the α chain data more closely than the β chain data, as in solution. In addition, the Hb time course showed an early phase (τ = 0.1 h), which is missing in the hybrids. The starting νFeHis in the hybrids is that of the second Hb phase (τ = 3 h). This difference between native Hb and the hybrids is not seen in solution (Figure 3, bottom). We infer that the gel slightly perturbs the local heme environment in the hybrids, allowing the hemes to relax further than they do in native Hb at the earliest times.
The T–R direction (Figure 5) is induced in gels by adding CO to encapsulated deoxyHb just prior to data collection. The rR probe beam transiently photodissociates bound CO to produce the five-coordinate heme complex required for νFeHis detection. Consequently, the 16 ns, 5 μJ laser pulses used in this experiment probe unrelaxed heme in the photoproduct, as discussed above, and therefore, the measured νFeHis values are expected to be elevated from those seen in the R–T gels. If roughly 6 to 7 cm–1 is subtracted from the T–R frequencies, then νFeHis evolution is seen to be just the reverse of the R–T direction (Figure 3), with α chains starting out at somewhat lower frequencies than β chains in deoxyHb, and converging to similar R state deoxy frequencies. These results are mirrored in encapsulated native Hb,17 where νFeHis rises to values characteristic of the R state photoproduct (measured in HbCO gel) within 2 days. In both hybrids and native Hb, these events occur long before the full establishment of the UVrR markers of the T–R quaternary transition.17
Figure 5.
Time courses for protoheme νFe–His in the αpβm (top panel) and αmβp (bottom panel) hybrid Hbs following addition of CO to deoxyHb gels. The addition of IHP (open squares) has only a minor effect, as shown. The insets are examples of rR νFeHis peaks for selected -IHP time points. Fitted time courses are shown as solid lines. (The first αpβm time point was excluded from the fit.).
Adding the effector molecule IHP (inositol hexaphosphate) was previously found to strongly affect νFeHis in the R–T direction.17 The current results show that this effect is largely localized in the α chains. The initial value of νFeHis is strongly depressed in the α chains, and the depression is maintained throughout the time course, whereas the effect on the β chains is minimal. In the T–R direction, there is little effect of IHP on either chain.
The time courses could be fit to two or three successive exponentials. Time constants and amplitudes are given in Table 1. Figure S2 (Supporting Information) shows the error surface analysis used to determine uncertainties.
Table 1. Time Constants for νFeHis Relaxation from Sol–Gel Vis-rR Spectraa.
| τ1, h | τ2, h | |
|---|---|---|
| oxyHb −O2 | ||
| αpβm -IHP | 4.1 (5.5 cm–1)b | 26 (2.6 cm–1) |
| αpβm +IHP | 0.63 (2.7 cm–1)b | 25 (3.6 cm–1) |
| αmβp -IHP | 0.8 (1.5 cm–1)b | 13.9 (1.1 cm–1) |
| αmβp +IHP | 0.6 (1.1 cm–1)b | 22 (1.2 cm–1) |
| deoxyHb +CO (photoproduct) | ||
| αpβm -IHP | 0.15 (1.9 cm–1) | 3.6 (3.1 cm–1) |
| αpβm +IHP | 0.33 (1.5 cm–1) | 3.8 (2.9 cm–1) |
| αmβp -IHP | 0.23 (1.7 cm–1) | 7.2 (1.7 cm–1) |
| αmβp +IHP | 0.37 (1.5 cm–1) | 8.8 (1.4 cm–1) |
The amplitudes are given in parentheses.
Amplitude includes an unresolved rapid phase.
Computation Produces Accurate Variations in νFeHis for Equilibrium Structures
QM/MM computation on equilibrium deoxyMb and deoxyHb structures (Table 2), gave reasonable values for the Fe–His bond distances and the νFeHis frequencies. The computed frequencies are somewhat below the experimental values (4 cm–1 for deoxyMb, 14 cm–1 for deoxyHb). Importantly, however, the 7 cm–1 frequency difference between the β and α chains in deoxyHb is in quantitative agreement with the experimental difference.
Table 2. Average QM/MM Fe–His Bond Distances (d) and Stretching Frequencies (νFeHis) for Five-Coordinated α (Rα and Tα) and β (Rβ and Tβ) Hb Subunits, DeoxyMb and MbO2 (with Removal of O2)a.
| structure | d, Å | νFeHis, cm–1 | νFeHis, cm–1 (expt.)c |
|---|---|---|---|
| R*α | 2.132 | 223 | 224d |
| R*β | 2.140 | 220 | 224d |
| Rα | 2.20(1)b | 213(2)b | 220 |
| Tα | 2.24(1)b | 197(2)b | 212 |
| Rβ | 2.22(1)b | 210(2)b | 221 |
| Tβ | 2.21(1)b | 204(2)b | 218 |
| oxyMb | 2.19(2)b | 217(2)b | |
| Mb | 2.17(1)b | 216(4)b | 220e |
Relevant experimental values are also shown.
Values averaged over six snapshots taken from the 1 ns molecular dynamics simulation. The number in parentheses is the uncertainty of the mean, estimated as σ/N1/2, where σ is the standard deviation and N is the number of values used to calculate the mean values (6).
Experimental data from rR of sol–gel encapsulated Hbs.
OxyHb photoproduct values.
Sol–gel encapsulated deoxyMb from Samuni et al.84
When the oxyMb structure was reoptimized after removal of the ligand, the computed νFeHis was essentially the same as for the deoxyMb structure. Thus, the starting protein structure has no effect on the deoxy-heme in Mb. However, this is not the case for Hb. Both the α and β chains give elevated values, compared to those of deoxyHb, when the HbCO structure is deligated. As observed experimentally, the elevation is much larger for the α than for the β chains, 16 vs 6 cm–1, respectively. These differences are similar to those seen for the meso/proto hybrid Hb’s over the deligation time course in the solution pump–probe experiments (Figure 2; the differences seen in the gels are somewhat lower, because of prompt relaxation at early times, as discussed above). In order to verify that these results are not biased by the initial structure, we repeated the calculations with 2dn1 (R, oxyHb) and 2dn2 (T, deoxyHb).85 As expected, the frequency values obtained with these crystals are comparable (the R–T shifts are 11 and 7 cm–1 in α and β respectively).
Interestingly, when the protein backbone was kept frozen during geometry optimization of deligated Hb, we obtained significantly higher frequencies in both chains, shown as R* in Table 2. This difference, 10 cm–1, is the same as that observed between HbCO and MbCO in the 2 ps photodissociation experiments of Mizutani and Nagai.82,83 The corresponding Fe–His distance is shorter than in the fully optimized structure, 2.13 vs 2.20 Å for the α chains, and 2.14 vs 2.22 Å for the β chains, and only slightly longer than in the initial 6-coordinate CO-heme adduct, 2.12 Å. Thus, modeling an unrelaxed subunit structure confirms our earlier conjecture:70 the elevated νFeHis observed for early HbCO photoproduct results from bond compression associated with protein resistance to heme relaxation. Together, these results show that the QM/MM methodology is sufficiently accurate to monitor the evolution of the individual chain frequencies following deligation.
Computational Modeling of νFeHis Evolution in α and β Chains
When PELE is applied to a single deligated chain within the HbCO structure the computed νFeHis decreases, just as it does in the time-resolved rR experiments. Moreover, the effect is greater for the α than the β chains, again as observed experimentally.
Table 3 shows the νFeHis trend with successive PELE steps. Twenty steps are sufficient to reach a value around which it subsequently fluctuates. This value is essentially the same as that computed for the T structure, 197 and 204 cm–1 for the α and β chains. Thus, in striking agreement with the gel experiments, νFeHis evolves from the R-state to the T-state values, solely as a result of tertiary forces initiated by deligation, in the absence of quaternary change.
Table 3. Evolution of Structure and the QM/MM-Derived νFeHis of the Deligated α and β Subunits during the PELE Simulation.
| α
chain |
β chain |
|||||||||
|---|---|---|---|---|---|---|---|---|---|---|
| step | νFeHisa | db | θc | RMSDTd | RMSDRe | νFeHisa | db | θc | RMSDTd | RMSDRe |
| R* | 223 | 2.132 | 92.0 | – | – | 220 | 2.140 | 92.3 | – | – |
| R | 213 | 2.198 | 94.6 | 1.59 | 0.00 | 215 | 2.194 | 96.4 | 3.68 | 0.00 |
| 1 | 210 | 2.212 | 99.4 | 1.62 | 0.77 | 213 | 2.191 | 100.7 | 3.77 | 0.84 |
| 10 | 205 | 2.233 | 102.1 | 1.48 | 0.74 | 203 | 2.201 | 96.9 | 3.67 | 0.88 |
| 20 | 200 | 2.232 | 104.5 | 1.46 | 0.93 | 204 | 2.199 | 100.0 | 3.68 | 0.94 |
| 30 | 199 | 2.234 | 103.2 | 1.53 | 0.87 | 204 | 2.200 | 98.8 | 3.70 | 0.80 |
| 40 | 201 | 2.218 | 102.4 | 1.46 | 0.88 | 205 | 2.209 | 98.4 | 3.65 | 0.90 |
| 50 | 195 | 2.251 | 105.0 | 1.45 | 0.89 | 206 | 2.199 | 101.0 | 3.69 | 0.82 |
| T | 197(2) | 2.24(1) | 102(2) | 0.00 | 1.59 | 204(2) | 2.21(1) | 102(2) | 0.00 | 3.68 |
Fe–His stretching frequency (cm–1).
Fe–His bond length (Å).
Heme-His tilting angle (“C” pyrrole nitrogen–iron–His Nε angle in degrees).
RMSD of α carbon displacements (Å) between the PELE intermediate and the deoxyHb crystal structure (1A3N)8 for the α1 (left) or β1 (right) subunits.
RMSD of α carbon displacements (Å) between the PELE intermediate and the initial R structure for the α1 (left) or β1 (right) subunits.
However, the tertiary structure itself does not evolve very far in the direction of the tertiary structure found in the T state. For each chain, the root-mean square deviation (RMSD) between the evolving PELE structures and the initial deligated structure never exceeds 0.94 Å (Table 3). The RMSD between the initial structure and the structure in the T state is much larger, 1.59 and 3.68 Å in the α and β chains. More importantly, the RMSD of successive PELE structures relative to the T state diminishes very little from these values, fluctuating around 1.47 Å (α) and 3.67 (β) (Table 3). It is clear that the PELE intermediates, although displaying νFeHis frequencies characteristics of the T state, have protein conformations that are distinct from the T conformations. The factors controlling νFeHis must therefore be of local nature.
For the same reason stated above, the calculations were repeated with 2dn1 and 2dn2 crystal structures. Consistently, νFeHis shifted after PELE from 210 to 199 cm–1 for the α chain, and from 212 to 206 cm–1 in the β chain.
Structural Determinants of νFeHis Evolution from Computational Modeling
In searching for local determinants of νFeHis, we found that two structural parameters of the heme were most consistently correlated (Figure 6) in the successive PELE steps: the Fe–His bond length, and the out-of-plane distortion of the heme, measured as the average displacement of heme’s atoms from their least-squares plane.86 Both parameters have been directly related to oxygen affinity by quantum mechanical calculations.87,88
Figure 6.
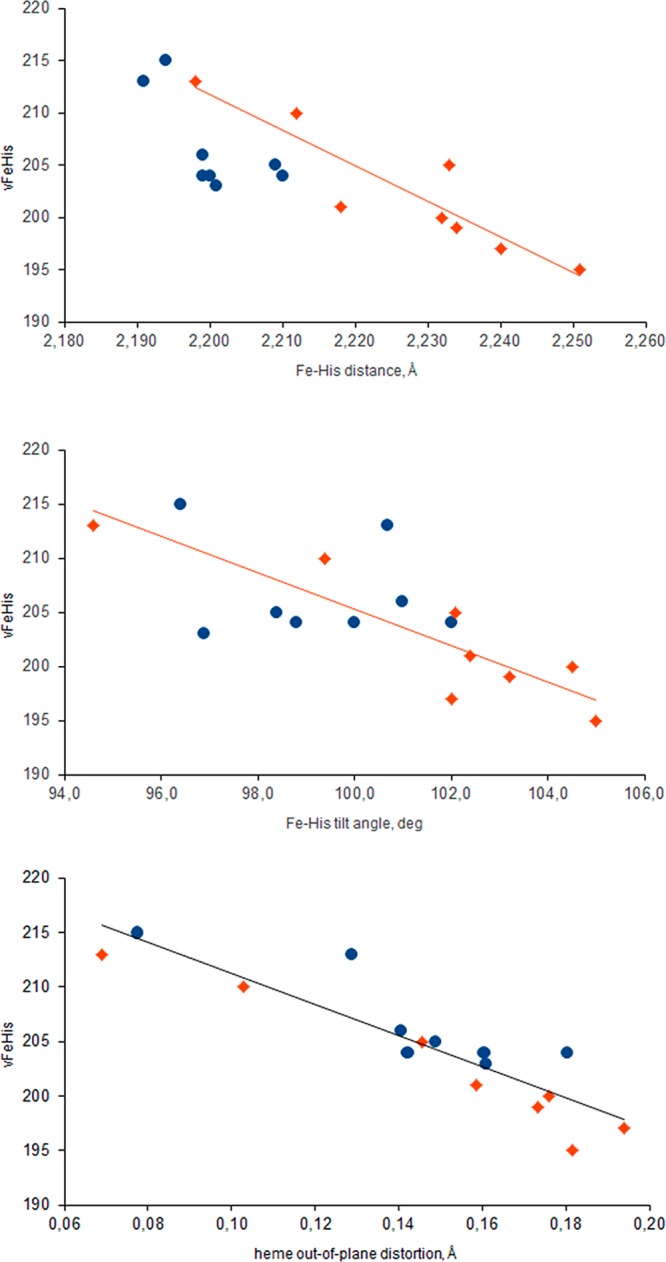
Dependence of the computed Fe–His stretching frequency (values in cm–1) on the Fe–His bond distance and tilt angle (NC–Fe–Nε angle, where NC is in heme pyrrole “C” and Nε is in the proximal histidine), and with the heme out-of-plane distortion (measured as the average displacement of heme’s atoms from their least-squares plane), for Hb α chains (red diamonds) and β chains (blue circles).
For the α chains, the frequency also correlates with the tilt angle of the Fe–His bond with respect to the heme plane (Figure 6, bottom). This angle is as large in the PELE intermediate as it is in the T state, 102°, while the Fe–His bond is nearly normal to the heme (92°) in HbCO. Friedman and co-workers linked νFeHis to the Fe–His bond tilt within a general model for allostery.78,80 A tilted Fe–His bond has long been noted as a feature of the T-state α chain.5,89 However, this correlation does not hold for the β chain, for which the tilt is lower along the PELE trajectory. In the β chain, the heme distortion, enforced by the packing interactions with nearby side chains, is the likely determinant of the slight Fe–His bond lengthening.
Figure 7 illustrates the differing heme-associated changes between the two chains, and the similar local structures in the PELE intermediate and deoxyHb.
Figure 7.
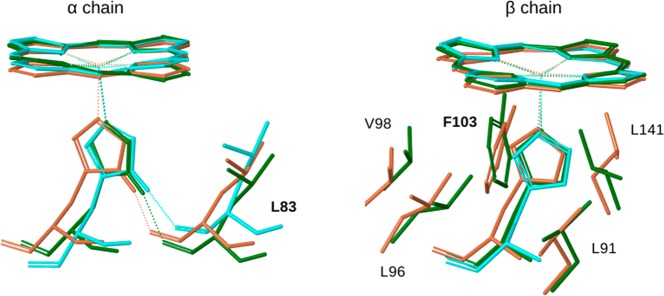
Overlay of heme, the proximal histidine, and relevant contacting residues for the initial (light brown) and intermediate (green) PELE structures, and for deoxyHb (PDB 1A3N;8 cyan).
To investigate the origin of these structural differences between the evolving α and β chains, we turned to correlation analysis. The Cα correlation maps between the PELE intermediate and the initial structure show quite different patterns for the two chains (Figure 8). In the α chains, the displacements are positively correlated for the first 75 residues (A, B, C and E helices and the EF corner), but they correlate poorly with the next 25 residues, which contain the F and part of the G helices. In particular the correlation between the E (55–70) and F (75–90) helices is essentially null, meaning that they move in orthogonal directions. In contrast, the E and F helix displacements are positively correlated in the β chains, while the E and B helices are anticorrelated with the A helix.
Figure 8.
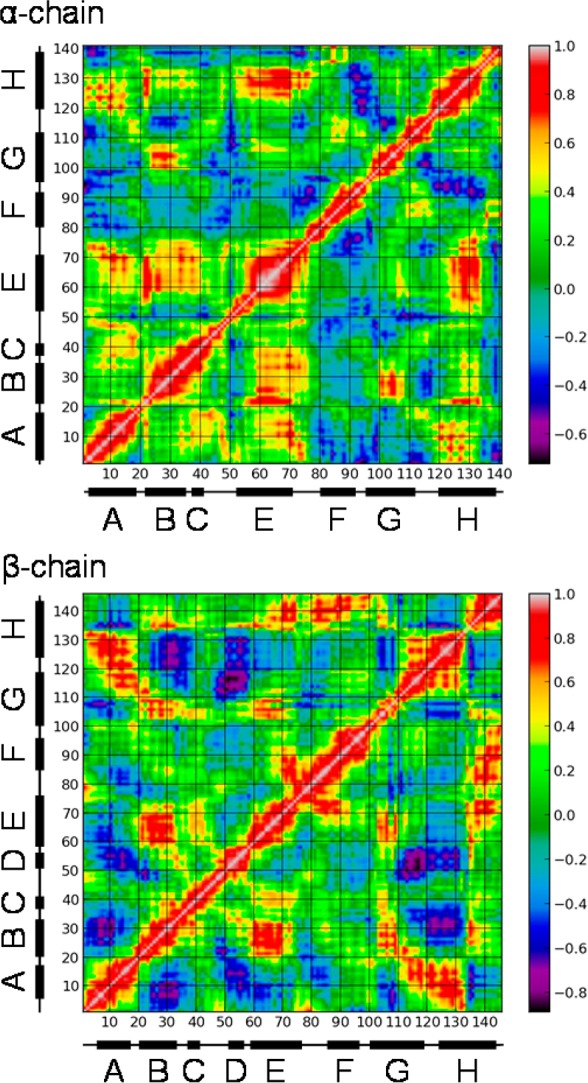
Covariance matrix for successive residue Cα displacements along the trajectory between initial and intermediate PELE structures. The bar at the right shows the color scale from positive (white) to negative (black) correlation. Orthogonal movements result in correlations with values near 0.0 (green). Successive helices are indicated by black bars with letter labels.
Figure 9 illustrates the differing displacements of the E and F helices, which sandwich the heme group. Two orientations are shown, in the EF plane (left), and perpendicular to it (right), with the hemes superposed. In the β chain, the E and F helices move in the same direction between the initial (light brown) and intermediate (green) PELE structures, toward the protein exterior (right view) and also toward the EF corner (left view). However, they move oppositely in the α chain, the F helix again moving out and toward the EF corner, while the E helix moves in and away from the EF corner. This difference may be partly due to packing constraints in the EF corner, which are more pronounced for the β chain (represented in Figure 9 by the Pheβ85 and Leuβ81 side chains) than for the α chain. In addition, the H helix may play a role, via H-bonds from the penultimate residue, Tyrα140 and Tyrβ145 to the F helix residues Proα77 and Valβ98, respectively, and salt-bridges from Gluα116 and Gluβ121 to the A helix residues Lysα16 and Lysβ17, respectively. Indeed, these regions are significantly correlated in the α chain (Figure 8). The differing orientations of these connections (Figure 9) may guide the E and F helices in different directions, as reflected in the E and A helices being correlated for the α chains but anticorrelated in the β chains.
Figure 9.

Ribbon diagram of the E and F helices for the PELE intermediate (green helices; Valα62/β67 in cyan) and initial (light brown helices; Valα62/β67 in orange) structures with hemes superposed. The remaining helices are represented by cylinders. Also shown are packing residues (blue) at the EF corner, and residues (magenta) forming key interhelical H-bonds and salt-bridges.
In the β chain, the concerted helix displacements lead to steric contacts with the heme that induce out-of-plane distortions, especially Pheβ103, which presses against one of the pyrrole rings (Figure 7). This residue was identified in earlier QM/MM computations as making an important contribution to T–R oxygen affinity difference in Hb.90 Corresponding contacts are attenuated in the α chain, although the α heme also distorts, perhaps due to contacts of the peripheral substituents. Displacements of the heme are strongly correlated with those of the E helix in the β chain, but less so for the α chain (Figure S3, Supporting Information).
In the α chain, the orthogonal motion of the E and F helices induces tilting of the Fe–His bond, due to the proximal His residue, Hisα87, becoming displaced relative to the heme. We found that the tilting is largely mediated by the H-bond connecting Hisα87 with the backbone carbonyl of the upstream residue, Leuα83 (see Figure 7). When the strength of this H-bond was lowered in silico, by reducing the atomic charge of the donor (from 0.42 to 0.1) and increasing that of the acceptor (from −0.5 to −0.1), the Fe–His tilt was reduced by half. An important role of this H-bond in regulation of oxygen affinity has previously been found for other globins and on the basis of computational studies.87
Discussion
A central issue in understanding allostery is to establish the connection between function and structure, both tertiary and quaternary. For hemoglobin, crystallography has established allosteric end-state structures, as well as structures of variants and derivatives which plausibly represent intermediate states on the allosteric pathway.6 However, the details of this pathway, and the forces that guide the protein along it, remain to be determined.
In this work, we focus on the frequency of the Fe–His stretching vibration as a monitor of heme reactivity. Ligation of heme by O2, or by its surrogate CO, requires Fe to be drawn into the heme plane from its out-of-plane position in deoxy-heme. Forces that retard this motion lower the binding affinity. They also weaken the Fe–His bond in deoxy-heme, and lower its vibrational frequency. νFeHis has been correlated with the affinities26 and binding rates91 of ligands in various Hb preparations. In addition, we have shown17 that the HbCO photolysis yield declines in parallel with increasing νFeHis of the photoproduct as T-state Hb gels evolve toward the R state; the decline in yield reflects a corresponding increase in the rate of geminate recombination.
Heme reactivity is the not the sole determinant of ligand affinity, as is clearly seen in the differing νFeHis for α and β chains, despite their having essentially the same O2 affinities.92 On the basis of early crystal structures, Perutz proposed that oxygen affinity is reduced in T-state β chains by movement of the E helix residues His(E7) and Val(E11) over the heme iron.89 Removal of steric hindrance with His(E7)Gly and Val(E11)Ala mutations confirmed this idea for β chains.93,94 These same mutations in α chains showed that crowding of the binding site is relatively unchanged between the R and T states,95 indicating a dominant role for proximal control of affinity.92,95
A high level of Fe–His strain for T-state α chains was initially found by the appearance of spectral signatures of pentacoordinate heme upon reaction of NO, which exerts a strong trans effect, with Hb stabilized in the T state.96−98 The assignment of α-specific rupture of the Fe–His bond was later confirmed in crystallographic studies.99 In another approach, Barrick et al. severed the heme-protein link by replacing the proximal histidine, His(F8), with glycine and adding imidazole to serve as the proximal ligand.100 Binding of CO to these constructs fully disrupted the T-state quaternary contacts when the link was severed only in the β chains, but not when it was severed only in the α chains. Thus, the proximal linkage in the α but not the β chains is critical to the T–R transition, consistent with the greater proximal effect on heme reactivity in the α chains. Barrick et al. also reported that CO affinity is controlled entirely by proximal effects in α chains.100
The compensation of heme reactivity and steric factors produce similar oxygen equilibria for both chains; chain equivalence is a fundamental requirement for maximum cooperativity in binding to the tetramer.92 This compensation is illuminated by our previous QM/MM computation of the structural factors contributing to the ligation energy differences between the R and T states.90 When protein constraints were relaxed in silico, the contribution of the proximal imidazole to T-state destabilization of the heme-CO adduct was found to be 1.3 kcal/mol greater in the α than the β chains (consistent with the νFeHis shifts reported here) while the contribution of the heme plus the CO (reflecting nonbonded contacts) was 1.4 kcal/mol greater in the β than the α chains, suggesting compensation between proximal strain and nonbonded forces (see Supporting Information Table S3 in ref (90)).
Here, we monitor the evolution of νFeHis, an indicator of heme reactivity, independently for each chain through the R/T conformational evolution and likewise find a larger effect in the α chain. Although we cannot monitor steric factors spectroscopically, it is likely that they evolve in concert with the observed νFeHis shifts, due to the associated E helix motions, as discussed below. Figure 10 provides a summary of νFeHis values in various deligated states: the photoproduct, prior to local relaxation; the R state and the T state for each chain; and the effect of adding IHP.
Figure 10.
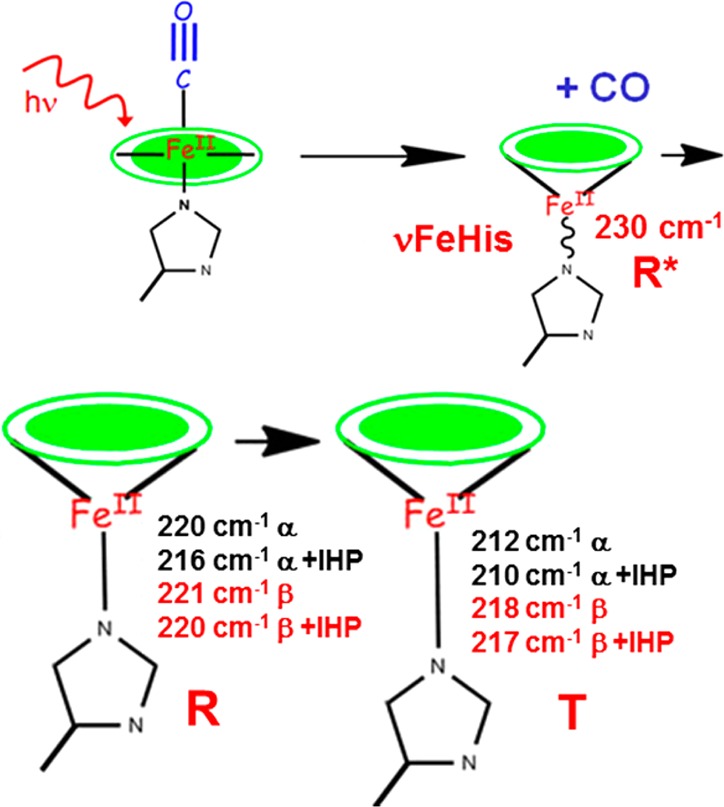
Schematic diagram of νFeHis values (gel data) following HbCO photolysis. The value is elevated in the prompt photoproduct (R*, top right) because of FeHis bond compression. Relaxation of the local environment permits heme relaxation in the R state (lower left) with similar νFeHis values in the two chains. In the T state (lower right), νFeHis is lowered markedly in the α chains due to Fe–His tilting. IHP has a large effect on νFeHis for the α, but not the β chains in the R state or either chain in the T state.
Tertiary Structure Controls Heme Reactivity within the Tetramer
Our previous gel encapsulation study of native HbA established that, following ligation or deligation, νFeHis evolved to values characteristic of the eventual quaternary structure, R or T, well before the quaternary transition itself took place.17 The present work extends these results to the individual chains, α and β, which evolve separately to the eventual R and T νFeHis values, prior to the quaternary transition. Furthermore, these observations are supported by computational modeling where protein relaxation following deligation in one chain is coupled with QM/MM frequency calculations. Along the simulations, the other three chains remain ligated, and the quaternary structure remains R. For both α and β chains, the QM/MM-computed νFeHis decreases by a similar amount to that observed in the gel experiments.
Together, these results establish that heme reactivity is controlled exclusively by tertiary forces within the Hb tetramer. Once the ligand is bound or released, the tertiary forces induce a structure change that switches the reactivity to the high and low values that have classically been associated with the R and T states. Subsequently, the subunits rearrange to the R and T quaternary structures.
The local forces initiated by ligation and deligation of the heme are readily understood. The downward displacement of the Fe atom as it loses the ligand and becomes 5-coordinate and high-spin, impels displacement of the F-helix, to which the proximal histidine ligand is attached. Resistance to this displacement can be seen in the elevated νFeHis frequency of the immediate CO-heme photoproduct; this frequency elevation is well modeled in the present QM/MM calculation where we constrained the backbone motion. Releasing this constraint lowers νFeHis by 10 cm–1, due to the relief of Fe–His bond compression. This lowering is the same as the νFeHis difference seen experimentally between the immediate photoproducts for HbCO and MbCO.9,26,70,82 For Mb, the subsequent νFeHis evolution is very small, 1 cm–1, but in Hb νFeHis drops by ∼6 cm–1 within ∼70 ns, corresponding to the lifetime of the first tertiary intermediate detected by UVrR spectroscopy,70,71,101 designated Rdeoxy. This intermediate is associated with the breaking of interhelical H-bonds involving the E and F helices. Thus, Hb has a built-in resistance to heme relaxation, which is absent in Mb (which does not have the same interhelical H-bonds102).
From previous studies, it is known that an invariant valine residue on the E helix (Valα62 and Valβ67, Figure 9) provides the main steric contact with ligands bound to the heme, and that loss of this contact upon deligation impels E helix displacement.73,103 Our previous UVrR study in gels showed that the E helix displacement precedes the F helix displacement.17 These two displacements are associated with successive stages of νFeHis lowering. Thus, the deligation-induced Fe out-of-plane movement begins in concert with the E helix displacement, and then increases as the F helix is displaced.
While the helix displacements are common to both chains (as evidenced by separate UVrR signal disappearances when the interhelical H-bond partners are separately mutated in the two chains104−106), the PELE computations reveal that they are guided in different directions within the tetramer. In the β chain, the E and F helices move in the same direction, so that the Fe–His bond orientation is unaltered. The modest νFeHis lowering associated with this shift can be attributed to enhanced heme out-of-plane distortion, due to steric contacts. In contrast the E and F helices move in orthogonal directions for the α chain, producing heme distortion and tilting of the Fe–His bond, and a more pronounced lowering of νFeHis. These differing relative displacements may be guided by differing packing arrangements in the EF corner, and with differing orientations of H-bonds and salt bridges connecting the H helix with the F and A helices (Figure 9).
Coupling of Tertiary and Quaternary Motions
Gel encapsulation shows that the β chain νFeHis evolves faster in the β than in the α chains, when the quaternary structure is frozen (Figure 3). The two time constants are 5× and 2× shorter for β than for α (Table 1). The solution pump–probe measurements (Figure 3) show that, when the constraint on quaternary motion is removed, the α chain νFeHis remains at its R state value until the final stage (20 μs) of the quaternary transition (the switch), whereas the β chain time course shows an inflection at the time (3 μs) of the first quaternary stage (the hinge), before finishing the β νFeHis shift to its low affinity value, in concert with the switch.
These results are in remarkable accord with the allosteric pathway computed by Fischer et al.,13 using the conjugate peak refinement (CPR) method.107 In this pathway, the quaternary transition occurs in two steps, as anticipated by the UVrR results.10 In the R–T direction, the first step, Q2 (numbered in the reverse direction), produces a much larger change in quaternary structure than the second step, Q1. This prediction accords with the results of time-resolved WAXS (wide-angle X-ray scattering) measurements,12 in which the main shape change of the Hb tetramers was found at 3 μs, coincident with the UVrR-detected hinge step. Q2 is found by CPR to involve a 6° rotation of one αβ dimer against the other, with altered α1β2 contacts in the hinge region. The β chains move apart.
Q2 is preceded by significant alteration in the β chain tertiary structure, with little tertiary change in the α chains.8 This prediction is in accord with our findings that in gels, νFeHis evolves faster in β than in α chains, while in solution, the νFeHis progress curve shows an inflection at 3 μs (Q2) for β but not for α chains.
In the second step, Q1, the α chains move farther apart, and rotate 3° relative to the β chains, bringing the switch contacts into register at the α1β2 interface, consistent with the UVrR switch signal at 20 μs.5 Q1 is accompanied by a major change in the α chain tertiary structure, consistent with the large change in α chain νFeHis at 20 μs.
The picture that emerges from these experimental and computational results is that deligation within the R structure induces a faster tertiary response in the β than in the α chains, whether the quaternary motion is constrained or not. A possible reason is that the β chain has a longer CD loop at the end of the E helix (Figure 9), providing flexibility, and perhaps allowing a faster E helix response to deligation than in the more restricted α chain. The role of the CD loop in the dynamics of Mb, whose chain movements are similar to those of the Hb β chain has been discussed in previous work.33 In solution, without external restraint on the quaternary motion, the β chain tertiary motion drives rotation of the αβ dimers around the hinge. Subsequently, the slower tertiary motion of the α chains drives reorientation of the α chains, closing the switch and completing the R–T transition.
In the T–R direction, the CPR-computed trajectory is reversed. Experimentally, the T–R sequence has not been monitored in solution, because ligation is slower than the protein structure changes. In gels, these changes are slowed sufficiently to allow spectroscopic observation following ligation of deoxyHb with CO. There are small but prompt UVrR signal changes associated with both the switch and hinge contacts, indicating that ligation immediately loosens the T-state quaternary contacts.17 The small UVrR signals only approach the amplitude expected for the quaternary transition after about a week,17 while much earlier changes are seen in the photoproduct νFeHis, which evolve from low to high values on the same time scale as the opposite changes seen upon deligation of HbO2 gels. In the T–R direction, however, there is no significant rate difference between the α and β chains.
Thus, the experimentally monitored T–R changes in the gels are not quite the reverse of the R–T changes. Ligation-induced forces first weaken the quaternary contacts, then impel tertiary evolution within both chains, more-or-less simultaneously, after which the quaternary transition is completed. The discrepancy with the CPR trajectory is understandable, since the CPR method does not permit changes in heme ligation. The trajectory was computed for unligated Hb transitioning between T and R quaternary structure. The gel experiments indicate that ligation within the T structure requires loosening of the quaternary contacts before evolution toward the R structure. This inference is strongly supported by the reported structure of a deoxyHb crystal that is oxygenated at low temperature.108 All four hemes are ligated by O2, and quaternary contacts are strained at both the switch and the hinge. Moreover, the Fe–His bond is lengthened in the α chains, while the heme is buckled in the β chains, providing a structural explanation of the initially low photoproduct νFeHis values in the freshly ligated gels.
Implications for the Tertiary Two State Model
The tertiary two-state (TTS) model posits that low- and high-affinity tertiary structures, t and r, can coexist within each quaternary structure, which bias the tertiary populations.27 The r and t structures are favored in the R and T states, respectively, but both are present in each state, their populations determining the ligand binding partition function.
The model was inspired by the finding that when CO was bound to deoxyHb gels, recombination following photolysis showed two phases, with rates that matched those that had been associated with R- and T-state tetramers.20 Since the gel kept the protein in the T state, the faster R-like rate must have resulted from a reactive tertiary structure.
Our finding that νFeHis, a marker of heme reactivity, evolves toward an R-like value while the gel-constrained protein remains in the T state, fully supports this view. Likewise its evolution toward a T-like value while the protein remains in the R state supports the basic tenet of the TTS model that both quaternary states harbor high- and low-reactivity tertiary structures. The α and β subunit νFeHis frequencies are essentially the same in the R state, and although they differ substantially in the T state, the ligation rate is similar, because of differing steric factors, as discussed above. Consequently, it is not surprising that single R-like and T-like rates were observed in the gel CO recombination experiments, despite differing subunit structures.
However, our computations indicate that the intermediate tertiary structure resulting from deligation of a single subunit only partially resembles the tertiary structure found in the T state, even though the correct νFeHis frequency shift is predicted. Thus, the R-state t structure (tR) of the TTS model is quite different from the T-state t structure (tT), although the two structures are functionally equivalent. That the complete tertiary change is not likely to occur within a given quaternary structure seems reasonable. The monomers are not independent but interact with intermolecular contacts; therefore, their structural change should be correlated to the whole tetramer rearrangement in space. A recent MD study109 showed that during the T → R transition, the Hb subunits approach the R-like conformation only in the final stage of the quaternary change. Most likely the R- and T-state r (rR and rT) structures are also different. It appears that the Hb architecture is designed to allow ligation and deligation to induce tertiary changes in the heme surroundings that shift the subunit reactivity between low and high values, while leaving the subunit as a whole in an intermediate tertiary configuration. These surroundings, the E and F helices and the FG corner, correspond to the “allosteric core” identified many years ago by Gelin and Karplus16 in their pioneering molecular mechanics study of Hb.
Subsequent rearrangement of the tertiary configuration accompanies the quaternary shift between R and T, but is without further effect on heme reactivity. This separation of functional response between the two phases of tertiary change is what makes the TTS model viable.
Role of Effectors
Polyanionic effectors like BPG (2,3-bisphosphoglycerate) and IHP stabilize the T quaternary structure of Hb by binding to its central cavity, which is lined with cationic sites.110 This cavity narrows in the R state, expelling the effector. IHP addition to deoxyHb has little effect on νFeHis, in either the α or β chain. It also has minimal effects on the kinetics of νFeHis evolution for the HbCO photoproduct in T-state gels, again for either chain. Thus, in the T state, IHP does not alter heme reactivity and must exert its influence on ligand affinity through other structural mechanisms. (Viapianni et al.20 reported that a combination of strong effector molecules, IHP and bezafibrate, suppressed the faster R-like CO recombination rate in T-state HbCO gels. We were unable to explore this combination in our experiments because of strong Raman scattering from bezafibrate.)
In the R state, however, IHP dramatically lowers νFeHis and accelerates its evolution following deligation. This effect is consistent with Yonetani’s observations of large effector-induced affinity lowering within the R state.111 Long ago, Marden et al. showed that effectors lower the last of the four ligand binding equilibrium constants when Hb is clearly in the R state. Marden concluded that while effectors influence the T-state affinity and the allosteric equilibrium, they have an even larger effect on R state affinity.
We now find that the R state IHP effect on νFeHis is largely localized to the α chains. Consistent with this finding, an NMR study of HbCO (R state) by Ho and co-workers112 found that IHP greatly increases conformational dynamics around the interdimer interface, especially in the F helix and FG corner of the α chains. What accounts for these α-specific effects? No crystal structure is available for IHP bound near the α subunits in an R state Hb tetramer. However, we note that when HbO2 was crystallized from phosphate buffer at pH 8.5, a phosphate ion was bound in the cleft between the α chains, bridging the two Lysα99 side chains (PDB 1HHO),113 which are near the FG corner (Figure 11). This is also one of the sites that Fan et al.114 found to be consistent with their NMR study of IHP binding to HbCO.
Figure 11.
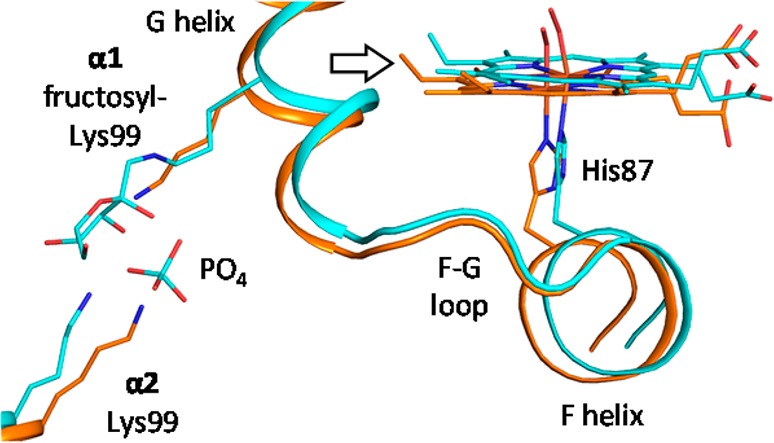
Superposition of the Hb structures with bound phosphate, aligned via the Cα atoms of both α chains, showing the displacement of the FG region and the F helix between native HbO2 (orange; PDB 1HHO(113)) and the Lysα99-fructosyl derivative (cyan; PDB 3B75(115)).
Another crystal structure, in which Lysα99 has been derivatized with fructose (PDB 3B75),115 shows displacement of the FG corner and the F helix (Figure 11), resulting in tilting of the Fe–His bond (the “C” pyrrole nitrogen–iron–His Nε angle decreasing to 82° from 92° in the HbO2 structure) and also of the proximal imidazole ring with respect to the Fe–His bond, the Fe–N–Cδ(imidazole) angle increasing from 127° in the HbO2 structure (essentially its normal 126° value) to 144° in the fructosyl derivative. We speculate that the combination of phosphate and a nearby fructose mimics binding of the bulky IHP molecule in the R state α cleft, resulting in similar helix displacement and proximal His tilting, with consequent lowering of the α chain νFeHis. Thus, the availability of the inter-Lysα99 binding site may account for the strong α-specific IHP influence on heme reactivity in the R state.
Conclusions
Combining the available experimental and computational results, we obtain the following view of the mechanism of Hb allostery:
(1) Ligand detachment from R-state ligated protein produces unrelaxed deoxy-heme, with a compressed Fe–His bond in Hb, but not in Mb. The immediate protein environment relaxes in tens of nanoseconds in Hb, but is already relaxed by 2 ps in Mb.
(2) Subsequent evolution within the R state produces an intermediate tertiary structure, with functional properties that are associated with the T state. In the β chains, the packing of surrounding residues enhances the out-of-plane distortion of the deoxy-heme, while in the α chains, orthogonal motions of the E and F helices produce Fe–His bond tilting as well as heme distortion.
(3) Structural evolution is faster for the β than the α chains. In solution, the β chain evolution induces the main quaternary transition, at 3 μs, during which the αβ dimers rotate, and establish the T “hinge” contacts between the β1 C helix and the α2 FG corner. The α chain evolution induces the second transition, at 20 μs, during which the α chains rotate into their final position, establishing the T “switch” contacts between the α2 C helix and the β1 FG corner.
(4) In the reverse direction, ligation in the gel-encapsulated T state requires loosening of quaternary contacts, but tertiary structures then evolve from low to high-affinity function, in this case at essentially the same rate for α and β chains, before the quaternary transitions. The structure sequence has not been monitored in solution because ligation is slower than protein structure change.
(5) The finding that intermediate tertiary structures can have low or high heme reactivity within both quaternary states supports the tertiary two-state model of ligand binding, although it is clear that the intermediate structures are not the same as the end-state tertiary structures. In other word, rR and tR are not the same as rT and tT.
(6) The allosteric effector IHP has a large effect on R state heme reactivity, specifically in the α chains. This effect is suggested to result from IHP binding to the two facing Lysα99 residues in the cleft between the α chains, resulting in displacement of the F helix and FG corner that tilt the Fe–imidazole linkage, and weaken the Fe–His bond. IHP has little effect on heme reactivity in the T state, but instead stabilizes the T structure.
Many pieces of the allosteric puzzle are still missing, particularly the role of partially ligated states, and the mechanisms by which the intermediate tertiary structures induce the quaternary transitions.
Historically, hemoglobin has served as a model for other allosteric proteins. It may be that access to intermediate tertiary structures with functional properties characteristic of end-state quaternary structures is a general property of allosteric systems.
Acknowledgments
This work was supported by NIH Grant GM 25158 (to T.G.S.), the ERC 2009-Adg25027-PELE and the Spanish Ministry of Education and Science project CTQ2010-18123 (to V.G.), and NSF MCB 0951110 (to J.R.K.).
Supporting Information Available
Static UVrR difference spectra between deoxyHb and HbCO (T–R) for HbA and for hybrid Hb’s with mesoheme replacing protoheme in the α or β chains, error surface analysis, and cross correlation of average heme pyrrole N atom displacements along the PELE trajectory with the Cα displacements in the α (red) and β (blue) chains. This material is available free of charge via the Internet at http://pubs.acs.org.
Author Present Address
⊥ Department of Chemistry and Biochemistry, California Polytechnic State University, San Luis Obispo, California 93407, United States.
Author Contributions
# E. M. Jones and E. Monza contributed equally to this work.
The authors declare no competing financial interest.
Funding Statement
National Institutes of Health, United States
Supplementary Material
References
- Perutz M. F.; Muirhead H.; Cox J. M.; Goaman L. C. G. Nature 1968, 219, 131. [DOI] [PubMed] [Google Scholar]
- Fermi G.; Perutz M. F.; Shaanan B.; Fourme R. J. Mol. Biol. 1984, 175, 159. [DOI] [PubMed] [Google Scholar]
- Monod J.; Wyman J.; Changeux J. P. L. J. Mol. Biol. 1965, 12, 88.14343300 [Google Scholar]
- Berg J. M.; Tymoczko J. L.; Stryer L.; Stryer L.. Biochemistry, 5th ed.; W.H. Freeman: New York, 2002. [Google Scholar]
- Baldwin J.; Chothia C. J. Mol. Biol. 1979, 129, 175. [DOI] [PubMed] [Google Scholar]
- Safo M. K.; Ahmed M. H.; Ghatge M. S.; Boyiri T. Biochim. Biophys. Acta 2011, 1814, 797. [DOI] [PubMed] [Google Scholar]
- Lukin J. A.; Kontaxis G.; Simplaceanu V.; Yuan Y.; Bax A.; Ho C. Proc. Natl. Acad. Sci. U. S. A. 2003, 100, 517. [DOI] [PMC free article] [PubMed] [Google Scholar]
- Tame J. R. H.; Vallone B. Acta Crystallogr., Sect. D: Biol. Crystallogr. 2000, 56, 805. [DOI] [PubMed] [Google Scholar]
- Balakrishnan G.; Ibrahim M.; Mak P. J.; Hata J.; Kincaid J. R.; Spiro T. G. J. Biol. Inorg. Chem. 2009, 14, 741. [DOI] [PMC free article] [PubMed] [Google Scholar]
- Balakrishnan G.; Case M. A.; Pevsner A.; Zhao X.; Tengroth C.; McLendon G. L.; Spiro T. G. J. Mol. Biol. 2004, 340, 843. [DOI] [PubMed] [Google Scholar]
- Goldbeck R. A.; Esquerra R. M.; Kliger D. S. J. Am. Chem. Soc. 2002, 124, 7646. [DOI] [PubMed] [Google Scholar]
- Cammarata M.; Levantino M.; Wulff M.; Cupane A. J. Mol. Biol. 2010, 400, 951. [DOI] [PubMed] [Google Scholar]
- Fischer S.; Olsen K. W.; Nam K.; Karplus M. Proc. Natl. Acad. Sci. U. S. A. 2011, 108, 5608. [DOI] [PMC free article] [PubMed] [Google Scholar]
- Koshland D. E. Jr.; Nemethy G.; Filmer D. Biochemistry 1966, 5, 365. [DOI] [PubMed] [Google Scholar]
- Daugherty M. A.; Shea M. A.; Johnson J. A.; LiCata V. J.; Turner G. J.; Ackers G. K. Proc. Natl. Acad. Sci. U. S. A. 1991, 88, 1110. [DOI] [PMC free article] [PubMed] [Google Scholar]
- Gelin B. R.; Lee A. W. M.; Karplus M. J. Mol. Biol. 1983, 171, 489. [DOI] [PubMed] [Google Scholar]
- Jones E. M.; Balakrishnan G.; Spiro T. G. J. Am. Chem. Soc. 2012, 134, 3461. [DOI] [PMC free article] [PubMed] [Google Scholar]
- Juszczak L. J.; Friedman J. M. J. Biol. Chem. 1999, 274, 30357. [DOI] [PubMed] [Google Scholar]
- Shibayama N.; Saigo S. J. Am. Chem. Soc. 1999, 121, 444. [DOI] [PubMed] [Google Scholar]
- Viappiani C.; Bettati S.; Bruno S.; Ronda L.; Abbruzzetti S.; Mozzarelli A.; Eaton W. A. L. Proc. Natl. Acad. Sci. U. S. A. 2004, 101, 14414. [DOI] [PMC free article] [PubMed] [Google Scholar]
- Das T. K.; Khan I.; Rousseau D. L.; Friedman J. M. L. Biospectroscopy 1999, 5, S64. [DOI] [PubMed] [Google Scholar]
- Khan I.; Shannon C. F.; Dantsker D.; Friedman A. J.; Perez-Gonzalez-de-Apodaca J.; Friedman J. M. Biochemistry 2000, 39, 16099. [DOI] [PubMed] [Google Scholar]
- Peterson E. S.; Shinder R.; Khan I.; Juczszak L.; Wang J. Q.; Manjula B.; Acharya S. A.; Bonaventura C.; Friedman J. M. Biochemistry 2004, 43, 4832. [DOI] [PubMed] [Google Scholar]
- Samuni U.; Dantsker D.; Juszczak L. J.; Bettati S.; Ronda L.; Mozzarelli A.; Friedman J. M. Biochemistry 2004, 43, 13674. [DOI] [PubMed] [Google Scholar]
- Samuni U.; Roche C. J.; Dantsker D.; Juszczak L. J.; Friedman J. M. Biochemistry 2006, 45, 2820. [DOI] [PMC free article] [PubMed] [Google Scholar]
- Matsukawa S.; Mawatari K.; Yoneyama Y.; Kitagawa T. J. Am. Chem. Soc. 1985, 107, 1108. [Google Scholar]
- Henry E. R.; Bettati S.; Hofrichter J.; Eaton W. A. Biophys. Chem. 2002, 98, 149. [DOI] [PubMed] [Google Scholar]
- Jeyarajah S.; Kincaid J. R. Biochemistry 1990, 29, 5087. [DOI] [PubMed] [Google Scholar]
- Kaminaka S.; Zhou Y. X.; Tsuneshige A.; Yonetani T.; Kitagawa T. J. Am. Chem. Soc. 1994, 116, 1683. [Google Scholar]
- Ondrias M. R.; Rousseau D. L.; Kitagawa T.; Ikedasaito M.; Inubushi T.; Yonetani T. J. Biol. Chem. 1982, 257, 8766. [PubMed] [Google Scholar]
- Borrelli K. W.; Vitalis A.; Alcantara R.; Guallar V. J. Chem. Theory Comput. 2005, 1, 1304. [DOI] [PubMed] [Google Scholar]
- Antonini E.; Brunori M.. Hemoglobin and Myoglobin in Their Reactions with Ligands; North-Holland Pub. Co.: Amsterdam, 1971. [Google Scholar]
- Guallar V.; Jarzecki A. A.; Friesner R. A.; Spiro T. G. J. Am. Chem. Soc. 2006, 128, 5427. [DOI] [PubMed] [Google Scholar]
- Riggs A. In Methods in Enzymology; Academic Press: Waltham, MA, 1981; Vol. 76, p 5.7329272 [Google Scholar]
- Ascoli F.; Rossi Fanelli M. R.; Antonini E.; Eraldo Antonini L. R.-B. a. E. C. In Methods in Enzymology; Academic Press: Waltham, MA, 1981; Vol. 76, p 72. [DOI] [PubMed] [Google Scholar]
- Yip Y. K.; Waks M.; Beychok S. J. Biol. Chem. 1972, 247, 7237. [PubMed] [Google Scholar]
- Bucci E.; Eraldo Antonini L. R.-B. a. E. C. In Methods in Enzymology; Academic Press: Waltham, MA, 1981; Vol. 76, p 97.6173568 [Google Scholar]
- Geraci G.; Parkhurs Lj; Gibson Q. H. J. Biol. Chem. 1969, 244, 4664. [PubMed] [Google Scholar]
- Yip Y. K.; Waks M.; Beychok S. Proc. Natl. Acad. Sci. U. S. A. 1977, 74, 64. [DOI] [PMC free article] [PubMed] [Google Scholar]
- Ikeda-Saito M.; Inubushi T.; Yonetani T.; Eraldo Antonini L. R.-B. a. E. C. In Methods in Enzymology; Academic Press: Waltham, MA, 1981; Vol. Vol. 76, p 113. [DOI] [PubMed] [Google Scholar]
- Makino N.; Sugita Y. J. Biol. Chem. 1978, 253, 1174. [PubMed] [Google Scholar]
- Podstawka E.; Proniewicz L. M. J. Inorg. Biochem. 2004, 98, 1502. [DOI] [PubMed] [Google Scholar]
- Yamamoto H.; Yonetani T. J. Biol. Chem. 1974, 249, 7964. [PubMed] [Google Scholar]
- Beechem J. M.; Haas E. Biophys. J. 1989, 55, 1225. [DOI] [PMC free article] [PubMed] [Google Scholar]
- Zhao X. J.; Tengroth C.; Chen R. P.; Simpson W. R.; Spiro T. G. J. Raman Spectrosc. 1999, 30, 773. [Google Scholar]
- Silva M. M.; Rogers P. H.; Arnone A. J. Biol. Chem. 1992, 267, 17248. [PubMed] [Google Scholar]
- Hersleth H. P.; Uchida T.; Rohr A. K.; Teschner T.; Schuenemann V.; Kitagawa T.; Trautwein A. X.; Gorbitz C. H.; Andersson K. K. J. Biol. Chem. 2007, 282, 23372. [DOI] [PubMed] [Google Scholar]
- Phillips S. E. V. J. Mol. Biol. 1980, 142, 531. [DOI] [PubMed] [Google Scholar]
- Protein Preparation Wizard, Epik version 2.3; Schrödinger, LLC: New York, 2012.
- Desmond Molecular Dynamics System, version 3.1; D. E. Shaw Research: New York, 2012.
- Kaminski G. A.; Friesner R. A.; Tirado-Rives J.; Jorgensen W. L. J. Phys. Chem. B 2001, 105, 6474. [Google Scholar]
- Nose S. J. Chem. Phys. 1984, 81, 511. [Google Scholar]
- Martyna G. J.; Tobias D. J.; Klein M. L. J. Chem. Phys. 1994, 101, 4177. [Google Scholar]
- Tuckerman M.; Berne B. J.; Martyna G. J. J. Chem. Phys. 1992, 97, 1990. [Google Scholar]
- Essmann U.; Perera L.; Berkowitz M. L.; Darden T.; Lee H.; Pedersen L. G. J. Chem. Phys. 1995, 103, 8577. [Google Scholar]
- QSite, version 5.8; Schrödinger, LLC: New York, 2012.
- Becke A. D. Phys. Rev. A: At., Mol., Opt. Phys. 1988, 38, 3098. [DOI] [PubMed] [Google Scholar]
- Becke A. D. J. Chem. Phys. 1993, 98, 5648. [Google Scholar]
- Becke A. D. J. Chem. Phys. 1993, 98, 1372. [Google Scholar]
- Lee C. T.; Yang W. T.; Parr R. G. Phys. Rev. B: Condens. Matter Mater. Phys. 1988, 37, 785. [DOI] [PubMed] [Google Scholar]
- Hay P. J.; Wadt W. R. J. Chem. Phys. 1985, 82, 270. [Google Scholar]
- Cossins B. P.; Hosseini A.; Guallar V. J. Chem. Theory Comput. 2012, 8, 959. [DOI] [PubMed] [Google Scholar]
- Lucas M. F.; Guallar V. Biophys. J. 2012, 102, 887. [DOI] [PMC free article] [PubMed] [Google Scholar]
- Bahar I.; Atilgan A. R.; Demirel M. C.; Erman B. Phys. Rev. Lett. 1998, 80, 2733. [Google Scholar]
- Takahashi R.; Gil V. A.; Guallar V. J. Chem. Theory Comput. 2014, 10, 282. [DOI] [PubMed] [Google Scholar]
- Ishimori K.; Morishima I. Biochemistry 1986, 25, 4892. [DOI] [PubMed] [Google Scholar]
- Seybert D. W.; Moffat K. J. Mol. Biol. 1977, 113, 419. [DOI] [PubMed] [Google Scholar]
- Seybert D. W.; Moffat K.; Gibson Q. H. Biochem. Biophys. Res. Commun. 1975, 63, 43. [DOI] [PubMed] [Google Scholar]
- Seybert D. W.; Moffat K.; Gibson Q. H. J. Biol. Chem. 1976, 251, 45. [PubMed] [Google Scholar]
- Jayaraman V.; Rodgers K. R.; Mukerji I.; Spiro T. G. Science 1995, 269, 1843. [DOI] [PubMed] [Google Scholar]
- Rodgers K. R.; Su C.; Subramaniam S.; Spiro T. G. J. Am. Chem. Soc. 1992, 114, 3697. [Google Scholar]
- Rodgers K. R.; Spiro T. G. Science 1994, 265, 1697. [DOI] [PubMed] [Google Scholar]
- Kachalova G. S.; Popov A. N.; Bartunik H. D. Science 1999, 284, 473. [DOI] [PubMed] [Google Scholar]
- Olson J. S. Proc. Natl. Acad. Sci. U. S. A. 1976, 73, 1140. [DOI] [PMC free article] [PubMed] [Google Scholar]
- Sugita Y. J. Biol. Chem. 1975, 250, 1251. [PubMed] [Google Scholar]
- Ondrias M. R.; Rousseau D. L.; Shelnutt J. A.; Simon S. R. Biochemistry 1982, 21, 3428. [DOI] [PubMed] [Google Scholar]
- Friedman J. M.; Rousseau D. L.; Ondrias M. R. Annu. Rev. Phys. Chem. 1982, 33, 471. [Google Scholar]
- Friedman J. M.; Rousseau D. L.; Ondrias M. R.; Stepnoski R. A. Science 1982, 218, 1244. [DOI] [PubMed] [Google Scholar]
- Jayaraman V.; Spiro T. G. Biospectroscopy 1996, 2, 311. [Google Scholar]
- Scott T. W.; Friedman J. M. J. Am. Chem. Soc. 1984, 106, 5677. [Google Scholar]
- Spiro T. G.; Wasbotten I. H. J. Inorg. Biochem. 2005, 99, 34. [DOI] [PubMed] [Google Scholar]
- Mizutani Y.; Nagai M. Chem. Phys. 2012, 396, 45. [Google Scholar]
- Murakawa Y.; Nagai M.; Mizutani Y. J. Am. Chem. Soc. 2012, 134, 1434. [DOI] [PubMed] [Google Scholar]
- Samuni U.; Dantsker D.; Khan I.; Friedman A. J.; Peterson E.; Friedman J. M. J. Biol. Chem. 2002, 277, 25783. [DOI] [PubMed] [Google Scholar]
- Park S. Y.; Yokoyama T.; Shibayama N.; Shiro Y.; Tame J. R. J. Mol. Biol. 2006, 360, 690. [DOI] [PubMed] [Google Scholar]
- Jentzen W.; Song X. Z.; Shelnutt J. A. J. Phys. Chem. B 1997, 101, 1684. [Google Scholar]
- Capece L.; Marti M. A.; Crespo A.; Doctorovich F.; Estrin D. A. J. Am. Chem. Soc. 2006, 128, 12455. [DOI] [PubMed] [Google Scholar]
- Bikiel D. E.; Forti F.; Boechi L.; Nardini M.; Luque F. J.; Marti M. A.; Estrin D. A. J. Phys. Chem. B 2010, 114, 8536. [DOI] [PubMed] [Google Scholar]
- Perutz M. F. Nature 1970, 228, 726. [DOI] [PubMed] [Google Scholar]
- Alcantara R. E.; Xu C.; Spiro T. G.; Guallar V. Proc. Natl. Acad. Sci. U. S. A. 2007, 104, 18451. [DOI] [PMC free article] [PubMed] [Google Scholar]
- Friedman J. M.; Scott T. W.; Fisanick G. J.; Simon S. R.; Findsen E. W.; Ondrias M. R.; Macdonald V. W. Science 1985, 229, 187. [DOI] [PubMed] [Google Scholar]
- Unzai S.; Eich R.; Shibayama N.; Olson J. S.; Morimoto H. J. Biol. Chem. 1998, 273, 23150. [DOI] [PubMed] [Google Scholar]
- Nagai K.; Luisi B.; Shih D.; Miyazaki G.; Imai K.; Poyart C.; Deyoung A.; Kwiatkowsky L.; Noble R. W.; Lin S. H.; Yu N. T. Nature 1987, 329, 858. [DOI] [PubMed] [Google Scholar]
- Mathews A. J.; Olson J. S.; Renaud J. P.; Tame J.; Nagai K. J. Biol. Chem. 1991, 266, 21631. [PubMed] [Google Scholar]
- Tame J.; Shih D. T. B.; Pagnier J.; Fermi G.; Nagai K. J. Mol. Biol. 1991, 218, 761. [DOI] [PubMed] [Google Scholar]
- Maxwell J. C.; Caughey W. S. Biochemistry 1976, 15, 388. [DOI] [PubMed] [Google Scholar]
- Szabo A.; Perutz M. F. Biochemistry 1976, 15, 4427. [DOI] [PubMed] [Google Scholar]
- Hille R.; Olson J. S.; Palmer G. J. Biol. Chem. 1979, 254, 12110. [PubMed] [Google Scholar]
- Chan N. L.; Kavanaugh J. S.; Rogers P. H.; Arnone A. Biochemistry 2004, 43, 118. [DOI] [PubMed] [Google Scholar]
- Barrick D.; Ho N. T.; Simplaceanu V.; Ho C. Biochemistry 2001, 40, 3780. [DOI] [PubMed] [Google Scholar]
- Balakrishnan G.; Tsai C. H.; Wu Q.; Case M. A.; Pevsner A.; McLendon G. L.; Ho C.; Spiro T. G. J. Mol. Biol. 2004, 340, 857. [DOI] [PubMed] [Google Scholar]
- Sato A.; Gao Y.; Kitagawa T.; Mizutani Y. Proc. Natl. Acad. Sci. U. S. A. 2007, 104, 9627. [DOI] [PMC free article] [PubMed] [Google Scholar]
- De Angelis F.; Jarzecki A. A.; Car R.; Spiro T. G. J. Phys. Chem. B 2005, 109, 3065. [DOI] [PubMed] [Google Scholar]
- Balakrishnan G.; Zhao X.; Podstawska E.; Proniewicz L. M.; Kincaid J. R.; Spiro T. G. Biochemistry 2009, 48, 3120. [DOI] [PMC free article] [PubMed] [Google Scholar]
- Kneipp J.; Balakrishnan G.; Chen R. P.; Shen T. J.; Sahu S. C.; Ho N. T.; Giovannelli J. L.; Simplaceanu V.; Ho C.; Spiro T. G. J. Mol. Biol. 2006, 356, 335. [DOI] [PubMed] [Google Scholar]
- Wang D. J.; Zhao X. J.; Shen T. J.; Ho C.; Spiro T. G. J. Am. Chem. Soc. 1999, 121, 11197. [Google Scholar]
- Fischer S.; Karplus M. Chem. Phys. Lett. 1992, 194, 252. [Google Scholar]
- Paoli M.; Liddington R.; Tame J.; Wilkinson A.; Dodson G. J. Mol. Biol. 1996, 256, 775. [DOI] [PubMed] [Google Scholar]
- Hub J. S.; Kubitzki M. B.; de Groot B. L. PLoS Comput. Biol. 2010, 6, e1000774. [DOI] [PMC free article] [PubMed] [Google Scholar]
- Perutz M. F. L. Annu. Rev. Physiol. 1990, 52, 1. [DOI] [PubMed] [Google Scholar]
- Yonetani T.; Park S.; Tsuneshige A.; Imai K.; Kanaori K. J. Biol. Chem. 2002, 277, 34508. [DOI] [PubMed] [Google Scholar]
- Song X. J.; Yuan Y.; Simplaceanu V.; Sahu S. C.; Ho N. T.; Ho C. Biochemistry 2007, 46, 6795. [DOI] [PMC free article] [PubMed] [Google Scholar]
- Shaanan B. Nature 1982, 296, 683. [DOI] [PubMed] [Google Scholar]
- Fan J. S.; Zheng Y.; Choy W. Y.; Simplaceanu V.; Ho N. T.; Ho C.; Yang D. W. Biochemistry 2013, 52, 5809. [DOI] [PMC free article] [PubMed] [Google Scholar]
- Syakhovich V. E.; Saraswathi N. T.; Ruff M.; Bokut S. B.; Moras D. Acta Crystallogr., Sect. F: Struct. Biol. Cryst. Commun. 2006, 62, 106. [DOI] [PMC free article] [PubMed] [Google Scholar]
Associated Data
This section collects any data citations, data availability statements, or supplementary materials included in this article.