Abstract
Triple negative breast cancer (TNBC) is characterized by multiple genetic events occurring in concert to drive pathogenic features of the disease. Here we interrogated the coordinate impact of p53, RB, and MYC in a genetic model of TNBC, in parallel with the analysis of clinical specimens. Primary mouse mammary epithelial cells (mMEC) with defined genetic features were used to delineate the combined action of RB and/or p53 in the genesis of TNBC. In this context, the deletion of either RB or p53 alone and in combination increased the proliferation of mMEC; however, the cells did not have the capacity to invade in matrigel. Gene expression profiling revealed that loss of each tumor suppressor has effects related to proliferation, but RB loss in particular leads to alterations in gene expression associated with the epithelial-to-mesenchymal transition. The overexpression of MYC in combination with p53 loss or combined RB/p53 loss drove rapid cell growth. While the effects of MYC overexpression had a dominant impact on gene expression, loss of RB further enhanced the deregulation of a gene expression signature associated with invasion. Specific RB loss lead to enhanced invasion in boyden chambers assays and gave rise to tumors with minimal epithelial characteristics relative to RB-proficient models. Therapeutic screening revealed that RB-deficient cells were particularly resistant to agents targeting PI3K and MEK pathway. Consistent with the aggressive behavior of the preclinical models of MYC overexpression and RB loss, human TNBC tumors that express high levels of MYC and are devoid of RB have a particularly poor outcome. Together these results underscore the potency of tumor suppressor pathways in specifying the biology of breast cancer. Further, they demonstrate that MYC overexpression in concert with RB can promote a particularly aggressive form of TNBC.
Keywords: basal-like breast cancer, biomarkers, cell cycle, EMT, MYC, p53, RB tumor suppressor, Triple negative breast cancer, targeted therapy
Introduction
Breast cancer is a heterogeneous disease that is categorized by defined subtypes.1,2 This classification is based on the presence of the estrogen receptor (ER), progesterone receptor (PR), and human epidermal growth factor receptor (HER2). Targeted therapies have been developed for receptor-positive breast cancers that have proven to be effective (e.g. Tamoxifen, Herceptin).3-5 However, the triple negative breast cancer (TNBC) does not express ER, PR, or HER2; therefore, these cases are historically treated with systemic chemotherapy.6,7 TNBC is known to be highly aggressive and associated with poor prognosis. Recent studies indicate that TNBC itself is likely a collection of discrete diseases.8 Aggressive forms of TNBC are characterized by the expression of basal or mesenchymal programs.2,8 In fact, the basal-like form of TNBC is the dominant subtype and is characterized by deregulated cell cycle control and loss of tumor suppressor. Particularly basal-like breast cancers exhibit frequent ocerexpression/amplification of MYC and loss of p53 and RB tumor suppressors.1,8,9 Interestingly, despite these emerging genetic hallmarks of TNBC and basal-like breast cancer, the discrete mechanistic interactions between tumor suppressors and oncogenic drivers remains surprisingly obscure.
The relationship between oncogenic drivers, MYC in particular, and disease phenotypes is exceedingly complex.10-12 MYC is a well-known oncogene that has a profound impact on gene expression through a variety of mechanisms. In particular, MYC broadly regulates transcription in and induces a host of genes that directly drive proliferation or invasion in specific contexts to fuel tumor development.13-16 Interestingly, some of these features are shared by MYC and RB through regulation of E2F1.17,18 Although, these shared molecular features are indicative of cooperation, the functional cross-talk between MYC and RB in cancer is surprisingly murky. In retinoblastoma which invariably lose RB, there is frequent amplification of N-MYC.19 However, cell and mouse models of cancer driven by MYC can show limited effects of RB loss on tumor development or in some cases apparent antagonism.20,21 Therefore, it seems that the interaction between these factors is conditioned by the cell context, and it is largely unknown how they would functionally interact in the context of breast cancer.
Outside of the well-established roles of the MYC and RB pathways in cell growth, both molecules have been associated with epithelial-to-mesenchymal transition (EMT) and invasion in various cancer types.15,18,22-24 The role for MYC in EMT and invasion has been described as context-specific, likely the result of a combination of deregulated signaling factors and dependent on additional genetic alterations. Similarly, while inactivation of RB has been associated with EMT and invasive phenotypes in cultured cells and mouse models,25-28 the mechanisms associated with this phenotype remain unclear. Interestingly, mesenchymal transitions can be associated with therapeutic resistance. Although it has been proposed that RB-deficiency alters response to a variety of therapies although this has largely been ascribed to deregulated cell cycle transitions.29,30
The current study examined the interaction of the MYC and RB pathways in mammary tumorigenesis. Results indicate that deregulation of the RB pathway cooperates with MYC overexpression to promote enhanced cell invasion and disease progression. Furthermore, RB-deficiency was associated with differential response to multiple clinically relevant therapeutics. In human TNBC samples the combined overexpression of MYC and loss of RB was associated with poor outcome.
Results
Loss of RB/p53 in mouse mammary epithelial cells promotes deregulated cell proliferation
To investigate the impact of genetic loss of specific tumor suppressors on tumorigenesis, mouse mammary epithelial cells (mMECs) were isolated from mice harboring conditional alleles of the RB1 and/or the TP53 gene. Cultured mMECs were infected with Cre-recombinase encoding or control adenoviruses. The infection resulted in efficient gene recombination as confirmed by PCR (Fig. 1A). Analysis of cell cycle distribution was determined by flow-cytometry. As shown in Fig. 1B, loss of either RB or p53 resulted in enhanced BrdU incorporation compared to wild-type mMECs. Interestingly, loss of p53 had a more significant impact on proliferation than loss of RB, and combined loss of RB/p53 in this setting did not significantly enhance proliferation over levels observed with p53 loss alone (Fig. 1B). Immunoblot analysis demonstrated elevated levels of proteins involved in cell cycle progression (i.e. Cyclin A) and DNA replication (i.e., MCM7 and PCNA) with the loss of either tumor suppressor (Fig. 1C). To examine the impact of RB/p53 loss on the organotypic behavior of the epithelial cells, 3D cell culture was performed26. Deletion of RB or p53 resulted in significant increase in acinar size, but overall structure integrity mirrored that of cell with intact tumor suppressors (Fig. 1D). The effect of combined tumor suppressor loss was additive, although acinar integrity remained largely unaffected (Fig. 1D). Together these data imply a key role of the 2 tumor suppressors in control of critical proliferative processes, but not necessarily the conversion to a malignant phenotype associated with invasive breast cancer.
Figure 1.
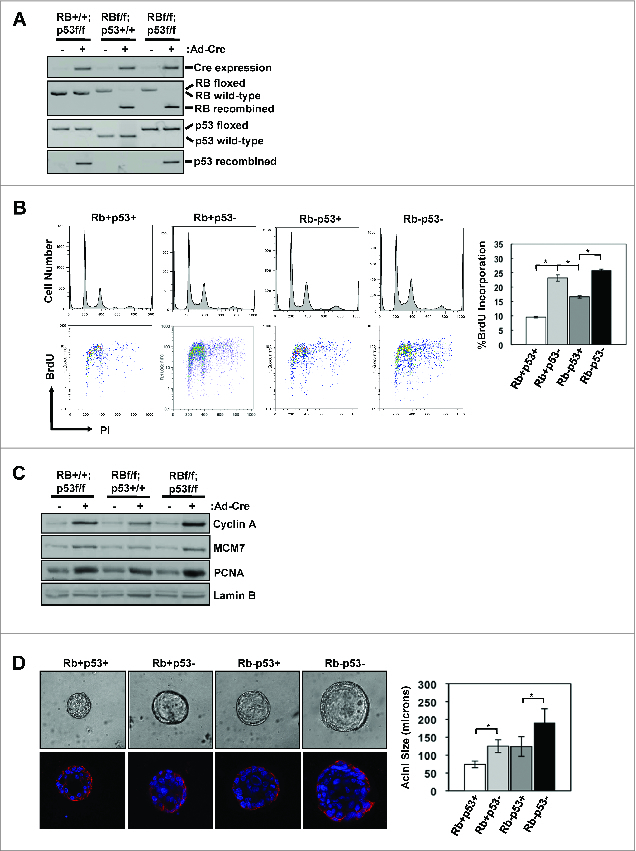
RB/p53 loss in primary mMECs promotes enhanced proliferation and acinar size. (A) The presence of Cre-recombinase was determined by RT-PCR and recombination of the Rb and p53 genes were determined by PCR analysis of genomic DNA. (B) Representative flow cytometry traces displaying cell cycle distribution (top) and BrdU incorporation (bottom) are shown. Average percent BrdU incorporation was quantified (*p < 0 .05). (C) Total protein lysates were immunoblotted for the indicated proteins. Lamin B serves as loading control. (D) Representative phase contrast images of mMEC acini grown in matrigel (top) and E-cadherin staining of acini (bottom). Phase contrast images were used to measure acini diameters and > 50 acini were scored for each genotype (*p < 0 .05).
Combined loss of RB/p53 in mammary epithelial cells alters gene expression programs controlling cell growth
The Cancer Genome Atlas data (accessed via CBioportal) indicates that TP53 loss, as determined by mutation or homozygous deletion, occurs in the vast majority of basal like breast cancer (Fig. 2A). In contrast, RB loss as determined by mutation, homozygous deletion, or significantly reduced expression, occurs in a subset of such cases (Fig. 2A). Therefore, we evaluated the specific effect of RB loss upon p53 deficient mMEC cultures by gene expression profiling (Fig. 2B). Consistent with the additive effects on proliferation, there were a number of genes that exhibited additive behavior with combined RB and p53 loss. As expected such genes were over-represented for processes associated with proliferation including DNA replication and mitosis. Surprisingly, the deletion of RB resulted in attenuation of multiple genes associated with the epithelial characteristics of the primary cells, which would be generally indicative of an EMT-like process (Fig. 2B).
Figure 2.
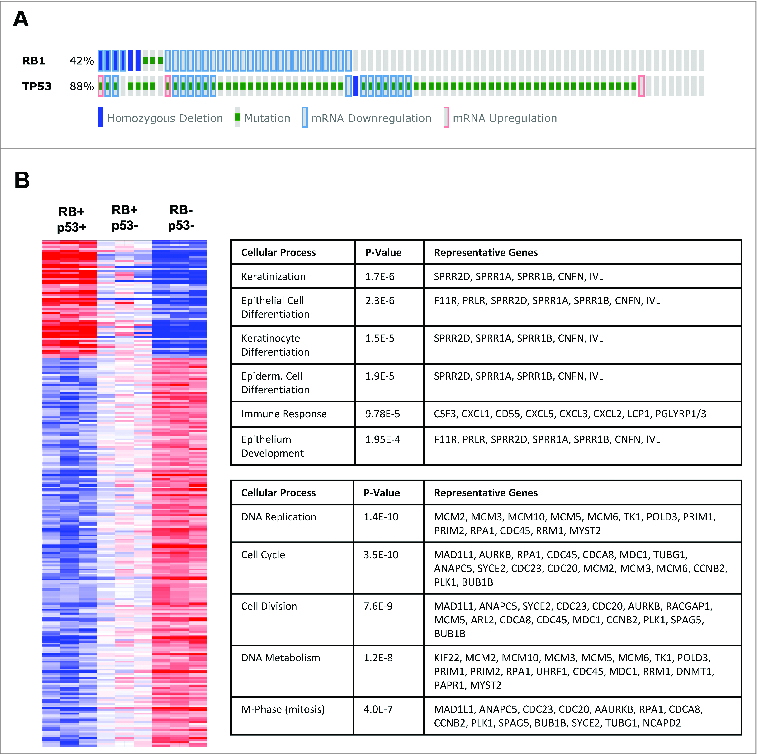
Loss of RB and p53 in primary mMECs results in additive deregulation of genes involved predominantly in cell cycle control and proliferation. (A) Analysis of TCGA data reveals common combined loss of RB and p53 in basal like breast cancer. (B) Additive changes in gene expression as a result of RB and p53 loss in mMECs compared to wild-type mMECs are displayed as a heat map. Top rated gene ontology results for upregulated (top) and downregulated (bottom) genes are highlighted in the accompanying tables.
Combined loss of RB/p53 enhances the invasive morphology of MYC-overexpressing mMECs
MYC overexpression is associated with aggressive tumor phenotypes and disease progression in breast cancer, particularly TNBC. To model RB-proficient and RB-deficient breast cancer, we built upon the primary mMEC model through the overexpression of MYC. The cultures were transduced with a MYC encoding retrovirus and relative expression was determined by immunoblotting (Fig. 3A). Compared with the parental non-transformed p53-deficient or RB/p53-deficient mMECs, overexpression of MYC further enhanced cell proliferation as demonstrated by levels of proteins involved in cell cycle progression and DNA replication (Cyclin A, PCNA) (Fig. 3A). Similarly, there levels of BrdU incorporation were elevated compared to the primary mMEC cultures (Fig. 3B, compared to Fig. 1B). In this setting, loss of RB did not result in deregulated proliferation above that observed with MYC-overexpression (Fig. 3A and B). Alterations in cell behavior were more prominent in 3Dcultures, in which both MYC overexpression p53- and RB/p53- mMECs displayed dense, abnormal acinar structures with irregular edges and lacking a hollow lumen (Fig. 3C, left panel). Interestingly, loss of RB appeared to enhance the disorganization of the acini, promoting a “stellate” morphology with spindle-like branching structures within the matrigel. Additional analyses of acinar morphology via E-cadherin immunoflourescence revealed an overall decrease in E-cadherin expression in both RB-proficient and RB-deficient MYC-overexpressing acini (Fig. 3C, right panels). However, unlike the RB-proficient acini that demonstrated a predominantly “chain-like” mode of invasion through the matrigel, the RB-deficient cultures displayed fibroblast-like, mesenchymal invasion of single-cells associated with compete loss of E-cadherin in the majority of acini. These data suggest that loss of RB in the context of MYC-transformed mMECs promotes a more invasive cellular phenotype.
Figure 3.
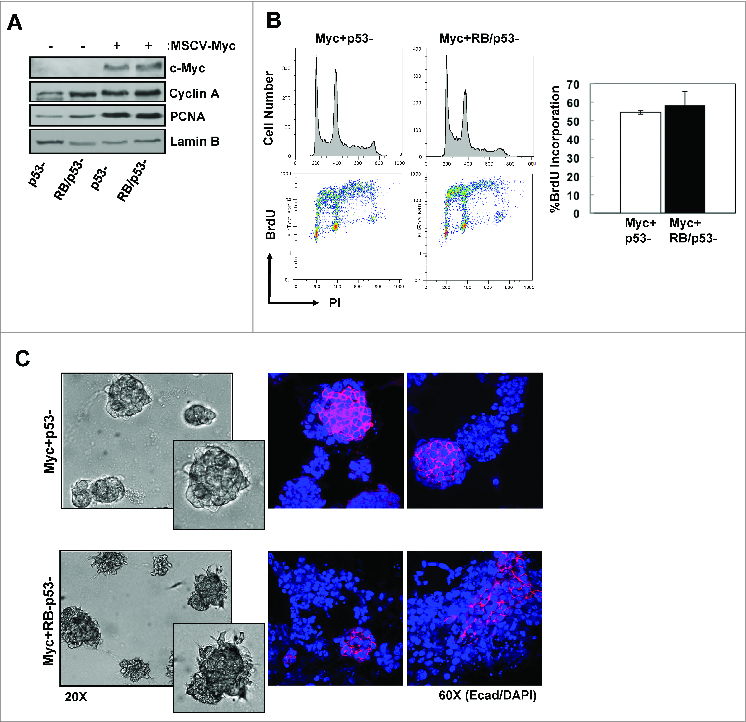
Combined loss of RB/p53 enhances the invasive phenotype of MYC-overexpressing mMECs. (A) Total protein lysates were immunoblotted for the indicated proteins. Lamin B serves as loading control. (B) Representative flow cytometry traces displaying cell cycle distribution (top) and BrdU incorporation (bottom) are shown. Average percent BrdU incorporation was quantified. (C) Representative phase contrast images of acini grown in matrigel (left) and E-cadherin staining of acini (right).
MYC-overexpressing mMECs display a gene expression program that correlates with human disease
To examine the transcriptional impact of combined RB/p53 loss in the context of MYC-induced transformation, gene expression profiling was performed on MYC overexpressing p53- and RB/p53- mMECs. Initial analyses demonstrated a surprisingly similar pattern of gene deregulation in both RB-proficient and RB-deficient cells in comparison to wild-type mMECs (Fig. 4A). The overall deregulated gene profiles consisted of the upregulation of genes involved in cellular processes such as cell cycle, DNA replication and repair, and RNA processing, as well as the downregulation of genes involved in processes including cell differentiation and development, and cell/biological adhesion. This was the case regardless of RB-status. Gene set enrichment analysis (GSEA) was employed to determine the relationship of differential gene expression in the MYC driven models vs. established gene sets. Both upregulated and downregulated gene expression patterns demonstrated significant enrichment when compared to the recently published human MYC-overexpression signature (Fig. 4B). Thus, the gene expression profiles generated as a result of MYC-overexpression in the mMECs significantly correlated with the observed gene expression profiles associated with MYC-overexpression in human cells and tissues. The expression of the genes differentially expressed in the MYC-driven MMEC model was subsequently evaluated in human breast cancers in luminal, basal, Her2, or normal-like subtypes. In this context, the gene expression alterations generated in the MYC-overexpressing mMECs were most elevated in basal-like breast cancer (Fig. 4C). These data recapitulate the finding that MYC-driven gene expression is a predominant feature of basal-like triple negative breast cancer.
Figure 4.
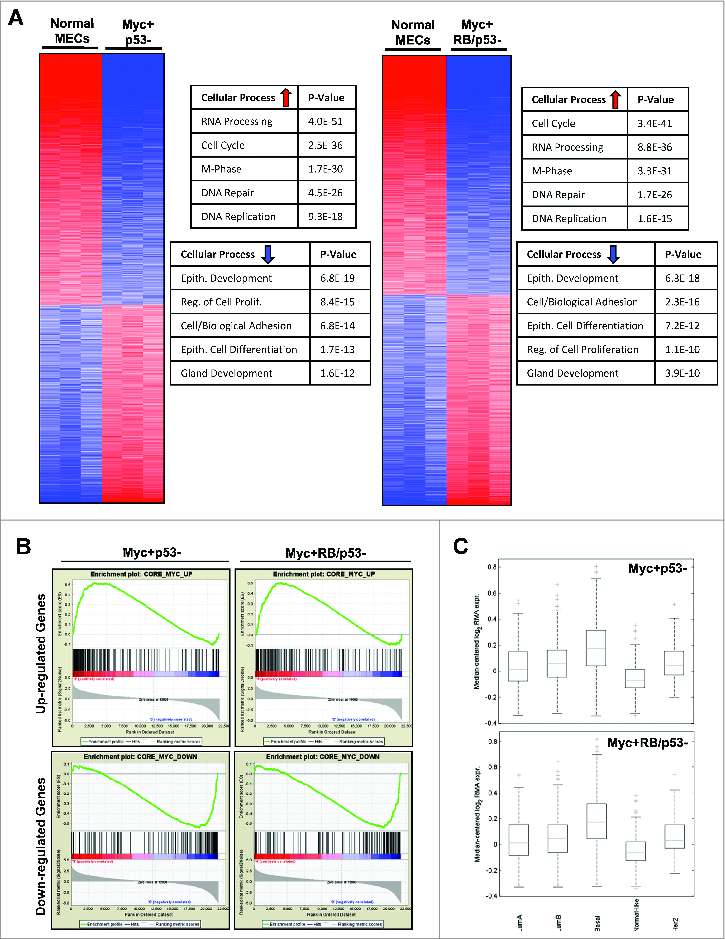
MYC-overexpressing mMECs exhibit significant gene alterations that correlates with basal-like breast cancer. (A) Changes in gene expression of RB-proficient (left) and RB-deficient (right) MYC-overexpressing mMECs compared to wild-type mMECs are displayed as heat maps. Top rated gene ontology results for upregulated and downregulated genes are highlighted in the accompanying tables. (B) Enrichment analyses of upregulated (top) and downregulated (bottom) genes in MYC+RB/p53- (left) and MYC+RB-p53- (right) mMECs compared to the human MYC-overexpression gene signature are displayed. (C) Gene expression profiles of MYC+RB+p53- (top) and MYC+RB/p53- (bottom) mMECs correlated with human breast cancer gene expression signatures.
Loss of RB promotes deregulation of genes associated with cell adhesion and motility
To analyze the potential impact of RB-status on the invasive phenotype observed in RB-deficient, MYC-overexpressing mMECs, we directly compared the gene expression profiles of the MYC overexpressing p53- and RB/p53- mMECs. Despite the similarities observed between the 2 cell lines when compared to wild-type mMECs, there are multiple genes that are distinctly affected by RB-status. Interestingly, these genes are predominantly associated with cellular processes including cell/biological adhesion and cell motility. Specifically, loss of RB resulted in a significant downregulation of genes known to be involved in cell adhesion (e.g., SVEP1, ADAM23, THBS1/2) and axon guidance (e.g. SEMA5A, SLIT2, EPHB2) that have been associated with tumor progression in various cancer types, including breast cancer (Fig. 5A, upper table). Additionally, RB loss promoted the upregulation of genes also involved in cell/biological adhesion (e.g., CD97, F11R, ITGB7, ITGA3, TGFB2), cell migration (e.g. TGFB1/2, TGFBR1, ITGA3, FGF10, CD34), and epithelial cell development/differentiation (e.g., KRT6B, KRT14, FGF2, ID1, SIX1) (Fig. 5A). Combined with our initial observations that RB loss enhances the invasive phenotype of MYC-overexpressing mMECs in 3D culture, the deregulated gene expression profile supported a role for RB in promoting enhanced motility and invasion. RT-PCR analysis was used to confirm select up- and down-regulated genes associated with invasive processes (Fig. 5B). To directly test the impact of RB loss on invasive properties Boyden Chamber assays were performed. Loss of RB resulted in a significant increase in both cellular migration through the membrane (not shown) and cellular invasion through a matrix-coated membrane (Fig. 5C). Taken together, these in vitro results indicate that loss of RB promotes the deregulation of genes involved in cellular adhesion and motility, and ultimately enhances the migratory and invasive capabilities of MYC-transformed mammary epithelial cells. A particularly relevant determinant of invasive potential is through the TGFß signaling. We confirmed that RB deletion was associated with increased expression of TGFß-R1 protein, and invasion of RB-deleted cells was inhibited through the use of the TGFß-receptor inhibitor SB-431542 (Fig. 5D and 5E). Together these data support a pathway wherein overexpression of MYC and the concurrent loss of RB facilitates the accumulation of TGFß signaling to drive the invasive potential of cancer cells.
Figure 5.
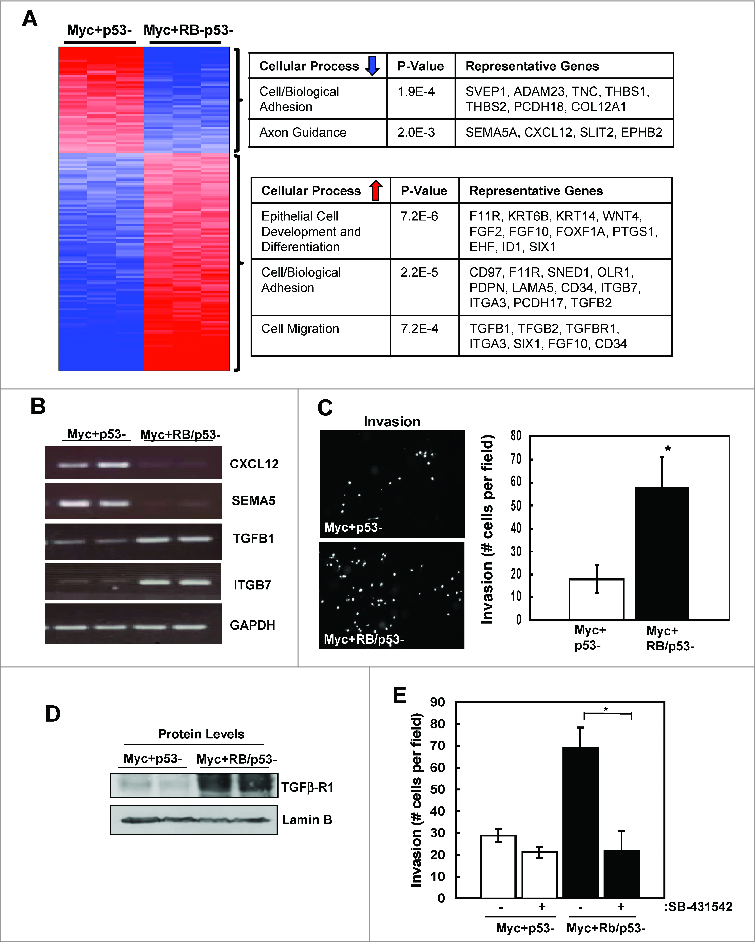
Loss of RB promotes deregulation of genes associated with cell adhesion and motility. (A) Changes in gene expression of RB-proficient versus RB-deficient, MYC-overexpressing mMECs are displayed as a heat map. Top ranked gene ontology results for upregulated and downregulated genes are highlighted in the accompanying tables. (B) Selected gene expression levels were evaluated by RT-PCR. (C) Cell invasion of RB-proficient and RB-deficient, MYC-overexpressing mMECs. Average number of cells per field was quantified (*p < 0 .05) (D) The indicated proteins were detected by immunoblotting. (E) Cell invasion was determined in the absence or presence of the TGFß inhibitor SB431542 (10 μM). Average number of cells per field was quantified (*p < 0 .05).
Loss of RB disrupts the epithelial phenotype of MYC-overexpressing mammary tumors
To determine whether the invasive phenotypes observed in vitro were relevant to tumor biology, we injected MYC-overexpressing p53- and RB/p53- mMECs into the mammary fat pads of 8-week old nude mice. Analysis of tumor growth over time did not demonstrate a significant difference in average tumor growth rate between p53- and RB/p53- MYC-driven tumors (data not shown). However, a dramatic difference was observed in the overall architecture of the tumors. RB-proficient tumors maintained a level of glandular architecture within the mammary tumors, while RB-deficient tumors display a complete loss of this architecture and differentiation (Fig. 6A). To assess the proliferation rates of the p53- and RB/p53- tumors, immunohistochemical staining for Ki67 (proliferation) and phospho-Ser10 Histone H3 (mitosis) was performed. As shown in Figure 6B and in accordance with results observed in vitro, levels of proliferation and mitoses were similar between the tumor types. In contrast, a significant difference was observed when analyzing E-cadherin levels within the tumor tissues. While there is a clear presence of E-cadherin associated with the glandular structures of the RB-proficient tumors, E-cadherin was undetectable in RB-deficient tumors (Fig. 6C). Thus, loss of RB does not impact proliferation over that observed as a result of MYC-overexpression but has an influence on the architecture and epithelial phenotype of the tumor tissue.
Figure 6.
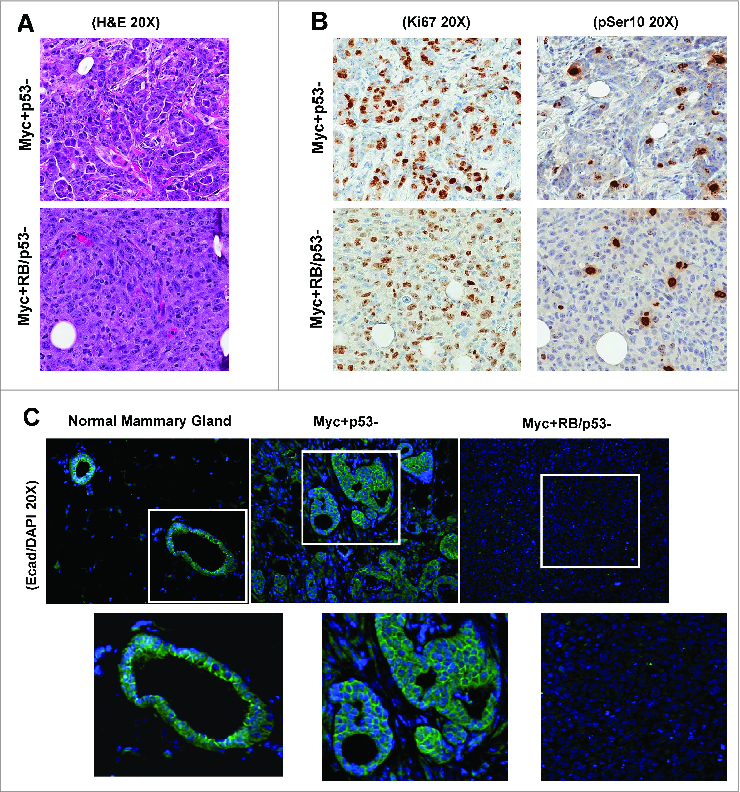
Loss of RB enhances the invasive phenotype of MYC-overexpressing mammary tumors. Representative images of H&E staining (A), Ki67 staining and phospho-Ser10 histone H3 (B), and E-cadherin staining (C) in RB-proficient and RB-deficient, MYC-overexpressing xenograft tumors are shown. Normal mammary gland stained with E-cadherin is included for comparison.
RB-deficiency has a significant impact on therapeutic sensitivity
The association of RB-status with invasive properties of MYC-transformed mMEC led us to determine how such genetic alterations alter the response to therapeutic interventions. For an unbiased assessment of the effect of RB-status on therapeutic sensitivity a panel of 304 drugs were screened. As shown in Figure 7A, the majority of drugs exhibited similar activity against both models irrespective of RB-status. Chemotherapeutic agents had generally similar efficacy against RB-proficient and deficient models (Fig. 7B). It has recently been reported that MYC-driven tumors are specifically sensitive to CDK9 inhibition. Consistent with that finding we found that the MMEC over expressing MYC were particularly sensitive to dinaciclib and flavopiridol, and this response was not modified by RB-status. In contrast, many targeted agents that impact on MEK and PI3K/mTOR signaling pathways had less efficacy in RB-deficient cells (Fig. 7C). These findings suggest that outside of conventional chemotherapy, MYC-driven RB-deficient tumors may represent a particular challenge for treatment.
Figure 7.
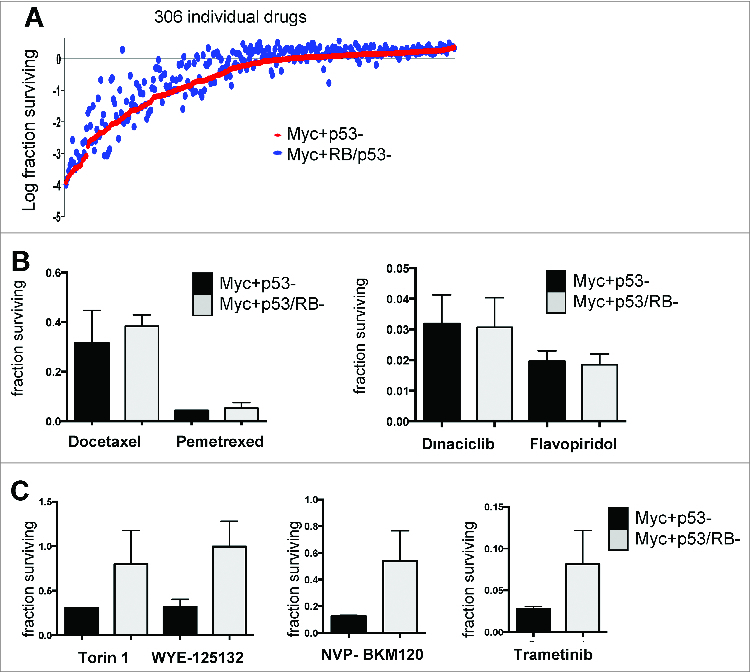
Loss of RB results in resistance to specific targeted therapies. (A) A library of 304 compounds was screened against the indicated cell lines, with cell viability measured by cell-titer-glow. (B and C) Data showing the relative viability of the indicate cell populations following challenge with specific therapeutic agents.
Combined MYC and RB loss is associated with poor prognosis: To determine the relationship of these findings with the pathology of human breast cancer the expression of MYC and RB were evaluated by immunohistochemistry in a cohort of TNBC cases. MYC exhibited diverse nuclear staining across TNBC cases from exceedingly low nuclear staining, to robust staining in the majority of cells (Fig. 8A). RB nuclear staining was observed at relatively homogeneous levels in ∼60% of tumor cases, whereas ∼40% of cases exhibited loss of the staining specific to the nuclear compartment (Fig. 8A). High MYC expression was not associated with survival, while trending to poor outcome (Fig. 8B). RB loss consistent with other studies is associated with improved outcome in this cohort (in preparation). However, the subset of cases with combined RB loss and high expression of MYC were associated with poor prognosis when compared across all cases in the cohort (Fig. 8C). Consistent with these combined findings, MYC had a particularly significant impact on the RB-negative tumors in this cohort (Fig. 8D). Together these findings indicate that composite MYC-overexpression and RB loss are associated with poor outcome in TNBC.
Figure 8.
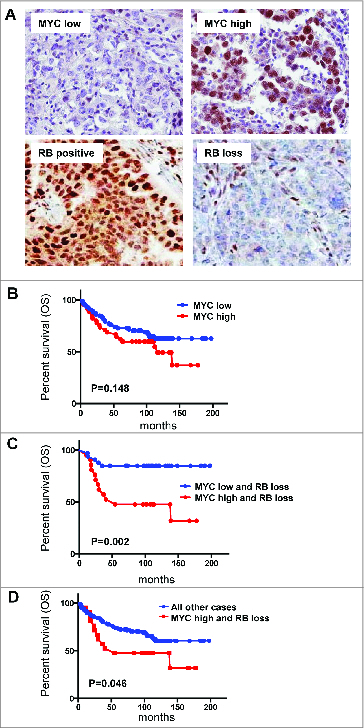
MYC overexpression in conjunction with RB loss is associated with poor prognosis. (A) representative images of MYC and RB immunohistochemistry. (B–D) Kaplan-Meier analysis for the association of MYC and RB status with overall survival (OS).
Discussion
TNBC is particularly aggressive and known to be associated with poor clinical outcome.31,32 Here we modeled loss of 2 tumor suppressors that are believed to “drive” the biology of TNBC. Mutation of p53 occurs in >80% of TNBC, of which approximately 40% harbor loss of RB.1 Given the high-frequency of p53 mutations in breast cancer, it is believed that this represents an obligatory event in disease. Similarly, RB loss is known to occur during the in situ carcinoma stage of breast cancer and is strongly associated with progression to invasive breast cancer.33,34 Therefore, these events and their coordination are particularly important for TNBC. RB loss has been shown in many model systems to promote deregulated cell cycle progression and cell growth.35,36 This was also observed in the context of primary mMEC, wherein loss of RB with or without the combined effects of p53-deficiency resulted in increased cell proliferation and acini size. However, despite loss of RB and p53 functions, the critical adhesion and structural components of the epithelial cells and acini remained intact. Thus, in spite the important roles of these 2 tumor suppressors additional events are clearly required to drive the transformation in this model. While TNBC is dominated by tumor suppressor loss, deregulation of MYC has emerged as a key oncogenic event. In analysis of TCGA data, ∼30% of cases harbor MYC amplification, and MYC overexpression is often observed in triple negative breast cancer. Furthermore, the MYC gene expression signature is enriched in TNBC.11,13,37 In the mMEC models, MYC-overexpression potently yielded oncogenic transformation of both p53- and RB/p53- cells. Correspondingly, such models harbored highly deregulated MYC transcriptional signature indicative of basal breast cancer.
This model provided the specific opportunity to define features specific to RB-positive vs. RB-negative models of disease. Gene expression profiling in the absence of MYC demonstrated that RB loss had an expected affect on proliferation-associated genes and harbored additive features with p53 loss. Additionally, RB loss also contributed to deregulation of genes involved in epithelial development and immune function, which is consistent with an emerging literature.27,28,38 It should be noted that we did not observe evidence of a “full-fledged” EMT as would be evidenced by enhanced expression of vimentin in the tumor cells. These data agree with other studies defining the loss of epithelial features as a consequence of RB deletion26; however, as described above, in the absence of an oncogenic driver such changes in gene expression translated to relatively modest effects on cellular behavior. In the context of MYC overproduction, RB loss was not associated with additional deregulation of cell cycle control. This was perhaps not surprising since MYC is known to influence the expression of a vast array of genes that encompasses those genes regulated by the RB pathway. Interestingly, RB loss was observed to specifically impact a subset of genes predominantly involved in cell adhesion and motility. This finding was accompanied by functional studies indicating a more invasive phenotype. Importantly, xenograft tumors demonstrated a highly de-differentiated phenotype and loss of epithelial characteristics. This finding is consistent with emerging literature that RB loss is associated with EMT-like transitions characterized by loss of epithelial character of the tumors.22,27 Analyses of the mechanisms associated with these invasive properties revealed RB-dependent deregulation of TGFß signaling pathways. Overexpression of TGFß related genes was observed at the RNA level, and confirmed at the protein level for TGFßR1. Pharmacological inhibition of TGFß signaling confirmed a significant effect on the invasive potential of RB-negative models. Taken together, these data suggest that loss of RB in the context of MYC-transformation promotes deregulation of the TGFß pathway to enhance cell invasion and disease progression. Consistent with the observation that RB loss yields a particularly aggressive phenotype in concert with MYC overexpression, triple negative breast cancers that exhibited compound RB loss and MYC overexpression had a particularly poor prognosis.
One of the key challenges of treatment of TNBC is the paucity of targeted therapies. In part, this is because the key genetic events in TNBC and basal-like breast cancer such as MYC, p53, and RB are not currently actionable. Here we explored the possibility that the genetic difference between and p53 and p53/RB-deficient tumors could yield tumor specific vulnerabilities. RB loss has been shown to yield sensitivity to chemotherapy in a number of preclinical models, including recent drug screening studies.39,40 Surprisingly, in a screen of 304 targeted cancer drugs, there were very few agents that harbored reproducible enhanced sensitivity against RB-deficient cells, including chemotherapy. In fact, RB loss generally elicited bypass of the targeted agents employed, with general resistance toward PI3K, mTOR and MEK inhibitors. In clinical cases of TNBC, RB loss has been paradoxically associated with improved clinical outcome, likely due to an association with improved response to chemotherapy.41-43 We have also observed this finding in the TNBC cohort analyzed here. However, MYC overexpression in concert with RB loss served to define a subset of patients with particularly poor prognosis. This finding suggests that during the etiology of MYC/RB deficient cancers, the intrinsic sensitivity to chemotherapy imparted by RB loss is mitigated. Therefore, such tumors would be both particularly aggressive and challenging to treat. Together, these data underscore the challenge of treating TNBC, wherein the tumor genetics could have a particularly pronounced impact on treatment outcomes.
Materials and Methods
Mouse mammary epithelial cell (mMEC) isolation and sub-culturing
Primary mouse mammary epithelial cells (mMECs) were isolated from 8-week old female mice harboring floxed Rb (RbloxP/loxP) and/or p53 (p53loxP/loxP) genes.44 mMECs were sub-cultured in DMEM/F12 supplemented with 5% horse serum, 20 ng/mL EGF, 10 μg/ml insulin, 1 ng/ml cholera toxin, 100 μg/ml hydrocortisone, 100 U/ml penicillin/streptomycin and 2 mM L-glutamine at 37°C in 5% CO2.
RB/p53 deletion and MYC overexpression
Three days post-isolation, mMECs were infected with adenoviral constructs expressing green fluorescent protein (GFP) or GFP and Cre recombinase (GFP-Cre), with an infection efficiency of 90–95% as determined by GFP immunofluorescence. Recombination at the Rb and/or p53 loci was confirmed by genomic DNA isolation and polymerase chain reaction (PCR) as previously described.44 MYC overexpression was achieved via retroviral transduction using an MSCVpuro-MYC expression construct generously provided by Dr. Scott Lowe.
Immunoblotting/RT-PCR
Total cell lysates were resolved using SDS-PAGE and transferred to Immobilon-P membranes (Millipore, Bedford, MA). Proteins were detected using with the following primary antibodies: Santa Cruz Biotechnology – Cyclin A (C-19); Lamin B (M-20); MCM7 (141.2); PCNA (PC10); MYC (9E10), TGFßR1 (R-20). RNA was harvested from cells using TRIzol (Invitrogen, Carlsbad, CA) according to manufacturer's instructions. Superscript reverse transcriptase (Invitrogen) was used to generate cDNA with random hexamer primers. qPCR was conducted using Power SYBR Green (Applied Biosystems). Primer sequences are available upon request to ESK.
BrdU incorporation and bivariate flow cytometry
Cultured cells were labeled with bromodeoxyuridine (BrdU) (Amersham Pharmicia Biotech) for one hour prior to harvest. Cells were then washed with PBS and fixed with cold 70% ethanol. Dual analysis of BrdU incorporation and total DNA content was carried out using bivariate flow cytometry as previously described45. Data analysis was performed using FlowJo 8.8 software.
Three-dimensional (3D) culturing of mMECs
mMECs were trypsinized and resuspended in Assay Media (DMEM/F12 supplemented with 2% horse serum, 10 μg/ml insulin 1 ng/ml cholera toxin, 100 μg/ml hydrocortisone, 100 U/ml penicillin/streptomycin and 2 mM L-glutamine) at a concentration of 25,000 cells/mL. The cell suspension was mixed 1:1 with Assay Media containing 4% matrigel and 10 ng/mL EGF. Cells were then seeded at a final concentration of 5,000 cells/chamber in an 8-chambered RS glass slide (Nalgene Nunc. Naperville, IL) containing 40 μL of matrigel (BD Bioscience) that was solidified 30 min prior to seeding. Assay Media was replaced every 3 d during culturing. Acinar size was assessed at day 8 of culturing by phase contrast imaging with a 20X objective. Diameters were measured at the middle optical section of each acinus with the support of Image J software. At least 50 individual acinar structures were scored for each cell population.33 Cells were stained for E-Cadherin and Ki67 as previously described.33
Migration and invasion assays
Cells were seeded at a concentration of 5 × 10⁴ cells/mL in serum-free medium into Boyden Chambers (Franklin Lakes, NJ; BioCoat 354578). The Boyden Chambers were then placed into wells containing complete growth media as a chemo-attractant, and cells were incubated for 48 hours (migration assays) or 72 hours (invasion assays). Cells on the outer/lower surface of the membrane were stained with 2-(4-amidinophenyl)-1H-indole-6-carboxamidine (DAPI) and visualized on a fluorescent microscope for quantification. Cells were scored in at least 5 fields per well in triplicate experiments.26
Microarray Analyses
Microarray experiments were performed using the Affymetrix GeneChip Mouse Gene 1.0 ST arrays (Affymetrix, Santa Clara, CA). All microarray data are MIAME compliant and have been deposited in Gene Expression Omnibus (GEO; accession number GSE40545).
Differential expression analysis
Differential gene expression analysis expression analysis between sample conditions samples was using a 2-sample t-test with unequal variance. To account for multiple testing, p-values were adjusted based on the estimated false discovery rate (FDR). For increased statistical power, genes with variance below the 50th percentile or expressed below the 25th percentile in over 90% of the samples being compared were assigned an adjusted p-value of 1 and filtered out prior to FDR estimation. Differentially expressed genes were identified as those with an adjusted p-value ≤ 0.05 and minimum 2 absolute fold change.
Drug Screening: A library of 304 drugs agents from Selleck Chemical were utilized for the drug screening (see supplemental information). Compounds were diluted in DMSO to 0.5 M concentration in 96-well plates. Cell were trypsinized and 5,000 cells were plated per well, and left to adhere overnight. Drugs were administered for a final concentration of 2.5 μM. Following 72 hours of treatment, cell viability was assessed using CellTiter-Glo® Luminescent Cell Viability Assay. The relative fluorescent units were recorded and analyzed by a BIOTEK plate reader and Gen5 software. Data analysis was performed using DRUG-DECODE macro (developed by David Haan, UT Southwestern).
Mammary fatpad injections and analysis of tumor volume
Animal experiments were carried out in accordance with the NIH Guide for Care and Use of Laboratory Animals and with approval from the Institutional Animal Care and Use Committee. Cells were trypsinized and resuspended in media at a concentration of 10 × 106 cells/ml. For mammary fatpad injections, 8-week old female athymic nude mice were anesthetized via isoflourane, the inguinal gland was exposed via Y-incision of the abdomen, and 1 × 10⁶ cells were injected into the fatpad using a Sub-Q 26G5/8 needle. Mice were euthanized once tumor volume reached 200–300 mm3. Tumors were extracted and fixed in 10% neutral buffered formalin (NBF), paraffin-embedded, and cut into 5 μm sections for histology/immunohistochemistry.
Immunohistochemistry/immunofluorescence in mouse tumor tissue sections
Tissue sections were deparaffinized in xylene followed by rehydration through a gradient of ethanol washes. Sections were stained with Hematoxylin and Eosin (H&E) using standard procedures. In addition, expression of Ki67, and phospho-histone H3 Serine10 (pSer10) were detected and counterstained with hematoxylin as previously described.46 E-cadherin was detected by immunofluorescence microscopy and counterstained with DAPI as previously described.26 Primary antibodies used for immunohistochemistry and immunofluorescence: Ki67 (Dako); pSer10, rabbit polyclonal (Upstate Biotechnology); and E-cadherin (Dako).
Staining of TNBC patient cohort
The cohort employed for staining has been previous described.47 The staining approach for RB has been previously published.33 The tissue microarray was stained with MYC antibody (Biocare Medical, Clone Y69 1:50). An established cut-point (40%) was used for dichotomizing MYC high vs. low expression levels.48 Images were captured using an Aperio scanner, and statistical survival analysis was performed using GraphPad-Prism.
Acknowledgments
The authors thank all of their colleagues for support in this work, in particular David Haan who produced the coding for analysis of drug screen data, and Christopher Moxom who assisted with the submission of the manuscript and performed all editorial work.
Disclosure of Potential Conflicts of Interest
No potential conflicts of interest were disclosed.
Funding
This project was supported by grants to ESK (CA129134 and CA137494) and AKW (CA163863).
References
- 1.Cancer Genome Atlas N. Comprehensive molecular portraits of human breast tumours. Nature 2012; 490(7418):61-70; PMID:; http://dx.doi.org/ 10.1038/nature11412 [DOI] [PMC free article] [PubMed] [Google Scholar]
- 2.Perou CM, Sorlie T, Eisen MB, van de Rijn M, Jeffrey SS, Rees CA, Pollack JR, Ross DT, Johnsen H, Akslen LA, et al. Molecular portraits of human breast tumours. Nature 2000; 406(6797):747-752; PMID:; http://dx.doi.org/ 10.1038/35021093 [DOI] [PubMed] [Google Scholar]
- 3.Baselga J. Treatment of HER2-overexpressing breast cancer. Ann Oncol 2010; 21Suppl 7:vii36-40; PMID: [DOI] [PubMed] [Google Scholar]
- 4.Prat A, Baselga J. The role of hormonal therapy in the management of hormonal-receptor-positive breast cancer with co-expression of HER2. Nat Clin Pract Oncol 2008; 5(9):531-542; PMID:; http://dx.doi.org/ 10.1038/ncponc1179 [DOI] [PubMed] [Google Scholar]
- 5.Musgrove EA, Sutherland RL. Biological determinants of endocrine resistance in breast cancer. Nat Rev Cancer 2009; 9(9):631-643; PMID:; http://dx.doi.org/ 10.1038/nrc2713 [DOI] [PubMed] [Google Scholar]
- 6.Carey L, Winer E, Viale G, Cameron D, Gianni L. Triple-negative breast cancer: disease entity or title of convenience? Nat Rev Clin Oncol 7(12):683-692; PMID:; http://dx.doi.org/ 10.1038/nrclinonc.2010.154 [DOI] [PubMed] [Google Scholar]
- 7.Reis-Filho JS, Tutt AN. Triple negative tumours: a critical review. Histopathology 2008; 52(1):108-118; PMID:; http://dx.doi.org/ 10.1111/j.1365-2559.2007.02889.x [DOI] [PubMed] [Google Scholar]
- 8.Lehmann BD, Bauer JA, Chen X, Sanders ME, Chakravarthy AB, Shyr Y, Pietenpol JA. Identification of human triple-negative breast cancer subtypes and preclinical models for selection of targeted therapies. J Clin Invest 2011; 121(7):2750-2767; PMID: [DOI] [PMC free article] [PubMed] [Google Scholar]
- 9.Herschkowitz JI, He X, Fan C, Perou CM. The functional loss of the retinoblastoma tumour suppressor is a common event in basal-like and luminal B breast carcinomas. Breast Cancer Res 2008; 10(5):R75; PMID:; http://dx.doi.org/ 10.1186/bcr2142 [DOI] [PMC free article] [PubMed] [Google Scholar]
- 10.Soucek L, Evan GI. The ups and downs of Myc biology. Curr Opin Genet Dev 2010; 20(1):91-95; PMID: [DOI] [PMC free article] [PubMed] [Google Scholar]
- 11.Xu J, Chen Y, Olopade OI. MYC and Breast Cancer. Genes Cancer 2010; 1(6):629-640; PMID: [DOI] [PMC free article] [PubMed] [Google Scholar]
- 12.Conacci-Sorrell M, McFerrin L, Eisenman RN. An Overview of MYC and Its Interactome. Cold Spring Harbor perspectives in Med 2014; 4(1); PMID:; http://dx.doi.org/ 10.1101/cshperspect.a014357 [DOI] [PMC free article] [PubMed] [Google Scholar]
- 13.Alles MC, Gardiner-Garden M, Nott DJ, Wang Y, Foekens JA, Sutherland RL, Musgrove EA, Ormandy CJ. Meta-analysis and gene set enrichment relative to er status reveal elevated activity of MYC and E2F in the "basal" breast cancer subgroup. PLoS One 2009; 4(3):e4710; PMID:; http://dx.doi.org/ 10.1371/journal.pone.0004710 [DOI] [PMC free article] [PubMed] [Google Scholar]
- 14.Lin CY, Loven J, Rahl PB, Paranal RM, Burge CB, Bradner JE, Lee TI, Young RA. Transcriptional amplification in tumor cells with elevated c-Myc. Cell 2012; 151(1):56-67; PMID:; http://dx.doi.org/ 10.1016/j.cell.2012.08.026 [DOI] [PMC free article] [PubMed] [Google Scholar]
- 15.Cowling VH, Cole MD. E-cadherin repression contributes to c-Myc-induced epithelial cell transformation. Oncogene 2007; 26(24):3582-3586; PMID:; http://dx.doi.org/ 10.1038/sj.onc.1210132 [DOI] [PubMed] [Google Scholar]
- 16.Evan GI, Wyllie AH, Gilbert CS, Littlewood TD, Land H, Brooks M, Waters CM, Penn LZ, Hancock DC. Induction of apoptosis in fibroblasts by c-myc protein. Cell 1992; 69(1):119-128; PMID:; http://dx.doi.org/ 10.1016/0092-8674(92)90123-T [DOI] [PubMed] [Google Scholar]
- 17.Leone G, Sears R, Huang E, Rempel R, Nuckolls F, Park CH, Giangrande P, Wu L, Saavedra HI, Field SJ, et al. Myc requires distinct E2F activities to induce S phase and apoptosis. Mol Cell 2001; 8(1):105-113; PMID:; http://dx.doi.org/ 10.1016/S1097-2765(01)00275-1 [DOI] [PubMed] [Google Scholar]
- 18.Fujiwara K, Yuwanita I, Hollern DP, Andrechek ER. Prediction and genetic demonstration of a role for activator E2Fs in Myc-induced tumors. Cancer Res 2011; 71(5):1924-1932; PMID:; http://dx.doi.org/ 10.1158/0008-5472.CAN-10-2386 [DOI] [PubMed] [Google Scholar]
- 19.Xu XL, Fang Y, Lee TC, Forrest D, Gregory-Evans C, Almeida D, Liu A, Jhanwar SC, Abramson DH, Cobrinik D. Retinoblastoma has properties of a cone precursor tumor and depends upon cone-specific MDM2 signaling. Cell 2009; 137(6):1018-1031; PMID:; http://dx.doi.org/ 10.1016/j.cell.2009.03.051 [DOI] [PMC free article] [PubMed] [Google Scholar]
- 20.Dean JL, McClendon AK, Stengel KR, Knudsen ES. Modeling the effect of the RB tumor suppressor on disease progression: dependence on oncogene network and cellular context. Oncogene 29(1):68-80; PMID:; http://dx.doi.org/ 10.1038/onc.2009.313 [DOI] [PubMed] [Google Scholar]
- 21.Saddic LA, Wirt S, Vogel H, Felsher DW, Sage J. Functional interactions between retinoblastoma and c-MYC in a mouse model of hepatocellular carcinoma. PLoS One 2011; 6(5):e19758; PMID:; http://dx.doi.org/ 10.1371/journal.pone.0019758 [DOI] [PMC free article] [PubMed] [Google Scholar]
- 22.Jiang Z, Jones R, Liu JC, Deng T, Robinson T, Chung PE, Wang S, Herschkowitz JI, Egan SE, Perou CM, Zacksenhaus E. RB1 and p53 at the crossroad of EMT and triple-negative breast cancer. Cell Cycle 2011; 10(10):1563-1570; PMID:; http://dx.doi.org/ 10.4161/cc.10.10.15703 [DOI] [PubMed] [Google Scholar]
- 23.Khew-Goodall Y, Goodall GJ. Myc-modulated miR-9 makes more metastases. Nat Cell Biol. 2010; 12(3):209-211; PMID: [DOI] [PubMed] [Google Scholar]
- 24.Liu M, Casimiro MC, Wang C, Shirley LA, Jiao X, Katiyar S, Ju X, Li Z, Yu Z, Zhou J, et al. p21CIP1 attenuates Ras- and c-Myc-dependent breast tumor epithelial mesenchymal transition and cancer stem cell-like gene expression in vivo. Proc Natl Acad Sci U S A 2009; 106(45):19035-19039; PMID:; http://dx.doi.org/ 10.1073/pnas.0910009106 [DOI] [PMC free article] [PubMed] [Google Scholar]
- 25.Jiang Z, Deng T, Jones R, Li H, Herschkowitz JI, Liu JC, Weigman VJ, Tsao MS, Lane TF, Perou CM, Zacksenhaus E. Rb deletion in mouse mammary progenitors induces luminal-B or basal-like/EMT tumor subtypes depending on p53 status. J Clin Invest 2010; 120(9):3296-3309; PMID:; http://dx.doi.org/ 10.1172/JCI41490 [DOI] [PMC free article] [PubMed] [Google Scholar]
- 26.Witkiewicz AK, Cox DW, Rivadeneira D, Ertel AE, Fortina P, Schwartz GF, Knudsen ES. The retinoblastoma tumor suppressor pathway modulates the invasiveness of ErbB2-positive breast cancer. Oncogene 2014; 33(30):3980-3991; PMID: [DOI] [PMC free article] [PubMed] [Google Scholar]
- 27.Arima Y, Inoue Y, Shibata T, Hayashi H, Nagano O, Saya H, Taya Y. Rb depletion results in deregulation of E-cadherin and induction of cellular phenotypic changes that are characteristic of the epithelial-to-mesenchymal transition. Cancer Res 2008; 68(13):5104-5112; PMID:; http://dx.doi.org/ 10.1158/0008-5472.CAN-07-5680 [DOI] [PubMed] [Google Scholar]
- 28.Arima Y, Hayashi H, Sasaki M, Hosonaga M, Goto TM, Chiyoda T, Kuninaka S, Shibata T, Ohata H, Nakagama H, Taya Y, Saya H. Induction of ZEB proteins by inactivation of RB protein is key determinant of mesenchymal phenotype of breast cancer. J Biol Chem 287(11):7896-7906; PMID:; http://dx.doi.org/ 10.1074/jbc.M111.313759 [DOI] [PMC free article] [PubMed] [Google Scholar]
- 29.Knudsen ES, Wang JY. Targeting the RB-pathway in cancer therapy. Clin Cancer Res 2010; 16(4):1094-1099; PMID:; http://dx.doi.org/ 10.1158/1078-0432.CCR-09-0787 [DOI] [PMC free article] [PubMed] [Google Scholar]
- 30.Knudsen ES, Knudsen KE. Tailoring to RB: tumour suppressor status and therapeutic response. Nat Rev Cancer 2008; PMID: [DOI] [PMC free article] [PubMed] [Google Scholar]
- 31.Dawson SJ, Provenzano E, Caldas C. Triple negative breast cancers: clinical and prognostic implications. Eur J Cancer 2009; 45 Suppl 1:27-40; PMID:; http://dx.doi.org/ 10.1016/S0959-8049(09)70013-9 [DOI] [PubMed] [Google Scholar]
- 32.Foulkes WD, Smith IE, Reis-Filho JS. Triple-negative breast cancer. N Engl J Med 2010; 363(20):1938-1948; PMID:; http://dx.doi.org/ 10.1056/NEJMra1001389 [DOI] [PubMed] [Google Scholar]
- 33.Knudsen ES, Pajak TF, Qeenan M, McClendon AK, Armon BD, Schwartz GF, Witkiewicz AK. Retinoblastoma and phosphate and tensin homolog tumor suppressors: impact on ductal carcinoma in situ progression. J Natl Cancer Inst 2012; 104(23):1825-1836; PMID:; http://dx.doi.org/ 10.1093/jnci/djs446 [DOI] [PMC free article] [PubMed] [Google Scholar]
- 34.Witkiewicz AK, Rivadeneira DB, Ertel A, Kline J, Hyslop T, Schwartz GF, Fortina P, Knudsen ES. Association of RB/p16-pathway perturbations with DCIS recurrence: dependence on tumor versus tissue microenvironment. Am J Pathol 2011; 179(3):1171-1178; PMID:; http://dx.doi.org/ 10.1016/j.ajpath.2011.05.043 [DOI] [PMC free article] [PubMed] [Google Scholar]
- 35.Burkhart DL, Sage J. Cellular mechanisms of tumour suppression by the retinoblastoma gene. Nat Rev Cancer 2008; 8(9):671-682; PMID:; http://dx.doi.org/ 10.1038/nrc2399 [DOI] [PMC free article] [PubMed] [Google Scholar]
- 36.Knudsen ES, Knudsen KE. Retinoblastoma tumor suppressor: where cancer meets the cell cycle. Exp Biol Med (Maywood) 2006; 231(7):1271-1281; PMID: [DOI] [PubMed] [Google Scholar]
- 37.Chandriani S, Frengen E, Cowling VH, Pendergrass SA, Perou CM, Whitfield ML, Cole MD. A core MYC gene expression signature is prominent in basal-like breast cancer but only partially overlaps the core serum response. PLoS One 2009; 4(8):e6693; PMID:; http://dx.doi.org/ 10.1371/journal.pone.0006693 [DOI] [PMC free article] [PubMed] [Google Scholar]
- 38.Markey MP, Bergseid J, Bosco EE, Stengel K, Xu H, Mayhew CN, Schwemberger SJ, Braden WA, Jiang Y, Babcock GF, et al. Loss of the retinoblastoma tumor suppressor: differential action on transcriptional programs related to cell cycle control and immune function. Oncogene 2007; 26(43):6307-6318; PMID:; http://dx.doi.org/ 10.1038/sj.onc.1210450 [DOI] [PubMed] [Google Scholar]
- 39.Robinson TJ, Liu JC, Vizeacoumar F, Sun T, Maclean N, Egan SE, Schimmer AD, Datti A, Zacksenhaus E. RB1 status in triple negative breast cancer cells dictates response to radiation treatment and selective therapeutic drugs. PLoS One 2013; 8(11):e78641; http://dx.doi.org/ 10.1371/journal.pone.0078641 [DOI] [PMC free article] [PubMed] [Google Scholar]
- 40.Bosco EE, Wang Y, Xu H, Zilfou JT, Knudsen KE, Aronow BJ, Lowe SW, Knudsen ES. The retinoblastoma tumor suppressor modifies the therapeutic response of breast cancer. J Clin Invest 2007; 117(1):218-228; PMID:; http://dx.doi.org/ 10.1172/JCI28803 [DOI] [PMC free article] [PubMed] [Google Scholar]
- 41.Derenzini M, Donati G, Mazzini G, Montanaro L, Vici M, Ceccarelli C, Santini D, Taffurelli M, Trere D. Loss of retinoblastoma tumor suppressor protein makes human breast cancer cells more sensitive to antimetabolite exposure. Clin Cancer Res 2008; 14(7):2199-2209; PMID:; http://dx.doi.org/ 10.1158/1078-0432.CCR-07-2065 [DOI] [PubMed] [Google Scholar]
- 42.Ertel A, Dean JL, Rui H, Liu C, Witkiewicz AK, Knudsen KE, Knudsen ES. RB-pathway disruption in breast cancer: differential association with disease subtypes, disease-specific prognosis and therapeutic response. Cell Cycle 9(20):4153-4163; PMID:; http://dx.doi.org/ 10.4161/cc.9.20.13454 [DOI] [PMC free article] [PubMed] [Google Scholar]
- 43.Witkiewicz AK, Ertel A, McFalls JM, Valsecchi ME, Schwartz G, Knudsen ES. RB-pathway Disruption is Associated with Improved Response to Neoadjuvant Chemotherapy in Breast Cancer. Clin Cancer Res. [DOI] [PMC free article] [PubMed] [Google Scholar]
- 44.McClendon AK, Dean JL, Ertel A, Fu Z, Rivadeneira DB, Reed CA, Bourgo RJ, Witkiewicz A, Addya S, Mayhew CN, Grimes HL, Fortina P, Knudsen ES. RB and p53 cooperate to prevent liver tumorigenesis in response to tissue damage. Gastroenterology 2011; 141(4):1439-1450; PMID:; http://dx.doi.org/ 10.1053/j.gastro.2011.06.046 [DOI] [PMC free article] [PubMed] [Google Scholar]
- 45.Knudsen KE, Booth D, Naderi S, Sever-Chroneos Z, Fribourg AF, Hunton IC, Feramisco JR, Wang JY, Knudsen ES. RB-dependent S-phase response to DNA damage. Mol Cell Biol 2000; 20(20):7751-7763; PMID:; http://dx.doi.org/ 10.1128/MCB.20.20.7751-7763.2000 [DOI] [PMC free article] [PubMed] [Google Scholar]
- 46.Bourgo RJ, Thangavel C, Ertel A, Bergseid J, McClendon AK, Wilkens L, Witkiewicz AK, Wang JY, Knudsen ES. RB restricts DNA damage-initiated tumorigenesis through an LXCXE-dependent mechanism of transcriptional control. Mol Cell 2011; 43(4):663-672; PMID:; http://dx.doi.org/ 10.1016/j.molcel.2011.06.029 [DOI] [PMC free article] [PubMed] [Google Scholar]
- 47.Witkiewicz AK, Dasgupta A, Sotgia F, Mercier I, Pestell RG, Sabel M, Kleer CG, Brody JR, Lisanti MP. An absence of stromal caveolin-1 expression predicts early tumor recurrence and poor clinical outcome in human breast cancers. Am J Pathol 2009; 174(6):2023-2034; PMID:; http://dx.doi.org/ 10.2353/ajpath.2009.080873 [DOI] [PMC free article] [PubMed] [Google Scholar]
- 48.Johnson NA, Slack GW, Savage KJ, Connors JM, Ben-Neriah S, Rogic S, Scott DW, Tan KL, Steidl C, Sehn LH, et al. Concurrent expression of MYC and BCL2 in diffuse large B-cell lymphoma treated with rituximab plus cyclophosphamide, doxorubicin, vincristine, and prednisone. J Clin Oncol 2012; 30(28):3452-3459; PMID:; http://dx.doi.org/ 10.1200/JCO.2011.41.0985 [DOI] [PMC free article] [PubMed] [Google Scholar]


