Abstract
We performed a retrospective analysis of non-contrast computed tomography (CT) scans, immediately subsequent magnetic resonance imaging (MRI), and cerebral angiography data from 30 consecutive patients with acute ischemic stroke within 6 hours after symptom onset. Results showed that eleven patients developed subsequent hemorrhagic transformation at follow-up. A hyperintense middle cerebral artery sign on MRI was found in six hemorrhagic patients, all of who had acute thrombosis formation on magnetic resonance angiography and digital subtraction angiography. No patients in the non-hemorrhagic group had hyperintense middle cerebral artery sign on MRI. The sensitivity, specificity, and positive predictive values of the hyperintense middle cerebral artery sign on MRI T1-weighted image for subsequent hemorrhagic transformation were 54.5%, 100%, and 100% respectively. Hyperdense middle cerebral artery sign on non-contrast CT was observed in nine patients, five of who developed hemorrhagic transformation. These data suggest that hyperintense middle cerebral artery sign on MRI T1-weighted image is a highly specific and moderately sensitive indicator of subsequent hemorrhagic transformation in patients after acute ischemic stroke, and its specificity is superior to CT.
Keywords: stroke, hemorrhagic transformation, magnetic resonance imaging, angiography
INTRODUCTION
Intravenous tissue plasminogen activator (tPA) remains the only drug and route of administration approved in North America and Europe for acute ischemic stroke treatment[1]. Multicentre studies recently demonstrated that the efficacy of tPA on primary outcome may extend to 4.5 hours after symptoms onset[2]. However, a major concern with the general use of thrombolytic therapy is the risk of secondary intracranial hemorrhage[3]. Thus, it is necessary to develop reliable and accessible noninvasive imaging modalities for predicting hemorrhagic transformation (HT) in acute ischemic stroke.
Early parenchymal enhancement on post-gadolinium T1-weighted magnetic resonance imaging (post-Gd T1WI) has been demonstrated as a predictor for HT in acute ischemic stroke[4,5]. However, although the specificity of early parenchymal enhancement for the development of HT was reported as 100%, the sensitivity was only 29%[5]. Increased density of a cerebral artery on non-contrast computed tomography (CT) indicates the presence of intraluminal thrombus, and is one of the first early CT signs observed in ischemic stroke patients[6]. A hyperdense middle cerebral artery (MCA) sign on CT represents thromboembolism within the artery, which can be associated with large MCA territory infarction[7], severe neurological deficit, extensive brain damage, and poor clinical outcome[8]. More recently, multivariable analyses reported that the presence of a hyperdense artery sign on pretreatment CT was an independent predictor of HT[9]. However, the sensitivity of the hyperdense MCA sign for MCA occlusion is low, although its specificity approaches 100%[8]. By contrast, the hyperintense MCA (HMCA) sign (thickened, blurred MCA with intense signal), which is analogous to the hyperdense MCA sign on noncontrast-CT, can be routinely obtained on post-Gd T1W MRI in patients with acute ischemic stroke. Our previous study showed that the HMCA sign was significantly correlated with the subsequent HT[10]. However, a similar correlation of the HMCA sign with magnetic resonance angiography (MRA) and/or digital subtraction angiography (DSA) has not been reported.
The aims of the present study were to: (1) validate the HMCA sign on post-Gd T1WI using MRA and/or DSA as the gold standard[11,12]; (2) compare the incidence of HMCA sign on MRI and hyperdense MCA sign on CT in acute ischemic stroke; and (3) examine the correlation between HMCA sign on MRI and subsequent HT in acute ischemic stroke. We hypothesized that MRA would provide similar anatomical localization to formal cerebral angiography[10], and that the HMCA sign representing MCA occlusion in the main stem of the artery would predict the subsequent HT.
RESULTS
Quantitative analysis of experimental subjects
Thirty patients with cerebral infarction had an admission CT and MRI within 6 hours from symptom onset, without evidence of hemorrhage. All of the 30 patients were involved in the study.
Baseline data
Time between admission CT and MRI was 2.4 ± 1.4 hours. Lesions visible on diffusion-weighted images were located within the MCA territory in all patients. Contrast-enhanced (CE) MRA and DSA showed vessel occlusion as follows: eight in the internal carotid artery, nine in the M1 segment, and four in the M2 segment. Eleven patients showed HT after 1-week follow-ups (36.7%). The demographic, treatment, and imaging data in HT group are shown in Table 1.
Table 1.
Baseline data of hemorrhagic transformation patients

The appearance of HMCA on post-Gd T1W MRI in HT and non-HT groups
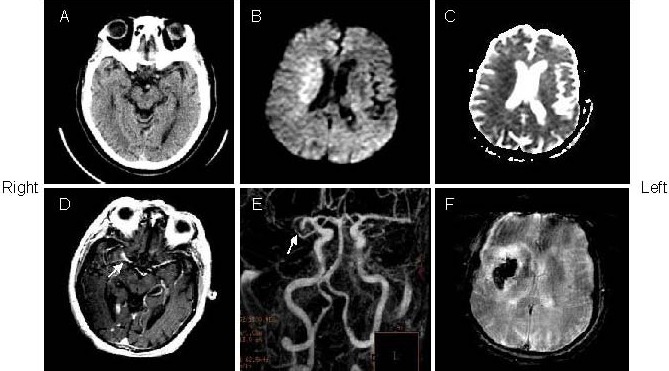
There was no difference in the age of the patients between HT and non-HT groups (68.5 ± 15.3 years vs. 67.2 ± 21.1 years; t = 0.186, P = 0.212). The HMCA sign on post-Gd T1W MRI was found in six patients (20%), all of who developed HT (Figure 1).
Figure 1.

A 73-year-old woman with left hemiparesis and aphasia was treated with intravenous tissue plasminogen activator within 3 hours after onset (patient 2).
(A) The admission computed tomography (CT) showed no evidence of abnormality. Initial diffusion weighted imaging (B) and apparent diffusion coefficient (C; 2.5 hours after admission CT) showed restricted diffusion in the right middle cerebral artery territory.
(D) Gd-enhanced T1-weighted image showed the hyperintense middle cerebral artery sign (arrow) in the right middle cerebral artery stem.
(E) Magnetic resonance angiography showed right middle cerebral artery stem occlusion (arrow).
(F) Follow-up of gradient echo interleaved Echo Planar Imaging on day 2 showed hemorrhage in the right middle cerebral artery territory.
There was no significant age difference between patients with and without HMCA sign in the HT group (68.2 ± 15.3 vs. 69.0 ± 17.1; t = -0.499, P = 0.63). The incidence of HMCA sign on post-Gd T1WI in the HT group was significant increased compared with the non-HT group (P < 0.01 by Fisher's exact test).
The sensitivity [number of true positive/(number of true positive + number of false negative)], specificity [number of true negative/(number of false positive + true negative)], and positive predictive values of the HMCA sign for subsequent HT were 54.5%, 100%, and 100% respectively. All of the patients with HMCA sign had MCA occlusion on CE MRA (four in the right and two in the left).
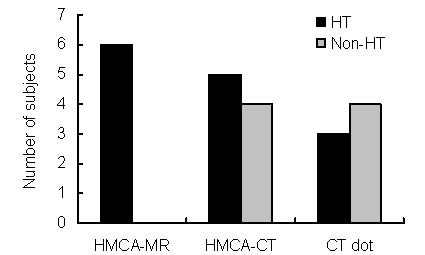
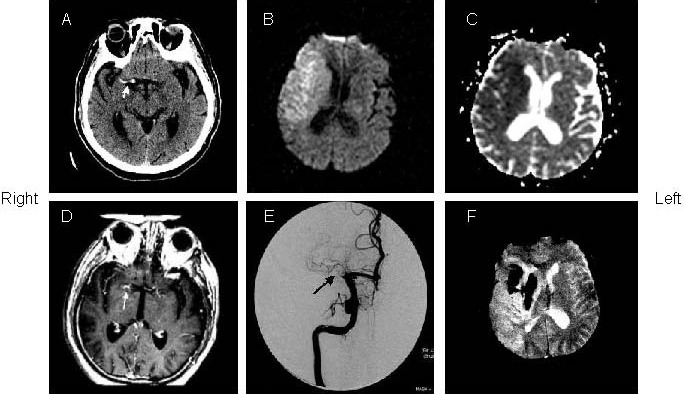
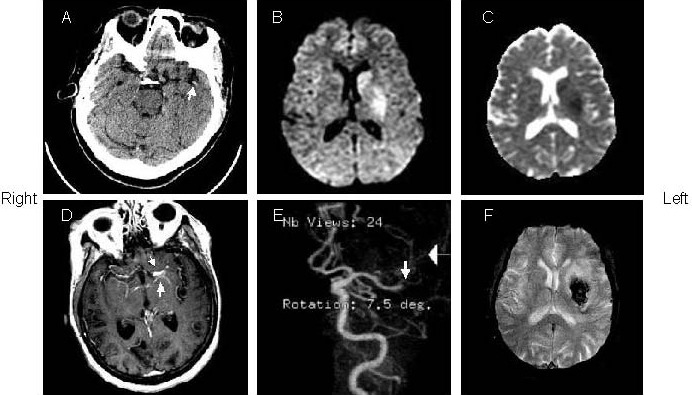
The incidence of the HMCA sign on MRI and hyperdense MCA sign and MCA dot sign on CT in HT and non-HT groups are shown in Figure 2. The hyperdense MCA sign on CT was found in nine patients (30%), five of who were in the HT group (Figure 3). MCA “dot” CT sign was observed in seven patients (23.3%), three of who were in the HT group (Figure 4).
Figure 2.

Incidence of HMCA-MR, HMCA-CT, CT dot sign in HT and non-HT groups. There were 11 patients in the HT group and 19 patients in the non-HT group. HMCA: Hyperintense middle cerebral artery; HT: hemorrhagic transformation.
Figure 3.

An 83-year-old man with left hemiparesis and aphasia was treated with intravenous tissue plasminogen activator within 2.5 hours after onset (patient 5).
(A) The admission computed tomography (CT) showed hyperdense middle cerebral artery sign (arrow) in the right side. Initial diffusion weighted imaging (B) and apparent diffusion coefficient (C; 3 hours after admission CT) showed restricted diffusion in the right middle cerebral artery territory.
(D) Post-Gd T1-weighted image showed hyperintense middle cerebral artery sign in the right middle cerebral artery stem (arrow).
(E) Digital subtraction angiography showed proximal segment occlusion of right middle cerebral artery (arrow).
(F) Follow-up of gradient echo interleaved Echo Planar Imaging on day 3 showed hemorrhage in the right middle cerebral artery territory.
Figure 4.

A 73-year old woman with right hemiparesis and aphasia (patient 4).
(A) The admission computed tomography (CT) (1.5 hours after onset) showed left “dot” sign in the right sylvian fissure. The initial diffusion weighted imaging (B) and apparent diffusion coefficient (C; 15 mintues after CT) showed restricted diffusion in the left middle cerebral artery territory.
(D) Post-Gd T1-weighted image showed hyperintense middle cerebral artery sign (arrows) in the left middle cerebral artery stem.
(E) Magnetic resonance angiography showed occlusion in the right middle cerebral artery stem (arrows).
(F) Follow-up of gradient echo interleaved Echo Planar Imaging on day 2 depicted hemorrhage in the left middle cerebral artery territory.
DISCUSSION
The aim of this study was to validate the HMCA sign on post-Gd T1W MRI, including direct comparison with the gold standards of MRA and DSA. A comparison between MRA and DSA demonstrated that the HMCA sign on Gd-DTPA MRI had clear diagnostic value as a highly specific (100%) and moderately sensitive (20%) indicator of acute thrombus within the MCA.
Furthermore, this sign was significantly correlated with developing HT (P = 0.001). The sensitivity, specificity, and positive predictive values of the HMCA sign on post-Gd T1W MRI for subsequent HT were 54.5, 100, and 100% respectively.
Previous studies demonstrated that the hyperdense MCA sign on CT was associated with more severe neurological deficits at the time of patient presentation compared to the absence of any CT-visible intraluminal thrombosis. The hyperdense MCA sign on CT is a well-established predictor for artery occlusion with subsequent development of a large infarct and with a poor clinical outcome, even when patients are given tPA within 3 hours[8,11,12,13,14,15].
Multivariable analyses recently showed patients with a hyperdense artery sign had a specific pretreatment MRI pattern with larger diffusion-weighted imaging and perfusion-weighted imaging lesion volume[9]. The appearance of the HMCA sign on MRI and the hyperdense MCA sign on CT in the current study are in accordance with these previous studies. For the MRA and DSA comparison, all patients with HMCA sign on MRI had occlusions on M1 segment of MCA. The thrombosed MCA on Gd-DTPA MRI appeared as hyperintense and was larger than the contralateral artery. This likely represents vascular distention at and/or proximal to the obstructing clot[12].
An alternative mechanism may be associated with hypertension in these patients[9,12,16]. Hypertension during the first 24 hours after onset of stroke is an independent factor for predicting HT[9]. The atherosclerotic MCA burden with elevated blood pressure during the acute phase may result in exudation of RBCs and gadolinium. Consequently, the affected MCA appears thickened and blurred with increased T1 signal. Additionally, these patients with a proximal occlusion experience an immediate fall in blood flow to the territories supplied by the lenticulostriatal arteries, where collaterals are limited. This leads to an increased risk of hemorrhagic transformation where ischemic injury is greatest[9]. Of note, ischemic-induced stasis of blood may also lead to hemolysis. Hemolysates may contribute to parenchymal damage, as well as enhance rtPA activity, which may be a factor in the exacerbation of hemorrhagic transformation[17]. In the present study, two patients with HMCA sign after tPA treatment developed HT on follow-up.
The incidence of the hyperdense MCA sign on CT was previously reported as 16-25%[6,9,12], which is consistent with the incidence of the HMCA sign on MRI and the hyperdense MCA sign on CT in the present study. We also found that the incidence of the HMCA sign on MRI (20%) was slightly higher that the hyperdense MCA sign on CT (30%). Factors that may account for the association of CT-visible clots with younger age include vessel calcification obscuring the presence of intraluminal thrombus and formation of less densely packed clots at an older age[6]. Additionally, false-positive hyperdense MCA signs have been reported in association with atherosclerosis and an elevation in hematocrit, as well as herpes simplex encephalitis, subacute stroke, and polycythemia[6,12]. In the present study, however, there was no difference in the age of patients with and without HMCA signs. Further, the false positives mainly caused by atherosclerosis and calcification on CT could not occur on MRI.
In the ECASS I trial, patients with the hyperdense MCA sign who were given rtPA had better neurological recovery than those who received placebo[8]; this benefit did not occur at the expense of increased mortality. However, in 100 consecutive patients who presented within 3 hours of symptom onset and then received intravenous tPA, Barber et al[11] reported that all five patients with a hyperdense MCA sign, including two with an associated MCA dot sign, either died or were dependent at 3 months. By contrast, 64% patients with an MCA “dot” sign alone were independent at 3 months. In our group, five of nine patients with hyperdense MCA sign, as well as all six patients with HMCA sign on MRI, had subsequent HT. By contrast, three of seven patients with MCA “dot” sign were in the HT group. An isolated HMCA sign, reflecting MCA occlusion, indicates a greater volume of territory at risk than a solitary MCA dot sign reflecting M2/M3 occlusions. Additionally, patients with HMCA sign and M1 occlusions had more clot burden than patients with solitary MCA dot signs and M2/M3 occlusions, and were less likely to recanalize in response to endovascular treatment[6]. Therefore, the hyperdense MCA sign and the solid MCA “dot” sign represent different considerations when selecting the rtPA candidates.
Intravenous tPA is an important therapeutic option that may be appropriate for some occlusive diseases such as MCA branch occlusions, whereas other large artery occlusions may not be as responsive[18,19]. The identification of thromboembolic occlusions has become even more pertinent after the publication of the positive PROACT II trial[19]. As time after insult is critical in the treatment of acute ischemic stroke, it is necessary to develop reliable and accessible noninvasive imaging modalities. Our MRI protocol was reported to be able to rapidly assess hemorrhage, diffusion, and perfusion of the great vessels from the aortic arch to the circle of Willis, and early defects in the blood brain barrier[20,21]. In our institution, the short acquisition time (10 minutes 49 seconds total for eight sequences) and the need for three injections did not significantly compromise image quality. The MRA was judged slightly better than average despite the presence of preexisting Gd-DTPA[20]. Such early defects in the blood brain barrier (e.g. early parenchymal enhancement and increased permeability[21]) and HMCA sign detected by MRI indicate the potential to identify patients at high risk of HT. This may allow the use of physiologic imaging rather than time from onset of symptoms to guide the decision for treatment outside of the current therapeutic time window in patients with a stable blood brain barrier.
In comparison with MRA and DSA as gold standards, this study demonstrated that HMCA sign on post-Gd T1WI has diagnostic value for acute thrombus within the MCA during the acute phase of ischemic stroke. Furthermore, HMCA sign on Gd-DTPA MRI was a highly specific and moderately sensitive indicator for HT. The HMCA sign represents a useful addition to the catalog of signs of acute cerebral ischemia evident on early MR studies.
SUBJECTS AND METHODS
Design
A retrospective case analysis of neuroimaging.
Time and setting
Experiments were performed between August 2002 and April 2005 at Toronto Western Hospital, Canada.
Subjects
All patients undergoing acute stroke imaging at Toronto Western Hospital between August 2002 and April 2005 were enrolled in this study according to the following inclusion/exclusion criteria:
Inclusion criteria: (1) The initial MRI was performed within 6 hours after symptom onset; (2) The follow-up MRI and CT scan were performed within the first week after symptom onset.
Exclusion criteria: Patients with hemorrhage on the initial MRI or CT scan.
Patients treated with tPA were eligible for participation. Thirty patients (18 males and 12 females, aged from 39–97 years at a mean of 69.1 years) underwent acute stroke imaging and fulfilled the enrollment criteria. Five patients received intravenous tPA treatment within 3 hours of symptom onset.
Methods
Imaging protocol
All MRI studies were performed using a 1.5 T whole-body MR unit (Signa cv/I; GE Healthcare, Milwaukee, WI, USA) with a single channel quadrature head coil. The typical stroke-imaging protocol included: (1) LOCALIZER (3 plane head and neck) (TR/TE: 27.3/1.6 ms; FOV: 24 cm × 24 cm; matrix: 256 × 128), (2) Fast spin-echo T1-weighted imaging (TR/TE: 833.3/10; FOV: 24 cm × 18 cm; matrix: 256 × 192), (3) EPI diffusion-weighted imaging (single-shot) (TR/TE: 10 000/99.6 ms; FOV: 22 cm × 22 cm; matrix: 96 × 200; Diffusion gradients with a b value of 1 000 s/mm2 applied separately in three orthogonal directions to generate trace images), (4) EPI FLAIR (single shot) (TR/TE: 8 800/120 ms; FOV: 24 cm × 24 cm; matrix: 256 × 192), (5) EPI GRE (multi-shot) (TR/TE: 2 616.7/30 ms; FOV: 24 cm × 24 cm; matrix: 256 × 224), (6) GRE permeability (31 phases) (TR/TE: 5.9/1.3 ms; FOV: 24 cm × 24 cm; matrix: 128 × 128), (7) EPI perfusion (single-shot 25 phases; 18 slices) (TR/TE: 1 766.7/31.5 ms; FOV: 27 cm × 27 cm; matrix: 96 × 64), (8) CE MRA (TR/TE: 6.2/1.6 ms; flip angle: 20°; fractional echo acquisition; FOV: 23.0 cm × 17.25 cm; matrix: 320 × 240; bandwidth: 62.5 kHz; section thickness: 0.8 mm), and (9) gadolinium-enhanced T1-weighted conventional spin-echo imaging (TR/TE: 650/20 ms; FOV: 24 cm × 18 cm; matrix: 256 × 192). The total scanning time was 10 minutes and 49 seconds. Our acute stroke protocol utilizes three sequential 15 mL doses of magnevist for permeability and perfusion (data not shown).
CT studies were performed using a LightSpeed Ultra CT scanner (140 kV, 206–223 mA; GE Medical Systems) by using 5 mm contiguous sections with 5 mm-thick sections through the skull base without contrast enhancement. A subset of 12 patients underwent selective intracarotid DSA (LC plus; GE Healthcare), as it was considered that these patients may have benefited from intraarterial thrombolytic therapy.
Image analysis
Two neuroradiologists who were blinded to the follow-up images and clinical information independently reviewed the initial MR and CT images to determine the presence of HMCA sign on post-Gd T1WI and hyperdense MCA sign and MCA “dot” sign on non-contrast CT. When a discrepancy occurred, the decision was made by a consensus. The HMCA sign on post-Gd T1WI was defined as post-gadolinium T1 hyperintensity within the MCA, in which the diameter of the vessel exceeded the contralateral vessel diameter and showed blurred margins with intense signal. The hyperdense MCA sign on CT was defined as a MCA denser than its counterpart and any other vascular structure excluding obvious calcification[11]. The MCA dot sign on CT was defined as the hyperdensity of an arterial structure in the sylvian fissure relative to the contralateral side or to other vessels within the sylvian fissure[12].
The presence of HT on MR was assessed on initial and follow-up T2*-weighed gradient echo images echo-planar sequence as low signal compared to the brain parenchyma, and on CT as high attenuation compared to the cortex. The presence of acute stroke was assessed on diffusion-weighted imaging as high signal, and on ADC images as low intensity[4].
Vessel occlusions were categorized on CE MRA and DSA as ICA, M1 segment of MCA and branches (M2, M3 segments of the MCA).
Statistical analysis
Fisher's exact test was used to determine if the differences in the HMCA on post-Gd T1WI and hyperdense MCA sign and dot sign on non-contrast CT observed in patients with and without HT were statistically significant. A P-value of less than 0.05 was considered statistically significant. Sensitivity, specificity, and positive predictive value of subsequent HT were also calculated for the HMCA sign on MRI. The ages between patients in the HT and non-HT groups, and between patients with and without HMCA sign in the HT group, were expressed as mean ± SD and were compared using an independent samples t test. All statistical analyses were performed using SPSS 11.0 software (SPSS, Chicago, IL, USA).
Footnotes
Conflicts of interest: None declared.
Funding: This study was supported by the Xiamen Science and Technology Plan in 2008, No. 3502Z20084028.
Ethical approval: All research was approved by the Ethic Committee of Toronto Western Hospital in Canada.
(Edited by Yin JZ, Zhang ZQ/Yang Y/Wang L)
REFERENCES
- [1].Generalized efficacy of t-PA for acute stroke. Subgroup analysis of the NINDS t-PA Stroke Trial. Stroke. 1997;28(11):2119–2125. doi: 10.1161/01.str.28.11.2119. [DOI] [PubMed] [Google Scholar]
- [2].Hacke W, Donnan G, Fieschi C, et al. Association of outcome with early stroke treatment: pooled analysis of ATLANTIS, ECASS, and NINDS rt-PA stroke trials. Lancet. 2004;363(9411):768–774. doi: 10.1016/S0140-6736(04)15692-4. [DOI] [PubMed] [Google Scholar]
- [3].Tong DC, Adami A, Moseley ME, et al. Prediction of hemorrhagic transformation following acute stroke: role of diffusion- and perfusion-weighted magnetic resonance imaging. Arch Neurol. 2001;58(4):587–593. doi: 10.1001/archneur.58.4.587. [DOI] [PubMed] [Google Scholar]
- [4].Vo KD, Santiago F, Lin W, et al. MR imaging enhancement patterns as predictors of hemorrhagic transformation in acute ischemic stroke. AJNR Am J Neuroradiol. 2003;24(4):674–679. [PMC free article] [PubMed] [Google Scholar]
- [5].Kim EY, Na DG, Kim SS, et al. Prediction of hemorrhagic transformation in acute ischemic stroke: role of diffusion-weighted imaging and early parenchymal enhancement. AJNR Am J Neuroradiol. 2005;26(5):1050–1055. [PMC free article] [PubMed] [Google Scholar]
- [6].Leary MC, Kidwell CS, Villablanca JP, et al. Validation of computed tomographic middle cerebral artery “dot” sign: an angiographic correlation study. Stroke. 2003;34(11):2636–2640. doi: 10.1161/01.STR.0000092123.00938.83. [DOI] [PubMed] [Google Scholar]
- [7].Hiraga A. Prediction of hemorrhagic transformation in ischemic stroke. Neuroepidemiology. 2009;33(3):266–267. doi: 10.1159/000229782. [DOI] [PubMed] [Google Scholar]
- [8].Manelfe C, Larrue V, von Kummer R, et al. Association of hyperdense middle cerebral artery sign with clinical outcome in patients treated with tissue plasminogen activator. Stroke. 1999;30(4):769–772. doi: 10.1161/01.str.30.4.769. [DOI] [PubMed] [Google Scholar]
- [9].Derex L, Hermier M, Adeleine P, et al. Clinical and imaging predictors of intracerebral haemorrhage in stroke patients treated with intravenous tissue plasminogen activator. J Neurol Neurosurg Psychiatry. 2005;76(1):70–75. doi: 10.1136/jnnp.2004.038158. [DOI] [PMC free article] [PubMed] [Google Scholar]
- [10].Barber PA, Demchuk AM, Hill MD, et al. The probability of middle cerebral artery MRA flow signal abnormality with quantified CT ischaemic change: targets for future therapeutic studies. J Neurol Neurosurg Psychiatry. 2004;75(10):1426–1430. doi: 10.1136/jnnp.2003.029389. [DOI] [PMC free article] [PubMed] [Google Scholar]
- [11].Barber PA, Demchuk AM, Hudon ME, et al. Hyperdense sylvian fissure MCA “dot” sign: A CT marker of acute ischemia. Stroke. 2001;32(1):84–88. doi: 10.1161/01.str.32.1.84. [DOI] [PubMed] [Google Scholar]
- [12].Farb RI, McGregor C, Kim JK, et al. Intracranial arteriovenous malformations: real-time auto-triggered elliptic centric-ordered 3D gadolinium-enhanced MR angiography--initial assessment. Radiology. 2001;220(1):244–251. doi: 10.1148/radiology.220.1.r01jn15244. [DOI] [PubMed] [Google Scholar]
- [13].Rovira A, Orellana P, Alvarez-Sabín J, et al. Hyperacute ischemic stroke: middle cerebral artery susceptibility sign at echo-planar gradient-echo MR imaging. Radiology. 2004;232(2):466–473. doi: 10.1148/radiol.2322030273. [DOI] [PubMed] [Google Scholar]
- [14].Lin K, Zink WE, Tsiouris AJ, et al. Risk assessment of hemorrhagic transformation of acute middle cerebral artery stroke using multimodal CT. J Neuroimaging. 2010 doi: 10.1111/j.1552-6569.2010.00562.x. doi: 10.1111/j.1552-6569.2010.00562.x. [DOI] [PMC free article] [PubMed] [Google Scholar]
- [15].Kim JH, Bang OY, Liebeskind DS, et al. Impact of baseline tissue status (diffusion-weighted imaging lesion) versus perfusion status (severity of hypoperfusion) on hemorrhagic transformation. Stroke. 2010;41:3, e135–142. doi: 10.1161/STROKEAHA.109.563122. [DOI] [PubMed] [Google Scholar]
- [16].Dijkhuizen RM, Asahi M, Wu O, et al. Rapid breakdown of microvascular barriers and subsequent hemorrhagic transformation after delayed recombinant tissue plasminogen activator treatment in a rat embolic stroke model. Stroke. 2002;33(8):2100–2104. doi: 10.1161/01.str.0000023534.37670.f7. [DOI] [PubMed] [Google Scholar]
- [17].Terruso V, D’Amelio M, Di Benedetto N, et al. Frequency and determinants for hemorrhagic transformation of cerebral infarction. Neuroepidemiology. 2009;33(3):261–265. doi: 10.1159/000229781. [DOI] [PubMed] [Google Scholar]
- [18].Casey CL, Murray CA. HT update: spotlight on estradio/ norethindrone acetate combination therapy. Clin Interv Aging. 2008;3(1):9–16. doi: 10.2147/cia.s1663. [DOI] [PMC free article] [PubMed] [Google Scholar]
- [19].Lin S, Wu B, Hao ZL, et al. Characteristics, treatment and outcome of ischemic stroke with atrial fibrillation in a Chinese hospital-based stroke study. Cerebrovasc Dis. 2011;31(5):419–426. doi: 10.1159/000323221. [DOI] [PubMed] [Google Scholar]
- [20].Mikulis DJ, Kassner A, Rowan S, et al. Toronto: Proceedings of the 43rd Annual Meeting of the American Society of Neuroradiology; 2005. Acute ischemic stroke MR imaging: rapid assessment of anatomy, hemorrhage, penumbra, major vessels, and early defects in the blood-brain barrier. [Google Scholar]
- [21].Kassner A, Roberts T, Taylor K, et al. Prediction of hemorrhage in acute ischemic stroke using permeability MR imaging. AJNR Am J Neuroradiol. 2005;26(9):2213–2217. [PMC free article] [PubMed] [Google Scholar]


