Abstract
Given the global burden of diarrheal diseases1, it is important to understand how members of the gut microbiota affect the risk for, course of, and recovery from disease in children and adults. The acute, voluminous diarrhea caused by Vibrio cholerae represents a dramatic example of enteropathogen invasion and gut microbial community disruption. We have conducted a detailed time-series metagenomic study of fecal microbiota collected during the acute diarrheal and recovery phases of cholera in a cohort of Bangladeshi adults living in an area with a high burden of disease2. We find that recovery is characterized by a pattern of accumulation of bacterial taxa that shows similarities to the pattern of assembly/maturation of the gut microbiota in healthy Bangladeshi children3. To define underlying mechanisms, we introduced into gnotobiotic mice an artificial community that was composed of human gut bacterial species that directly correlate with recovery from cholera in adults and are indicative of normal microbiota maturation in healthy Bangladeshi children3. One of the species, Ruminococcus obeum, exhibited consistent increases in its relative abundance upon V. cholerae infection of the mice. Follow-up analyses, including mono- and co-colonization studies, established that R. obeum restricts V. cholerae colonization, that R. obeum luxS [autoinducer-2 (AI-2) synthase] expression and AI-2 production increase significantly with V. cholerae invasion, and that R. obeum AI-2 causes quorum-sensing mediated repression of several V. cholerae colonization factors. Co-colonization with V. cholerae mutants disclosed that R. obeum AI-2 reduces Vibrio colonization/pathogenicity through a novel pathway that does not depend on the V. cholerae AI-2 sensor, LuxP. The approach described can be used to mine the gut microbiota of Bangladeshi or other populations for members that use autoinducers and/or other mechanisms to limit colonization with V. cholerae, or conceivably other enteropathogens.
We used an IRB-approved protocol for recruiting Bangladeshi adults living in Dhaka Municipal Corporation area for this study. Of the 1153 patients with acute diarrhea who were screened, seven passed all entry criteria (Methods) and were enrolled (Supplementary Tables 1,2). Fecal samples collected at monthly intervals during the first two postnatal years from 50 healthy children living in the Mirpur area of Dhaka city plus samples obtained at ~3-month intervals over a 1-year period from 12 healthy adult males also living Mirpur, allowed us to compare recovery of the microbiota from cholera with the normal process of assembly of the gut community in infants and children, and with unperturbed communities from healthy adult controls..
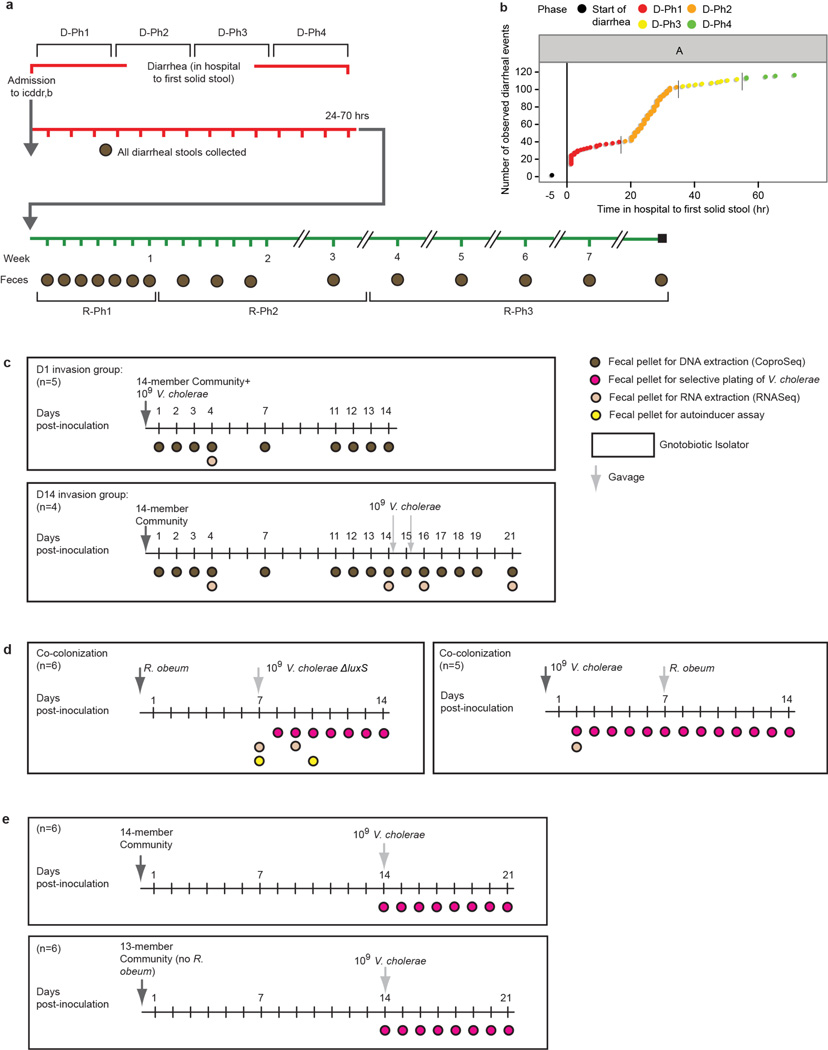
Using icddr,b’s standard treatment protocol, study participants with acute cholera received a single oral dose of azithromycin and were given oral rehydration therapy for the duration of their hospital stay. Patients were discharged after their first solid stool. We divided the diarrheal period (first diarrheal stool after admission through the first solid stool) into four proportionately equal time bins: Diarrheal Phase 1 (D-Ph1) to D-Ph4. Fecal samples were collected every day for the first week following discharge (Recovery Phase 1, R-Ph1), weekly during the next 3 weeks (R-Ph2), and monthly for the next two months (R-Ph3). For each individual, we selected a subset of samples from D-Ph1 to D-Ph3 (Methods), plus all samples from D-Ph4 to R-Ph3, for analysis of bacterial composition by sequencing PCR amplicons generated from variable region 4 (V4) of the 16S rRNA gene (Supplementary Information, Extended Data Fig. 1a; Supplementary Table 3). Reads sharing 97% nucleotide sequence identity were grouped into Operational Taxonomic Units (97%-identity OTUs; Methods).
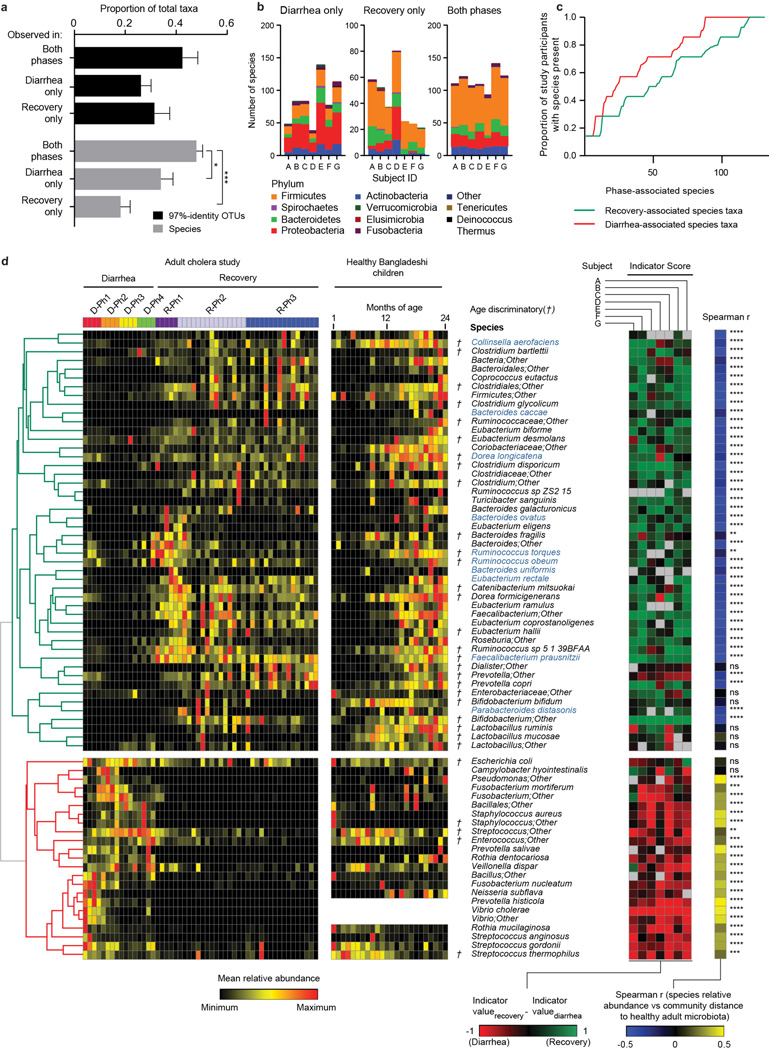
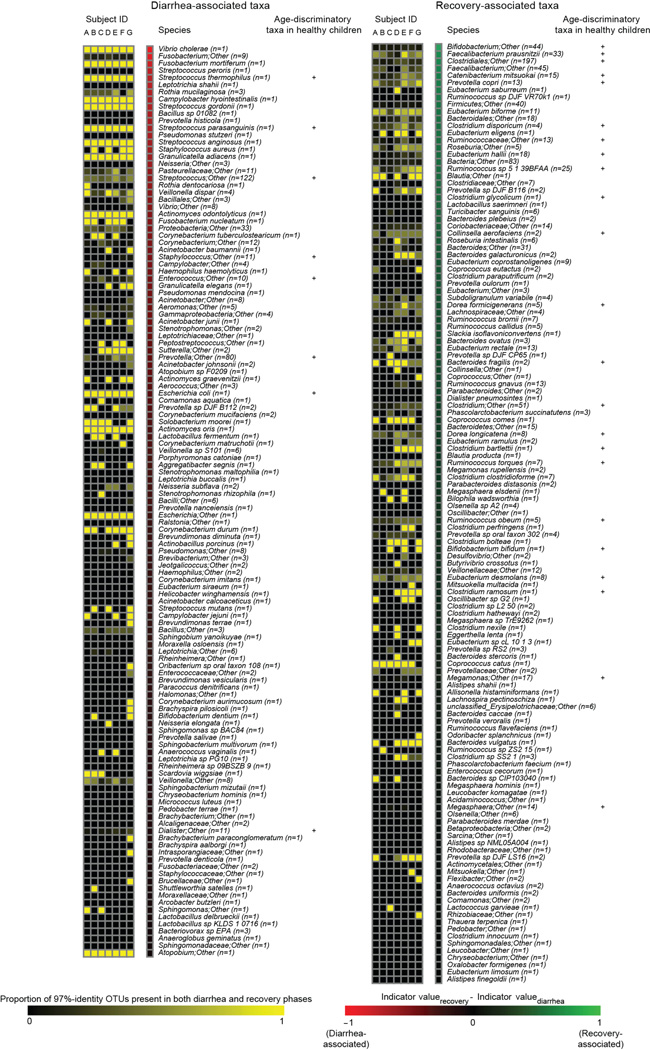
We identified a total of 1733 97%-identity OTUs assigned to 343 different species after filtering and rarefaction (Methods). V. cholerae dominated the microbiota of the seven cholera patients during D-Ph1 (mean maximum relative abundance; 55.6%), declining markedly within hours after initiation of oral rehydration therapy. The microbiota then became dominated by either an unidentified Streptococcus species (maximum relative abundance 56.2%–98.6%), or by Fusobacterium species (19.4%–65.1% in subjects B–E). In Patient G, dominance of the community passed from a Campylobacter species (58.6% maximum) to Streptococcus (98.6% maximum) (Supplementary Table 4). Of the 343 species, 47.9±6.6% (mean±SD) were observed throughout both the diarrheal and recovery phases suggesting that microbiota composition during the recovery phase may reflect an outgrowth from reservoirs of bacteria retained during disruption by diarrhea (Extended Data Fig. 2a–d plus Supplementary Information).
Indicator species analysis4 (Methods) was used to identify 260 bacterial species consistently associated with the diarrheal or recovery phases across members of the study group, and in a separate analysis for each subject (Supplementary Table 5). The relative abundance of each of the discriminatory species in each fecal sample was compared to the mean weighted phylogenetic (UniFrac5) distance between that microbiota sample and all healthy adult Bangladeshi microbiota samples. The results revealed 219 species with significant indicator value assignments to diarrheal or recovery phase, and relative abundances with statistically significant Spearman rank correlation values to community UniFrac distance to healthy control microbiota (Supplementary Table 6; Extended Data Fig. 2d). Not surprisingly, the abundance of V. cholerae directly correlated with increased distance to a healthy microbiota. Streptococcus and Fusobacterium species, which bloomed during the early phases of diarrhea, were also significantly and positively correlated to distance from a healthy adult microbiota. Increases in the relative abundances of species in the genera Bacteroides, Prevotella, Ruminococcus/Blautia, and Faecalibacterium (e.g., B. vulgatus, P. copri, R. obeum, and Faecalibacterium prausnitzii) were strongly correlated with a shift in community structure towards a healthy adult configuration (Extended Data Fig. 2d, Supplementary Table 6).
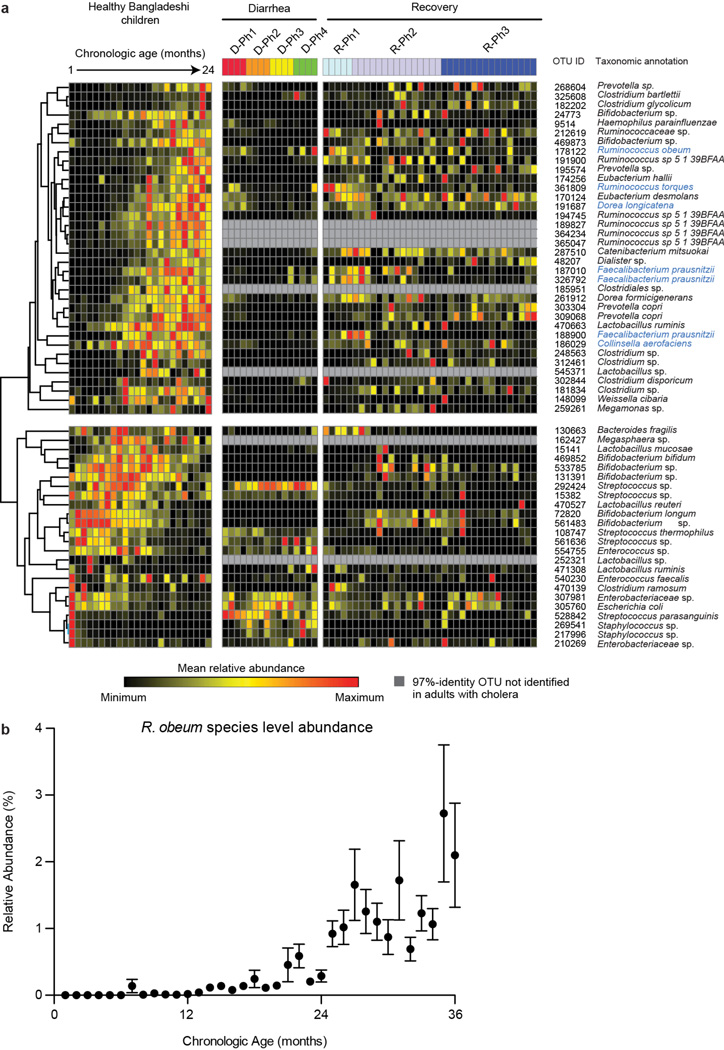
Previously we used Random Forests, a machine-learning algorithm, to identify a collection of age-discriminatory bacterial taxa that together define different stages in the postnatal assembly/maturation of the gut microbiota in healthy Bangladeshi children living in the same area as the adult cholera patients3. Of those 60 most age-discriminatory 97%-identity OTUs representing 40 different species, 31 species were present in adult cholera patients. Intriguingly, they followed a similar progression of changing representation during diarrhea to recovery as they do during normal maturation of the healthy infant gut microbiota (Extended Data Fig. 2d). Twenty-seven of the 31 species were significantly associated with recovery from diarrhea by indicator species analysis (see Supplementary Information plus Extended Data Figures 3–5 for OTU-level and community-wide analyses). These 27 species, which serve as indicators and are potential mediators of restoration of the gut microbiota following cholera, guided construction of a gnotobiotic mouse model that examined the molecular mechanisms by which some of these taxa might affect V. cholerae infection and promote restoration of the microbiota.
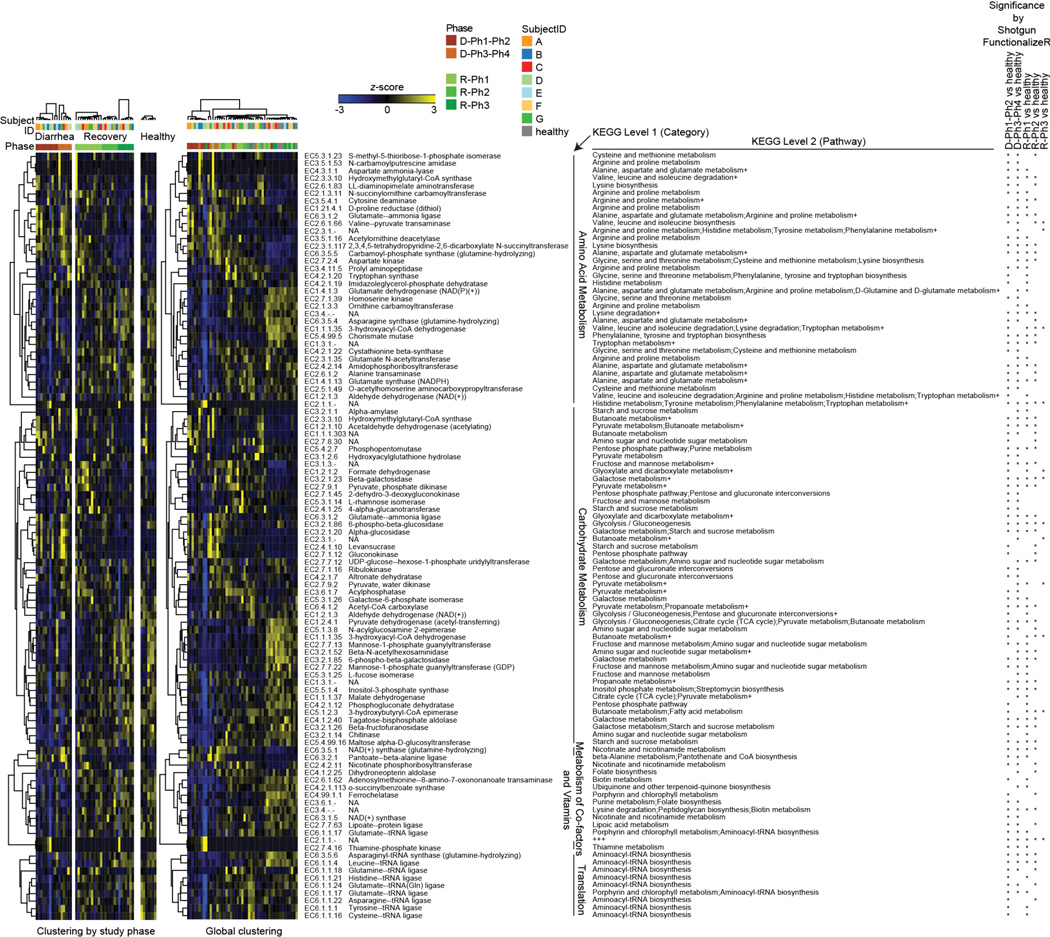
We assembled an artificial community of 14 sequenced human gut bacterial species (Supplementary Table 7) that included (i) five species that directly correlated with gut microbiota recovery from cholera and with normal maturation of the infant gut microbiota (Ruminococcus obeum, Ruminococcus torques, F. prausnitzii, Dorea longicatena, Collinsella aerofaciens), (ii) six species significantly associated with recovery from cholera by indicator species analysis (Bacteroides ovatus, Bacteroides vulgatus, Bacteroides caccae, Bacteroides uniformis, Parabacteroides distasonis, Eubacterium rectale), and (iii) three prominent members of the adult human gut microbiota that have known capacity to process dietary and host glycans [Bacteroides cellulosilyticus, Bacteroides thetaiotaiotaomicron, Clostridium scindens6–8; as noted in Supplementary Information, Extended Data Fig. 6 and Supplementary Table 8, shotgun sequencing of diarrhea and recovery phase human fecal DNA samples revealed that genes encoding enzymes (ECs) involved in carbohydrate metabolism were the largest category of ECs that changed in relative abundance within the fecal microbiome during the course of cholera]. One group of mice was directly inoculated with ~109 CFU of V. cholerae at the same time they received the 14-member community to simulate the rapidly expanding V. cholerae population during diarrhea (“D1invasion” group). A separate group was gavaged with the community alone and then invaded 14d later with V. cholerae (“D14invasion” group) (Extended Data Fig. 1c).
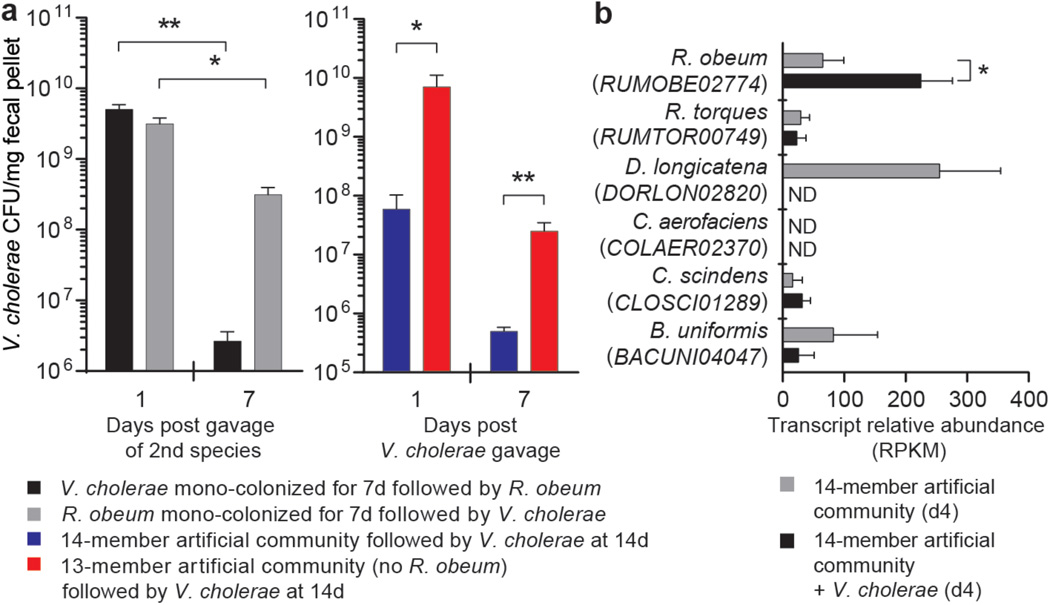
V. cholerae levels remained at a high level in the D1invasion group over the first week (maximum 46.3% relative abundance), and then declined rapidly to low levels (<1%). Introduction of V. cholerae into the established 14-member community produced much lower levels of V. cholerae infection (range of mean abundances measured daily over the 3 days after the first gavage of the enteropathogen: 1.2–2.7%, Supplementary Table 9). Control experiments demonstrated that V. cholerae was able to colonize at high levels for at least 7 days when it was introduced alone into germ-free recipients (109–1010 CFU/mg wet weight of feces; Fig. 1a). Together, these data suggested that a member or members of the artificial human gut microbiota had the ability to restrict V. cholerae colonization.
Figure 1. R. obeum restricts V. cholerae colonization in adult gnotobiotic mice.
(a) V. cholerae levels in the feces of mice colonized with the indicated human gut bacterial species (n=4–6 mice/ group). (b) Expression of R. obeum luxS AI-2 synthase in the 14-member community 4d after introduction of 109 CFU of V. cholerae or no pathogen (n=5 mice/group. Note that D. longicatena levels fall precipitously after V. cholerae invasion (Supplementary Table 9). Mean values±SEM are shown. *, P<0.05, **, P<0.01 (unpaired Mann-Whitney U test).
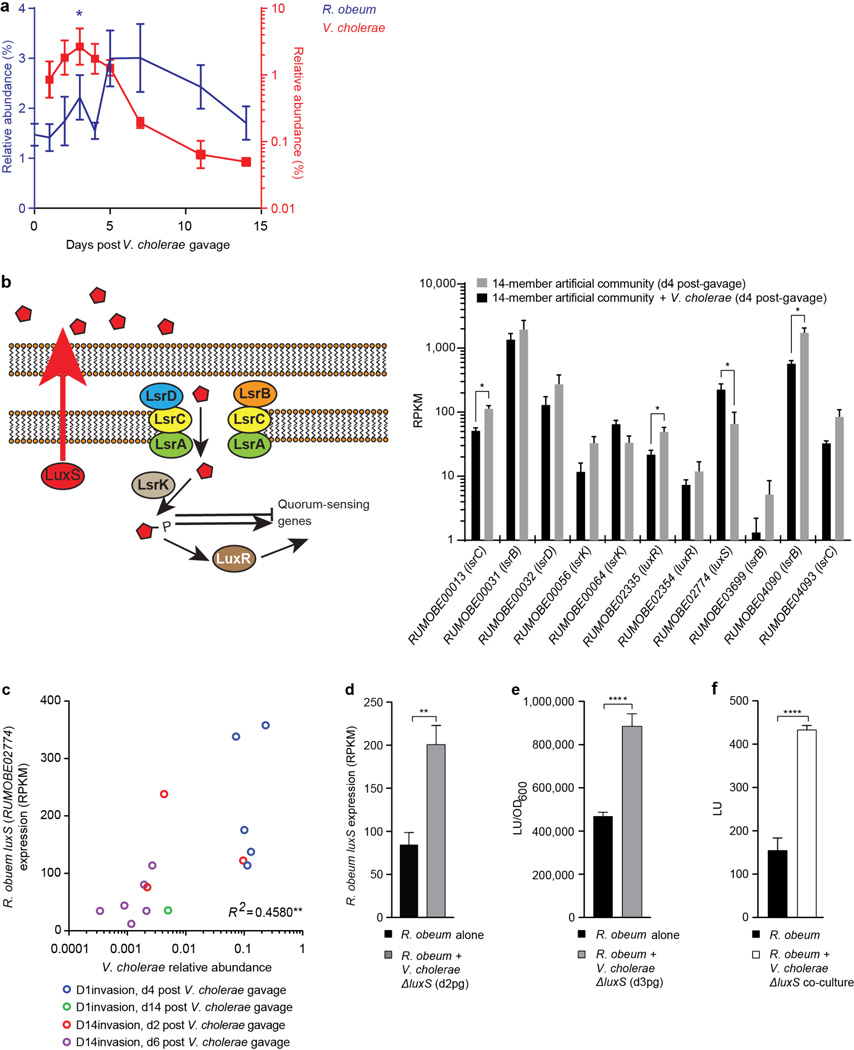
Changes in relative abundances of the 14 community members in fecal samples in response to V. cholerae were consistent for most species across the D1invasion and D14invasion mice (Supplementary Table 9). We focused on one member, R. obeum, because its relative abundance increased significantly after introduction of V. cholerae in both the D1invasion and D14invasion groups (Extended Data Fig. 7a, Supplementary Table 9) and because it is a prominent age-discriminatory taxon in the Random Forests model of microbiota maturation in healthy Bangladeshi children3 (Extended Data Fig. 4b). Mice were mono-colonized with either R. obeum or V. cholerae for 7d and then the other species was introduced (Extended Data Fig. 1d). When R. obeum was present, V. cholerae levels declined by 1–3 logs (Fig. 1a). Germ-free mice were also colonized with the defined 14-member community or the same community without R. obeum for 2 weeks, and V. cholerae then introduced by gavage (Extended Data Fig. 1e). V. cholerae levels 1 day after gavage were >100-fold higher in the community that lacked R. obeum; these differences were sustained over time (50-fold higher after 7d; P<0.01, unpaired Mann-Whitney U test; Fig. 1a).
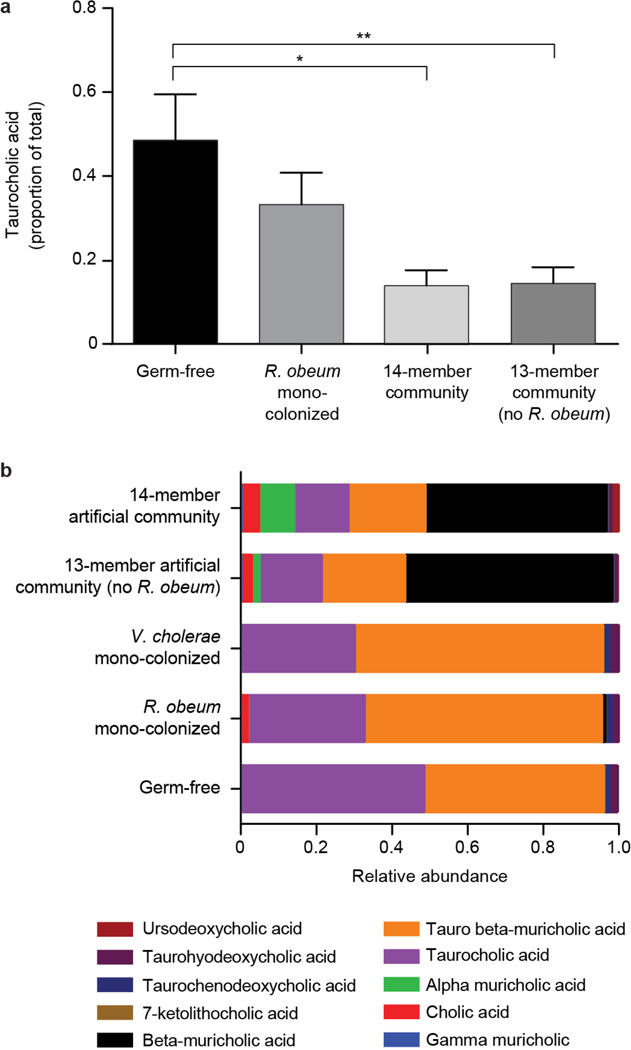
Having established that R. obeum restricts V. cholerae colonization, we used microbial RNA-Seq of fecal RNAs to determine the effect of R. obeum on expression of known V. cholerae virulence factors in mono- and co-colonized mice. Co-colonization led to reduced expression of tcpA (a primary colonization factor in humans9,10), rtxA and hlyA (encoding accessory toxins11–12), and VC1447–VC1448, (RtxA transporters) (3–5-fold changes; P<0.05 compared to V. cholerae mono-colonized controls, Mann-Whitney U test; see Supplementary Information and Supplementary Table 10 for other regulated genes that could impact colonization plus Extended Data Fig. 8 for a UPLC-MS analysis of bile acids reported to effect cholera gene regulation13).
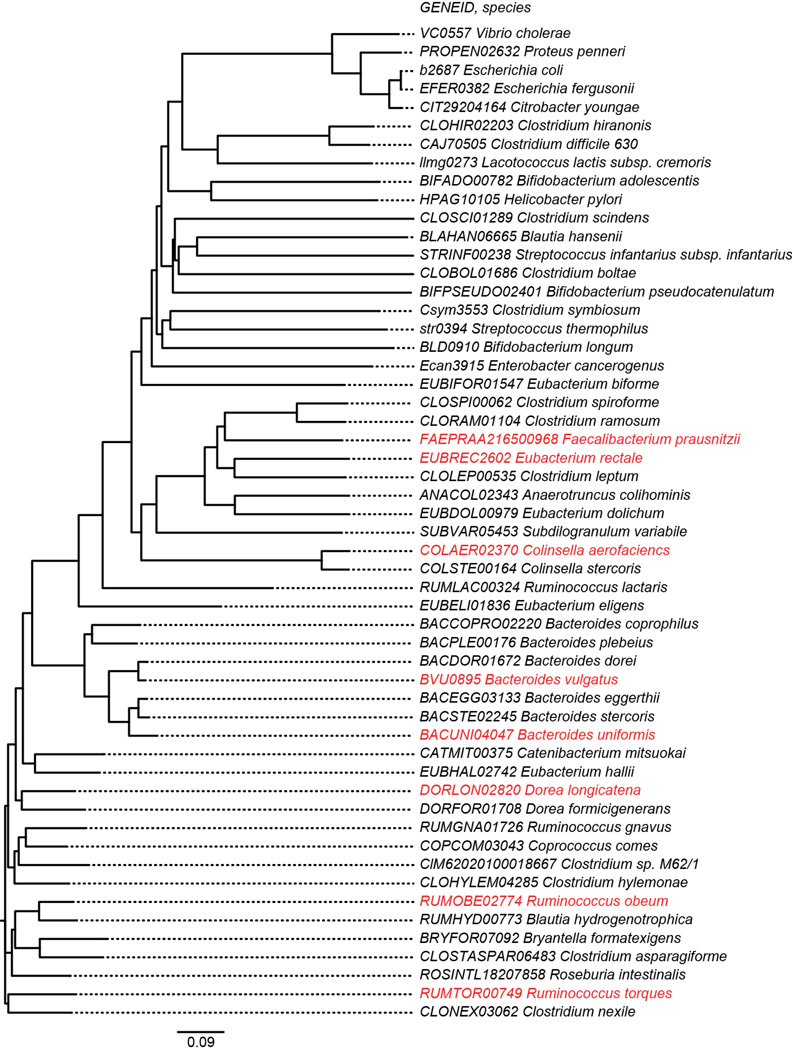
Two quorum-sensing pathways are known to regulate V. cholerae colonization/virulence14–17; an intra-species mechanism involving cholera autoinducer-1, and an inter-species mechanism involving autoinducer-218,19. Quorum-sensing disrupts expression of V. cholerae virulence determinants through a signaling pathway that culminates in production of the LuxR-family regulator HapR15,16. Repression of quorum-sensing in V. cholerae is important for virulence factor expression and infection20–22. luxS encodes the S-ribosylhomocysteine lyase responsible for AI-2 synthesis. luxS homologs are widely distributed among bacteria18,19, including eight of the 14 species in the artificial human gut community (Supplementary Table 11, Extended Data Fig. 9). RNA-Seq of the fecal meta-transcriptomes of D1invasion mice colonized with the 14-member artificial community plus V. cholerae, and mice harboring the 14-member consortium without V. cholerae, revealed that of predicted luxS homologs in the community, only expression of R. obeum luxS (RUMOBE02774) increased significantly in response to V. cholerae (P<0.05, Mann-Whitney U test; Fig. 1b). Moreover, R. obeum luxS transcript levels directly correlated with V. cholerae levels (Extended Data Fig. 7c).
In addition to luxS, the R. obeum strain represented in the artificial community contains homologs of lsrABCK that are responsible for import and phosphorylation of AI-2 in Gram-negative bacteria23, as well as homologs of two genes, luxR and luxQ, that play a role in AI-2 sensing and downstream signaling in other organisms24. Expression of all these R. obeum genes was detected in vivo, consistent with R. obeum having a functional AI-2 signaling system (Extended Data Fig. 7b). [See Supplementary Information for results showing that R. obeum AI-2 production is stimulated by V. cholerae in vitro and in co-colonized animals (Extended Fig. 7d–f), plus a genome-wide analysis of the effects of V. cholerae on R. obeum transcription in co-colonized mice (Supplementary Table 10c)].
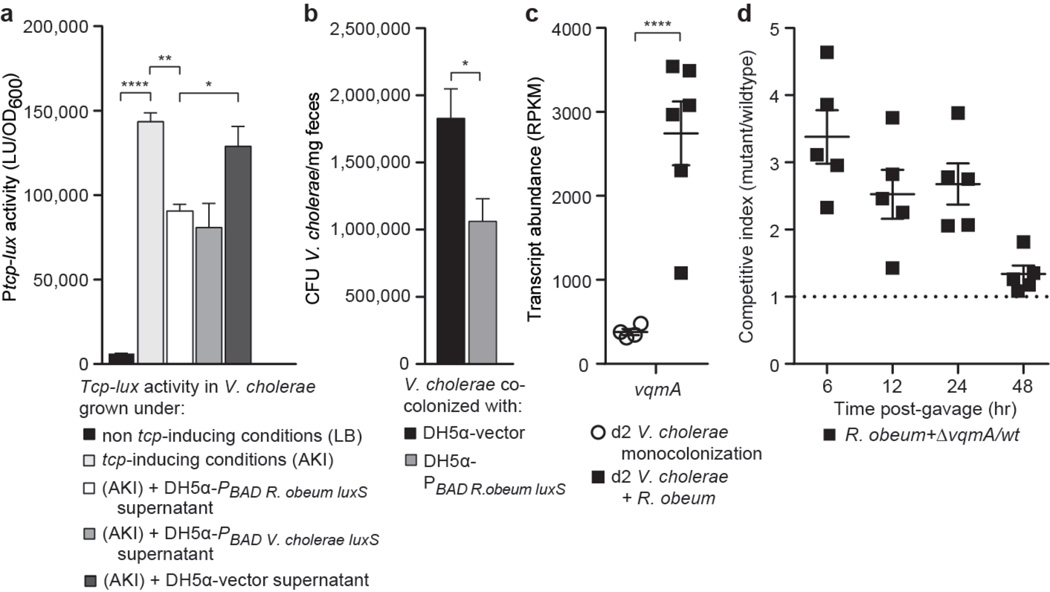
Quorum-sensing down-regulates the V. cholerae tcp operon that encodes components of the toxin co-regulated pilus (TCP) biosynthesis pathway required for infection of humans9,10. To confirm that R. obeum LuxS could signal through AI-2 pathways, we cloned R. obeum and V. cholerae luxS downstream of the arabinose-inducible PBAD promoter in plasmids that were maintained in an E. coli strain unable to produce its own AI-2 (DH5α)25. High tcp expression can be induced in V. cholerae after slow growth in AKI medium without agitation followed by rapid growth under aerobic conditions26. Addition of culture supernatants harvested from the E. coli strains expressing R. obeum or V. cholerae luxS caused a 2–3-fold reduction in tcp induction in V. cholerae (P<0.05, unpaired Student’s t-test; replicated in four independent experiments). Supernatants from a control E. coli strain with the plasmid vector lacking luxS had no effect (Fig. 2a). These findings are consistent with our in vivo RNA-Seq results and provide direct evidence that R. obeum AI-2 regulates V. cholerae virulence factor expression.
Figure 2. R. obeum AI-2 reduces V. cholerae colonization and virulence gene expression.
(a) R. obeum AI-2 produced in E. coli represses the tcp promoter in V. cholerae (triplicate assays; results representative of four independent experiments). (b) Fecal V. cholerae levels in gnotobiotic mice 8h after gavage with V. cholerae and an E. coli strain containing either the PBAD-R. obeum luxS plasmid or vector control. (c) Fecal vqmA transcript abundance in mono- or co-colonized mice. (d) Competitive index of ΔvqmA versus wild-type V. cholerae during co-colonization with R. obeum (n=5 animals/group). Mean values±SEM are shown. *, P<0.05, **, P<0.01, ****, P<0.0001 (unpaired two-tailed Student’s t-test).
Germ-free mice were then colonized with V. cholerae and E. coli bearing either the PBAD-R. obeum luxS plasmid or the vector control. Mice that received E. coli expressing R. obeum luxS showed a significantly lower level of V. cholerae colonization 8h post-gavage than mice that received E. coli with vector alone [Fig. 2b; there was no statistically significant difference in levels of E. coli between the two groups (data not shown)]. Together, these results establish a direct causal relationship between R. obeum-mediated restriction of V. cholerae colonization and R. obeum AI-2 synthesis.
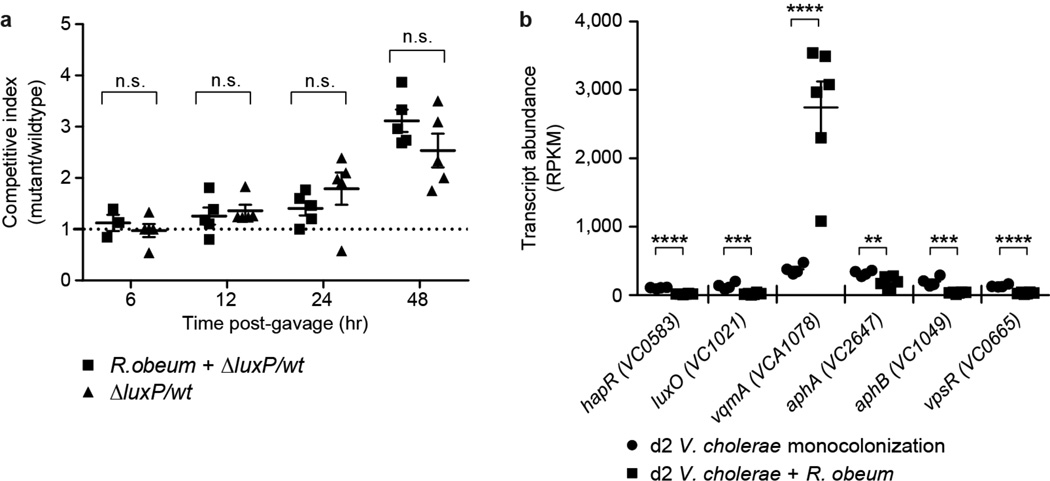
Several V. cholerae mutants were used to determine whether known V. cholerae AI-2 signaling pathways are required for the observed effects of R. obeum on V. cholerae colonization. LuxP is critical for sensing AI-2 in V. cholerae24. Co-colonization experiments in gnotobiotic mice revealed that levels of ΔluxP or wild-type luxP+ V. cholerae were not significantly different as a function of the presence of R. obeum (Extended Data Fig. 10a), suggesting that R. obeum modulates V. cholerae levels through other quorum-sensing regulatory genes. luxO and hapR encode central regulators linking known V. cholerae quorum-signaling and virulence regulatory pathways. luxO deletion typically results in increased hapR expression15. However, our RNA-Seq analysis had shown that both luxO and hapR are repressed in the presence of R. obeum (6–7 fold, P<0.0001; Mann-Whitney U test), as are two important downstream activators of virulence repressed by HapR16, encoded by aphA and aphB. These findings provide additional evidence that R. obeum operates to regulate virulence through a novel regulatory pathway.
The quorum-sensing transcriptional regulator VqmA was upregulated >25-fold when V. cholerae was introduced into mice mono-colonized with R. obeum (Fig. 2c, Supplementary Table 10). When germ-free mice were gavaged with R. obeum and a mixture of ΔvqmA (ΔlacZ)27 and wild-type V. cholerae (lacZ+), the ΔvqmA mutant exhibited an early competitive advantage (Fig. 2d), suggesting that R. obeum may be able to affect early colonization of V. cholerae through VqmA. VqmA is able to directly bind to and activate the hapR promoter27. Since RNA-Seq showed that hapR activation did not occur in gnotobiotic mice despite high levels of vqmA expression (Extended Data Fig. 10b; Supplementary Table 10), we postulate that the role played by VqmA in R. obeum modulation of Vibrio virulence genes involves an uncharacterized mechanism rather than the known pathway passing through HapR.
We have identified a set of bacterial species that strongly correlate with a process in which the perturbed gut bacterial community in adult cholera patients is restored to a configuration found in healthy Bangladeshi adults. Several of these species are also associated with the normal assembly/maturation of the gut microbiota in Bangladeshi infants/children, raising the possibility that some of these taxa may be useful for ‘repair’ of the gut microbiota in individuals whose gut communities have been ‘wounded’ through a variety of insults, including enteropathogen infection. Translating these observations to a gnotobiotic mouse model containing an artificial human gut microbiota composed of recovery- and age-indicative taxa established that one of these species, R. obeum, reduces V. cholerae colonization. As an entrenched member of the Bangladeshi gut microbiota, R. obeum could function to increase ID50 in humans and thus help determine whether or not exposure to a given dose of this enteropathogen results in diarrheal illness. The modest effects of R. obeum AI-2 on V. cholerae virulence gene expression in our adult gnotobiotic mouse model may reflect the possibility that we have only identified a small fraction of the microbiota’s full repertoire of virulence-suppressing mechanisms. Culture collections generated from the fecal microbiota of Bangladeshi subjects are a logical starting point for ‘second-generation’ artificial communities that contain R. obeum isolates that have evolved in this population, and for testing whether the observed effects of R. obeum generalize across many different strains from different populations. Moreover, the strategy described in this report could be used to mine the gut microbiota of Bangladeshi or other populations where diarrheal disease is endemic for additional species that use quorum-related and/or other mechanisms to limit colonization by V. cholerae and potentially other enteropathogens.
ONLINE METHODS
Human studies
Subject recruitment
Protocols for recruitment, enrollment and consent, procedures for sampling the fecal microbiota of healthy Bangladeshi adults and children, and the fecal microbiota of adults during and following cholera infection, plus the subsequent de-identification of these samples, were approved by the Human Studies Committees of the icddr,b and Washington University in St. Louis.
Enrollment into the adult cholera study was based on the following criteria: residency in the Dhaka Municipal Corporation area, a positive stool test for V. cholerae based on dark-field microscopy, diarrhea for no more than 24 hours prior to enrollment, and a permanent address that allowed follow-up fecal sampling after discharge from Dhaka Hospital (icddr,b). Non-prescription antibiotic usage is prevalent in Bangladesh28,29. Since a history of previous antibiotic consumption could be a confounder when interpreting the effects of cholera on the gut microbiota, we excluded individuals if they had received antibiotics in the seven days preceding admission to the hospital.
The healthy adults were fathers in a cohort of healthy twins, triplets and their parents living in Mirpur that is described in ref. 3. Fathers were sampled every three months during the first two years of their offspring’s postnatal life. Histories of diarrhea and antibiotic usage were not available for these fathers. However, histories of diarrhea and antibiotic use in their healthy children were known: 46 of the 49 paternal fecal samples used were obtained during periods when none of their children had diarrhea; 36 of these 49 samples were collected at a time when there had been no antibiotic use by their children in the preceding 7 days.
DNA extraction from human fecal samples, sequencing, and analysis
All diarrheal stools were collected from each participant (one sterilized bowl/sample), frozen immediately at −80°C and then subjected to the same bead beating and phenol chloroform extraction procedure for DNA purification that was applied to the formed frozen fecal samples collected from these individuals during the recovery phases (and previously to a wide range of samples collected from individuals representing different ages, cultural traditions, geographic locations and physiologic and disease states3,30).
DNA was isolated from all frozen fecal samples from D-Ph1 to D-Ph4, from the period of frequent sampling during the first week following discharge (recovery phase 1; R-Ph1), the period of less frequent sampling during weeks 2 through 3 (R-Ph2), and from weeks 4 to 12 of recovery (R-Ph3) (n=1,053 samples in total). For analyses involving healthy adult and child control group samples, samples were excluded from our analysis where antibiotic usage or diarrhea was known to have occurred in the 7 days prior to sample collection.
For each participant in the cholera study, we selected one sample with high DNA yield (≥2µg) from each two hour period during D-Ph1 through D-Ph3. An additional 7±2 samples (mean±SD) that had been collected during the ~5 h period before the rate of diarrhea began to decrease at the beginning of D-Ph3 were included. All fecal samples collected after this timepoint (i.e., from the remainder of D-Ph3 through R-Ph3), were also included in our analysis [n=19.7±7.4 total samples (mean±SD)/individual in the diarrheal phase, and 14±3.3 total samples/individual in the recovery phase]. Two subjects (C and E) were chosen for additional sequencing of all their diarrheal samples (n=100 and 50, respectively; see Supplementary Table 3b).
The V4 region of bacterial 16S rRNA genes represented in each selected fecal microbiota sample was amplified by PCR using primers containing sample-specific barcode identifiers. Amplicons were purified, pooled, and paired-end sequenced with an Illumina MiSeq instrument (250nt paired-end reads; 86,315±2,043 (mean±SEM) assembled reads/sample; see Supplementary Table 3). Healthy control samples were analyzed using the same sequencing platform and chemistry (n=293 total samples).
Sequences were assembled, then de-multiplexed and analyzed using the QIIME software package31 and custom Perl scripts. For analysis of diarrheal and recovery phase samples, rarefaction was performed to 49,000 reads/sample. For analyses including samples from healthy adults and children, samples were rarefied to 7,900 reads/sample. Reads sharing 97% nucleotide sequence identity were grouped into Operational Taxonomic Units (97%-identity OTUs). To ensure that we retained less abundant bacterial taxa in our analysis of the fecal samples of cholera patients, a 97%-identity OTU was called as ‘distinct and reliable’ if it appeared at 0.1% relative abundance in at least one fecal sample. Taxonomic assignments of OTUs to the species-level were made using the Ribosomal Database Project (RDP) version 2.4 classifier32 and a manually curated Greengenes database33.
Indicator species analysis4 was used to classify bacterial species that were highly associated with either diarrheal phases or recovery. This approach is used in studies of macroecosystems to identify species that associate with different environmental groupings; it assigns for each species an indicator value that is a product of two components: (i) the species’ specificity, which is the probability that a sample in which the species is found came from a given group, and (ii) the species’ fidelity, which is the proportion of samples from a given group that contains the species. We performed indicator species analysis in the set of 236 fecal specimens, selected from the seven subjects according to the subsampling scheme described above, to identify bacterial species consistently associated with the diarrheal or recovery phases across members of the study group; statistical significance was defined using permutation tests in which permutations were constrained within subjects. We also conducted a separate indicator species analysis for each subject, using each individual’s replicate diarrheal and recovery phase samples as the groupings.
For analyses of variation across communities, we used UniFrac5, a metric that measures the overall degree of phylogenetic similarity of any two communities based on the degree to which they share branch length on a bacterial tree of life; low pairwise UniFrac distance values indicate that communities are more similar to one another. Unifrac distances were calculated using the QIIME software package31.
The gut microbiomes of study participants were characterized by paired-end 2×250bp shotgun sequencing of fecal DNA using an Illumina MiSeq instrument (mean 216,698 reads per sample, Supplementary Table 3). Paired sequences were assembled into single reads using the SHERA software package34, and annotated by mapping to version 58 of the Kyoto Encyclopedia of Genes and Genomes (KEGG) database35 using UBLAST36.
Gnotobiotic mouse experiments
All experiments involving animals used protocols approved by the Washington University Animal Studies Committee. Germ-free male C57BL/6J mice were maintained in flexible plastic film gnotobiotic isolators and fed an autoclaved, low-fat, plant polysaccharide-rich mouse chow ad libitum (B&K, catalog #7378000, Zeigler Bros, Inc) ad libitum. Mice were 5–8 weeks old at time of gavage.
Bacterial strains and plasmids
Supplementary Table 7 lists the sequenced human gut-derived bacterial strains used to generate the artificial communities and their sources. Since all Bangladeshi fecal samples were devoted to DNA extraction, we were unable to utilize strains that originated from culture collections generated from study participants’ fecal biospecimens. Thus, the strains incorporated into the artificial community were from public repositories, represented multiple individuals and were typically not accompanied by information about donor health status or living conditions.
A Ptcp-lux reporter strain was constructed by introducing Ptcp-lux (pJZ376) into V. cholerae C6706 via conjugation from SM10λpir. PBAD-luxS expression vectors were produced by first amplifying the luxS sequences of V. cholerae C6706 and R. obeum ATCC2917 using PCR and the primers described in Supplementary Table 13. Amplicons were then cloned into pBAD202 (TOPO TA Expression Kit; Life Technologies), and introduced into E. coli DH5α by electroporation.
All cultures of V. cholerae C6706, the isogenic ΔluxS mutant (MM883), and E. coli strains containing luxS expression vectors were grown aerobically in LB medium with appropriate antibiotics (Supplementary Table 13). All members of the 14-member artificial human gut microbiota, including R. obeum ATCC29174, were propagated anaerobically in MegaMedium37.
Colonization of gnotobiotic mice
Mono-colonized animals received either 200µL of overnight cultures of R. obeum strain ATCC29174 or V. cholerae strain C6706. All V. cholerae colonization studies in mice were conducted using the current pandemic El Tor biotype (strain C6706). Mice receiving the defined 13- or 14-member communities of sequenced human bacterial symbionts were gavaged with 200µL of an equivalent mixture of bacteria assembled from overnight monocultures of each strain (OD600~0.4/strain; grown in MegaMedium). In the case of mice that received mixtures of V. cholerae and E. coli strains with R. obeum luxS-expressing plasmids (or vector controls), the E. coli strains were first grown overnight in LB medium containing 50µg/mL kanamycin. Two milliliters of the culture were removed and cell pellets were obtained by centrifugation, washed 3 times with 2mL LB medium to remove antibiotics, and resuspended in 6mL LB medium containing 0.1% arabinose. The suspension of E. coli cells was then incubated at 37°C for 90 min, mixed with V. cholerae C6706 such that each mouse was gavaged with ~50µL and ~2.5µL of overnight cultures of each organism, respectively. All gavages involving V. cholerae were preceded by a gavage of 100µL sterile 1M sodium bicarbonate to neutralize gastric pH. Colonization levels of V. cholerae were determined by serial dilution plating of fecal homogenates on selective medium.
Competitive index assays were performed with mice gavaged with 50µL aliquots of cultures of mutant and wild-type V. cholerae C6706 strains that had been grown to OD600 = 0.3. For experiments involving competitive index calculations as a function of the presence of R. obeum, 100µL of an overnight R. obeum culture was co-inoculated with the mixture of V. cholerae strains. Fecal samples from recipient gnotobiotic mice were subjected to dilution plating and λaerobic growth on LB agar with the LacZ substrate Xgal; blue-white screening was used to determine colonization levels of the individual V. cholerae strains.
Community profiling by shotgun sequencing (COPRO-Seq)
Shotgun sequencing of fecal community DNA was used to define the relative abundance of species in the artificial communities: experimental and computational tools for COPRO-Seq have been described previously8.
Microbial RNA-Seq analysis of fecal samples collected from mice colonized with the 14-member artificial community with and without V. cholerae
Fecal samples were collected from colonized gnotobiotic mice and immediately snap-frozen in liquid nitrogen. RNA was extracted using bead-beating in phenol/chloroform/isoamyl alcohol followed by further purification using MEGAClear (Life Technologies). Purified RNA was depleted of 16S rRNA, 5S rRNA and tRNA as previously described8 or by using the RiboZero kit (Epicentre). cDNA libraries were generated and sequenced (50 nt unidirectional reads; Illumina GA-IIx, HiSeq 2000 or MiSeq instruments; see Supplementary Table 3). Reads were mapped to the genomes of members of the artificial community using Bowtie38.
To profile transcriptional responses to V. cholerae, all cDNA reads that mapped to the genomes of the 14 consortium members were binned based on enzyme classification (EC) level annotations from KEGG. ShotgunFunctionalizeR39 was then used compare the fecal meta-transcriptomes of “D14invasion" animals sampled 4 days after gavage of the 14-member community to the fecal meta-transcriptomes of "D1invasion" mice sampled 4 days after gavage of the 14-member community plus V. cholerae. A mean two-fold or greater difference in expression between the conditions, with an adjusted p-value less than 0.0001 (ShotgunFunctionalizeR) was considered significant. This approach of binning to ECs mitigates issues with low-abundance transcripts being insufficiently profiled due to limitations in sequencing depth8.
Due to the higher sequencing depth achieved for R. obeum and V. cholerae in mono- and co-colonization experiments, reads were mapped to reference genomes using Bowtie and changes at the single transcript level were analyzed using DESeq40 (Supplementary Table 11). Transcripts that satisfied the criteria of (i) having >2 fold differential expression after DESeq normalization, (ii) an adjusted P-value <0.05, and (iii) a minimum mean count value >10 were retained.
AI-2 assays
Previously frozen fecal pellets from gnotobiotic mice were resuspended in AB medium24 by agitation with a rotary bead-beater (25 mg fecal pellet/mL medium). AI-2 assays were performed using the V. harveyi BB170 bioassay strain24, with reported results representative of at least two independent experiments, each with five technical repeats. V. harveyi BB170 cultures were grown aerobically overnight in AB medium, and diluted 1:500 in this medium for use in the AI-2 bioassay24. Luminescence was measured using a BioTek Synergy 2 instrument after 4h of growth at 30°C with agitation (300 rpm using a rotatory incubator).
For in vitro measurements of R. obeum AI-2 production, a 100µL aliquot from an overnight monoculture of the bacterium grown in MegaMedium without glucose was diluted 1:20 in fresh MegaMedium without glucose. In addition, cells pelleted from 100µL of an overnight culture of V. cholerae ΔluxS (MM88314) grown in LB medium were added to R. obeum that had also been diluted 1:20 in MegaMedium without glucose. The resulting mono- and co-cultures were incubated anaerobically at 37°C for 16 h. Cells were pelleted by centrifugation, and supernatants were harvested and then added to V. harveyi BB170 cultures for AI-2 bioassay.
Ultra-performance liquid chromatography mass spectrometry (UPLC-MS)
Procedures for UPLC-MS of bile acids are described in a recent publication37.
Extended Data
Extended Data Figure 1. Experimental designs for clinical study and gnotobiotic mouse experiments.
(a) Sampling schedule for human cholera study. (b) Frequency of diarrheal episodes over time for representative participant (subject A). Initial time (black circle) represents beginning of diarrhea. The long vertical line marks enrollment into the study. Colors and short vertical lines denote boundaries of study phases defined in panel a. (c–e) Gnotobiotic mouse experimental design. The number (n) of animals in each treatment group is shown.
Extended Data Figure 2. Bacterial taxa associated with diarrheal and recovery phase.
(a) Proportion of bacterial species-level taxa that were observed in both diarrhea and recovery phases, in D-Ph1 to D-Ph4 only, and in R-Ph1 to R-Ph3 only. Mean values ± SEM are plotted. *, P<0.05, ***, P<0.001 (unpaired Mann-Whitney test). (b) Phylum level analysis. Mean values are plotted. (c) Proportion of study participants having bacterial taxa associated by indicator species analysis with the diarrhea or recovery phase. The x-axis shows species associated with each phase, ranked by proportion of subjects harboring that species. For each species, ‘representation in study participants’ is the average presence/absence of all 97%-identity OTUs with that species taxonomic assignment. The OTU table was rarefied to 49,000 reads per sample. (d) Shown are bacterial species identified by indicator analysis as indicative of diarrhea or recovery phases in adult cholera patients, and species identified by Random Forests analysis as discriminatory for different stages in the maturation of the gut microbiota of healthy Bangladesh infants/children aged 1–24 months (denoted by the symbol †). The heatmap in the left hand portion of the panel shows mean relative abundances of species across all individuals during D-Ph1 to D-Ph4, with each phase subdivided into four equal time bins. For recovery timepoints, columns represent the mean relative abundances for each sampling timepoint during R-Ph1 to R-Ph3. Mean relative abundance values are also presented for these same species in the fecal microbiota of 50 healthy Bangladeshi children sampled from 1–2 years of age at monthly intervals. Unsupervised hierarchical clustering was performed based on relative abundances of species in the fecal microbiota of the patients with cholera. The green portion of the tree encompasses species that are more abundant during recovery while the red portion encompasses species that are more abundant during diarrhea. Indicator scores are presented in the right hand portion of the panel, with ‘score’ for a given taxon defined as its indicator value for recovery minus its indicator value for diarrhea (−1, highly diarrhea-associated; +1, highly recovery associated). Spearman rank correlation coefficients of mean species relative abundance by sample in the cholera study versus mean sample weighted UniFrac distance to healthy adult fecal microbiota are shown at the extreme right together with the statistical significance of correlations after Benjamini-Hochberg FDR correction for multiple hypothesis testing (n.s., not significant; *, P<0.05; **, P<0.01; ***, P<0.001). Higher coefficients indicate increasing divergence from a healthy configuration with higher relative abundance of a given species. Species shown satisfied two or more of the following criteria: (i) presence among the list of the top 40 age-discriminatory species in the Random Forests-based model of microbiota maturation in healthy infants and children; (ii) indicator value score >0.7; (iii) significant correlation (Spearman r) between relative abundance in the microbiota of cholera patients and UniFrac distance to healthy adult microbiota; and (iv) were included in the artificial 14-member human gut community (species name highlighted in blue).
Extended Data Figure 3. 97%-identity OTUs observed in both diarrhea and recovery phases.
The proportion of 97%-identity OTUs with a given species-level taxonomic assignment that were present in both diarrhea and recovery phases is shown for each individual in the study. The number of 97%-identity OTUs with a given species assignment is shown in parentheses. Species are ordered based on their indicator scores (indicator valuerecovery minus indicator valuediarrhea). Age-discriminatory bacterial species incorporated into a Random Forests-based model5 for defining relative microbiota maturity and microbiota-for-age Z scores3 in healthy Bangladeshi infants and children are marked with a “+”. 97%-identity OTUs were derived from datasets generated from all adult cholera patient samples; the OTU table was rarefied to 49,000 reads per sample.
Extended Data Figure 4. Pattern of appearance of age-discriminatory 97%-identity OTUs in the fecal microbiota of patients with cholera mirrors the normal age-dependent pattern in the fecal microbiota of healthy Bangladeshi infants and children.
(a) Left portion of panel shows hierarchical clustering of relative abundance values for each of the top 60 most age-discriminatory 97%-identity OTUs in a Random Forests-based model of normal maturation of the microbiota in healthy Bangladeshi infants/children (importance scores for the age-discriminatory taxa defined by Random Forests analysis are reported in ref. 3; these 60 97%-identity OTUs can be grouped into 40 species-level taxa). Right portion of panel presents the mean relative abundances of these OTUs in samples obtained from cholera patients during D-Ph1 to D-Ph4, and R-Ph1 to R-Ph3. 97%-identity OTUs corresponding to species included in the artificial community that was introduced into gnotobiotic mice are highlighted in blue. (b) Relative abundance of R. obeum species in the fecal microbiota of healthy Bangladeshi children sampled monthly through the first three years of life. Mean values±SEM are plotted.
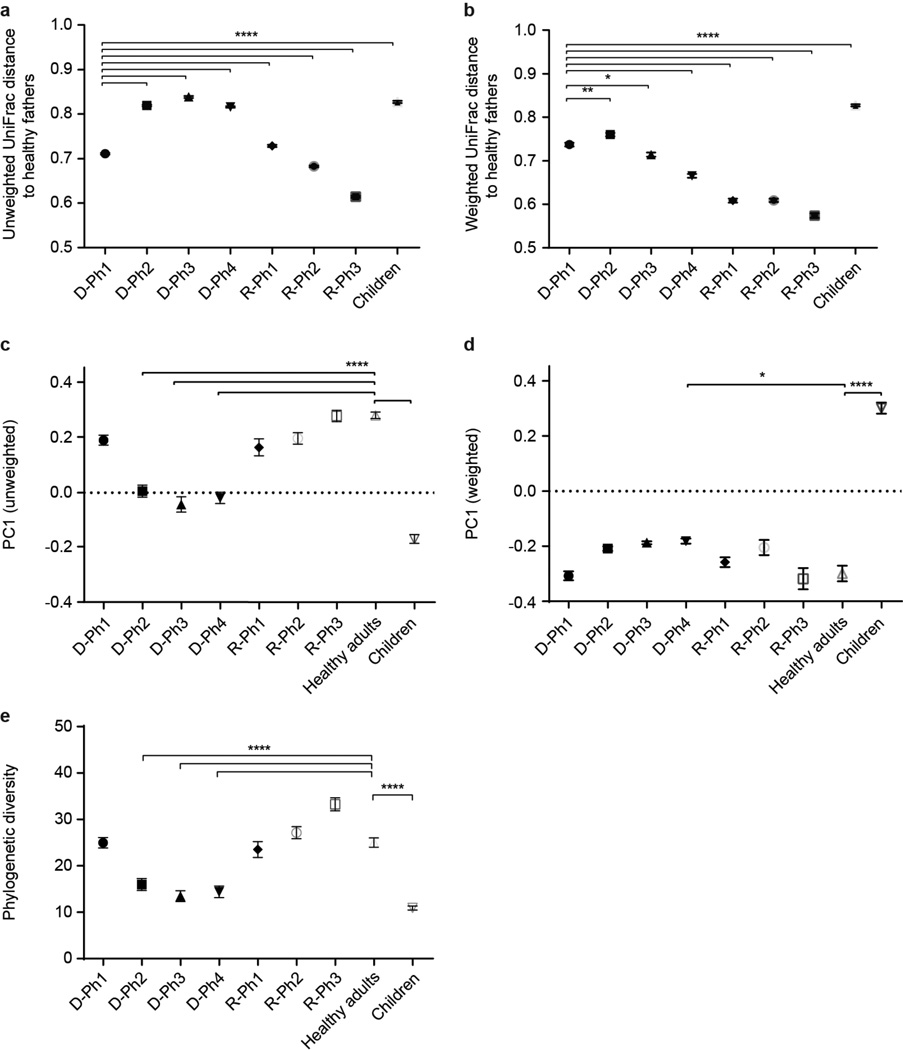
Extended Data Figure 5. Pattern of recovery of the gut microbiota of cholera patients.
(a,b) Mean unweighted (a) and weighted (b) UniFrac distances to healthy adult controls at each of the defined phases of diarrhea and recovery. (c,d) Principal coordinates analysis (PCoA) of UniFrac distances between gut microbiota samples. Location along the principal axis of variation (PC1) shows how acute diarrheal communities first resemble those of healthy Bangladeshi children sampled during the first two years of life, then evolve their phylogenetic configurations during the recovery phase towards those of healthy Bangladeshi adults. PC1 accounts for 34.3% variation for weighted and 17.7% variation for unweighted UniFrac values. (e) Alpha diversity (whole-tree phylogenetic diversity) measurements of fecal microbial communities through all study phases. Mean values±SEM are plotted. *, P<0.05, **, P<0.01, ****, P<0.0001 (Kruskal-Wallis ANOVA followed by multiple comparisons test).
Extended Data Figure 6. Proportional representation of genes encoding ECs in fecal microbiomes sampled during the diarrheal and recovery phases of cholera.
Shotgun sequencing of fecal community DNA was performed [MiSeq 2000 instrument; 2×250bp paired-end reads; 341,701±145,681 reads (mean ± SD/sample)]. Read pairs were assembled (SHERA software package34). Read counts were collapsed based on their assignment to Enzyme Commissions number identifiers (ECs). The significance of differences in EC abundances compared to fecal microbiomes in healthy adult Bangladeshi controls was defined using ShotgunFunctionalizeR39. Unsupervised hierarchical clustering identifies groups of ECs that characterize the fecal microbiomes of cholera patients at varying phases of diarrhea and recovery. The heatmap on the left shows the results of EC clustering by phase (diarrhea/recovery). An asterisk on the extreme right of the figure indicates that EC abundance differences observed across the specified study phases were statistically significant (adjusted P<0.00001, ShotgunFunctionalizeR). The heatmap on the right presents the results of a global clustering of all time-points and study phases. 102 ECs were identified with (i) at least 0.1% average relative abundance across the study, and (ii) significant differences in their representation relative to healthy microbiomes in at least one comparison (adjusted P<0.00001 based on ShotgunFunctionalizeR). In each of the heatmaps, Z-scores for each EC across all samples are plotted. ECs are grouped by KEGG Level 1 assignment and further annotated based on their KEGG Pathway assignments. A ‘+’ indicates that the EC has additional KEGG Level 2 annotations (see Supplementary Table 8 for a list of all assignable functional annotations). Note that the majority of the 46 ECs that were more abundant during diarrhea phases in study participants are related to carbohydrate metabolism. The fecal microbiomes of patients during recovery are enriched for genes involved in vitamin and co-factor metabolism (Supplementary Table 8).
Extended Data Figure 7. R. obeum encodes a functional AI-2 system and R. obeum AI-2 production is stimulated by the presence of V. cholerae.
(a) Relative abundances of R. obeum and V. cholerae in the fecal microbiota after introduction of V. cholerae into mice harboring the artificial 14-member human gut community (D14invasion group, see Extended Data Figure 1c). ‘Days post gavage’ refers to the second of two daily gavages of 109 CFU V. cholerae into animals that had been colonized 14 days earlier with the 14-member community. Mean values±SEM are shown (n=4–5 mice, *, P<0.05, unpaired Student’s test). (b) Left portion of the panel shows AI-2 signaling pathway components represented in the R. obeum genome (left panel). Right portion plots changes in expression of these components as defined by microbial RNA-Seq of fecal microbiota samples obtained (i) 4 days after colonization of mice with the 14-member community and (ii) 4 days after gavage of mice with the 14-member community together with 109 CFU of V. cholerae (n=4–6 animals/group; one fecal sample analyzed/animal). Mean values±SEM are shown. *, P<0.05 (Mann-Whitney U test). (c) RNA-Seq of fecal samples collected at the time points and treatment groups indicated reveals that R. obeum luxS transcription is directly correlated to V. cholerae abundance in the context of the 14-member community. **P<0.01 (F test) (d) R. obeum luxS expression. Mice were colonized first with R. obeum for 7 day. Fecal samples were collected for microbial RNA-Seq analysis 1 day prior to gavage of 109 CFU of a V. cholerae ΔluxS mutant, and then 2 days post-gavage (d2pg). Mean values for relative R. obeum luxS transcript levels (±SEM) are shown (n=5–6 animals/group/experiment, n=3 independent experiments; **, P<0.01 unpaired Mann-Whitney U test). (e) AI-2 levels in fecal samples taken 1 day prior to and 3 days after gavage of the V. cholerae ΔluxS from the same mice as those analyzed in panel a. AI-2 levels were measured based on induction of bioluminescence in V. harveyi BB170 using the same mass of input fecal sample for all assays. Mean values±SEM are shown; ****, P<0.0001 (unpaired Mann-Whitney U test) (f) R. obeum produces AI-2 when co-cultured with V. cholerae in vitro. Aliquots of the supernatant from cultures containing R. obeum alone, or R. obeum plus the V. cholerae ΔluxS mutant were assayed for their ability to induce V. harveyi bioluminescence. Mean values±SEM are presented (n=4 independent experiments). ****, P<0.0001 (unpaired Mann-Whitney U test). Note that (i) the number of R. obeum CFUs present in the samples obtained from mono-cultures of the organism was similar to the number in co-culture, as measured by selective plating, and (ii) the V. cholerae ΔluxS mutant cultured alone produced levels of AI-2 signal that were not significantly different from that of R. obeum in mono-culture (data not shown).
Extended Data Figure 8. UPLC-MS analysis of fecal bile acid profiles in gnotobiotic mice.
Targeted UPLC-MS was performed using methanol extracts of fecal pellets obtained from age-and gender-matched germ-free C57BL/6J mice and gnotobiotic mice colonized for 3 days with R. obeum alone, for 7d with the 14-member community (‘D1invasion group’), and for 3 days with the 13-member community that lacked R. obeum (n=4–6 mice/treatment group; one fecal sample analyzed/animal). (a) Fecal levels of taurocholic acid. Mean values±SEM are plotted. *, P<0.05, **, P<0.01, Mann-Whitney U test. (b) Mean relative abundance of 10 bile acid species in fecal samples obtained from the mice shown in panel (a).
Extended Data Figure 9. Phylogenetic tree of luxS genes present in human gut bacterial symbionts and enteropathogens.
The tree was constructed from amino acid sequence alignments using Clustal X49. Red indicates that the homolog is represented in the genomes of members of the 14-member artificial human gut bacterial community.
Extended Data Figure 10. In vivo tests of the effects of known quorum-sensing components on R. obeum-mediated reductions in V. cholerae colonization.
(a) Competitive index of ΔluxP versus wild-type C6706 V. cholerae when colonized with or without R. obeum (n=4–6 animals/group). Horizontal bars represent mean values. Data from individual animals are show using the indicated symbols. (b) Transcript abundance (RPKM) for selected quorum sensing and virulence gene regulators in V. cholerae. Microbial RNA-Seq was performed on fecal samples collected 2 days after mono-colonization of germ-free mice with V. cholerae (circles), or 2 days after V. cholerae was introduced into mice that had been mono-colonized for 7 days with R. obeum (squares). n=5 animals/group. n.s, not significant (P≥0.05); **, P<0.01, ***, P<0.001, ****, P<0.0001 (unpaired two-tailed Student’s t-test).
Supplementary Material
Acknowledgments
We thank Sabrina Wagoner, Jessica Hoisington-López Marty Meier, Jiye Cheng, Dave O'Donnell, and Maria Karlsson for superb technical support, Jun Zhu (Univ. of Pennsylvania) for generously providing strains of V. cholerae and V. harveyi, and Wai-Leung Ng (Tufts University) for providing ΔluxP V. cholerae. This work was supported by a grant from the Bill & Melinda Gates Foundation. The singleton birth cohort of Bangladeshi children was supported by a grant from the National Institutes of Health (AI 43596). icddr,b acknowledges the following donors which provided unrestricted support: Australian Agency for International Development (AusAID), Government of the People’s Republic of Bangladesh, Canadian International Development Agency (CIDA), Swedish International Development Cooperation Agency (Sida), and the Department for International Development, UK (DFID).
Footnotes
Author contributions: A.H. and J.I.G. designed the metagenomic and gnotobiotic mouse study, A.M.S.A, R.H, and T.A. designed and implemented the clinical study, participated in patient recruitment, sample collection, sample preservation and clinical evaluations; R.H and W.A.P. participated in recruitment of and sample collection from healthy Bangladeshi controls; A.H. generated the 16S rRNA, AI-2, RNA-Seq, shotgun microbial community DNA sequencing, and V. cholerae colonization data. S.S. generated 16S rRNA data from extended sampling of the Bangladeshi singleton birth cohort. L.L.D. performed 16S rRNA sequencing of the additional samples from subjects C and E and helped generate the colonization data in in vivo competition experiments involving isogenic wild-type, ΔvqmA and ΔluxP strains of V. cholerae C6706; A.H., S.S., N.W.G., and J.I.G. analyzed the data; A.H. and J.I.G. wrote the paper.
All 16S rRNA, shotgun sequencing, and RNA-Seq datasets generated from fecal samples have been deposited at the European Nucleotide Archive in raw format prior to post-processing and data analysis (ENA Study Accession number PRJEB6358).
REFERENCES
- 1.WHO. Cholera, 2011. Weekly Epidemiological Record. 2012;87:289–304. [Google Scholar]
- 2.Chowdhury F, et al. Impact of rapid urbanization on the rates of infection by Vibrio cholerae O1 and enterotoxigenic Escherichia coli in Dhaka, Bangladesh. PLoS Neglected Tropical Dis. 2011;5:e999. doi: 10.1371/journal.pntd.0000999. [DOI] [PMC free article] [PubMed] [Google Scholar]
- 3.Subramanian S, et al. Persistent Gut Microbiota Immaturity in Malnourished Bangladeshi Children. Nature. 2014 doi: 10.1038/nature13421. [DOI] [PMC free article] [PubMed] [Google Scholar]
- 4.Dufrene M, Legendre P. Species assemblages and indicator species: The need for a flexible asymmetrical approach. Ecol. Monographs. 1997;67:345–366. [Google Scholar]
- 5.Lozupone C, Knight R. UniFrac: a new phylogenetic method for comparing microbial communities. Applied Environ. Microbiol. 2005;71:8228–8235. doi: 10.1128/AEM.71.12.8228-8235.2005. [DOI] [PMC free article] [PubMed] [Google Scholar]
- 6.Martens EC, et al. Recognition and degradation of plant cell wall polysaccharides by two human gut symbionts. PLoS Biology. 2011;9:e1001221. doi: 10.1371/journal.pbio.1001221. [DOI] [PMC free article] [PubMed] [Google Scholar]
- 7.McNulty NP, et al. Effects of Diet on Resource Utilization by a Model Human Gut Microbiota Containing Bacteroides cellulosilyticus WH2, a Symbiont with an Extensive Glycobiome. PLoS Biology. 2013;11:e1001637. doi: 10.1371/journal.pbio.1001637. [DOI] [PMC free article] [PubMed] [Google Scholar]
- 8.McNulty NP, et al. The Impact of a Consortium of Fermented Milk Strains on the Gut Microbiome of Gnotobiotic Mice and Monozygotic Twins. Science Translational Med. 2011;3:106ra106. doi: 10.1126/scitranslmed.3002701. [DOI] [PMC free article] [PubMed] [Google Scholar]
- 9.Taylor RK, Miller VL, Furlong DB, Mekalanos JJ. Use of phoA gene fusions to identify a pilus colonization factor coordinately regulated with cholera toxin. Proc. Natl. Acad. Sci. USA. 1987;84:2833–2837. doi: 10.1073/pnas.84.9.2833. [DOI] [PMC free article] [PubMed] [Google Scholar]
- 10.Herrington DA, et al. Toxin, toxin-coregulated pili, and the toxR regulon are essential for Vibrio cholerae pathogenesis in humans. J. Exp. Med. 1988;168:1487–1492. doi: 10.1084/jem.168.4.1487. [DOI] [PMC free article] [PubMed] [Google Scholar]
- 11.Olivier V, Salzman NH, Satchell KJ. Prolonged colonization of mice by Vibrio cholerae El Tor O1 depends on accessory toxins. Infect. Immun. 2007;75:5043–5051. doi: 10.1128/IAI.00508-07. [DOI] [PMC free article] [PubMed] [Google Scholar]
- 12.Olivier V, Haines GK, 3rd, Tan Y, Satchell KJ. Hemolysin and the multifunctional autoprocessing RTX toxin are virulence factors during intestinal infection of mice with Vibrio cholerae El Tor O1 strains. Infect. Immun. 2007;75:5035–5042. doi: 10.1128/IAI.00506-07. [DOI] [PMC free article] [PubMed] [Google Scholar]
- 13.Yang M, et al. Bile salt-induced intermolecular disulfide bond formation activates Vibrio cholerae virulence. Proc. Natl. Acad. Sci. USA. 2013;110:2348–2353. doi: 10.1073/pnas.1218039110. [DOI] [PMC free article] [PubMed] [Google Scholar]
- 14.Miller MB, Skorupski K, Lenz DH, Taylor RK, Bassler BL. Parallel quorum sensing systems converge to regulate virulence in Vibrio cholerae. Cell. 2002;110:303–314. doi: 10.1016/s0092-8674(02)00829-2. [DOI] [PubMed] [Google Scholar]
- 15.Zhu J, et al. Quorum-sensing regulators control virulence gene expression in Vibrio cholerae. Proc. Natl. Acad. Sci. USA. 2002;99:3129–3134. doi: 10.1073/pnas.052694299. [DOI] [PMC free article] [PubMed] [Google Scholar]
- 16.Kovacikova G, Skorupski K. Regulation of virulence gene expression in Vibrio cholerae by quorum sensing: HapR functions at the aphA promoter. Mol. Microbiol. 2002;46:1135–1147. doi: 10.1046/j.1365-2958.2002.03229.x. [DOI] [PubMed] [Google Scholar]
- 17.Higgins DA, et al. The major Vibrio cholerae autoinducer and its role in virulence factor production. Nature. 2007;450:883–886. doi: 10.1038/nature06284. [DOI] [PubMed] [Google Scholar]
- 18.Pereira CS, Thompson JA, Xavier KB. AI-2-mediated signalling in bacteria. FEMS Microbiology Rev. 2013;37:156–181. doi: 10.1111/j.1574-6976.2012.00345.x. [DOI] [PubMed] [Google Scholar]
- 19.Sun J, Daniel R, Wagner-Dobler I, Zeng AP. Is autoinducer-2 a universal signal for interspecies communication: a comparative genomic and phylogenetic analysis of the synthesis and signal transduction pathways. BMC Evol. Biol. 2004;4:36. doi: 10.1186/1471-2148-4-36. [DOI] [PMC free article] [PubMed] [Google Scholar]
- 20.Duan F, March JC. Engineered bacterial communication prevents Vibrio cholerae virulence in an infant mouse model. Proc. Natl. Acad. Sci. USA. 2010;107:11260–11264. doi: 10.1073/pnas.1001294107. [DOI] [PMC free article] [PubMed] [Google Scholar]
- 21.Liu Z, et al. Mucosal penetration primes Vibrio cholerae for host colonization by repressing quorum sensing. Proc. Natl. Acad. Sci. USA. 2008;105:9769–9774. doi: 10.1073/pnas.0802241105. [DOI] [PMC free article] [PubMed] [Google Scholar]
- 22.Liu Z, Stirling FR, Zhu J. Temporal quorum-sensing induction regulates Vibrio cholerae biofilm architecture. Infect Immun. 2007;75:122–126. doi: 10.1128/IAI.01190-06. [DOI] [PMC free article] [PubMed] [Google Scholar]
- 23.Taga ME, Semmelhack JL, Bassler BL. The LuxS-dependent autoinducer AI-2 controls the expression of an ABC transporter that functions in AI-2 uptake in Salmonella typhimurium. Mol. Microbiol. 2001;42:777–793. doi: 10.1046/j.1365-2958.2001.02669.x. [DOI] [PubMed] [Google Scholar]
- 24.Bassler BL, Wright M, Silverman MR. Multiple signalling systems controlling expression of luminescence in Vibrio harveyi: sequence and function of genes encoding a second sensory pathway. Mol. Microbiol. 1994;13:273–286. doi: 10.1111/j.1365-2958.1994.tb00422.x. [DOI] [PubMed] [Google Scholar]
- 25.Surette MG, Miller MB, Bassler BL. Quorum sensing in Escherichia coli, Salmonella typhimurium, and Vibrio harveyi: A new family of genes responsible for autoinducer production. Proc. Natl. Acad. Sci. USA. 1999;96:1639–1644. doi: 10.1073/pnas.96.4.1639. [DOI] [PMC free article] [PubMed] [Google Scholar]
- 26.Iwanaga M, et al. Culture conditions for stimulating cholera toxin production by Vibrio cholerae O1 El Tor. Microbiol. Immunol. 1986;30:1075–1083. doi: 10.1111/j.1348-0421.1986.tb03037.x. [DOI] [PubMed] [Google Scholar]
- 27.Liu Z, Hsiao A, Joelsson A, Zhu J. The transcriptional regulator VqmA increases expression of the quorum-sensing activator HapR in Vibrio cholerae. J. Bacteriol. 2006;188:2446–2453. doi: 10.1128/JB.188.7.2446-2453.2006. [DOI] [PMC free article] [PubMed] [Google Scholar]
REFERENCES FOR ONLINE METHODS AND SUPPLEMENTARY INFORMATION
- 28.Faiz MA, Basher A. Antimicrobial resistance: Bangladesh experience. Regional Health Forum. 2011;15:1–18. [Google Scholar]
- 29.Morgan DJ, Okeke IN, Laxminarayan R, Perencevich EN, Weisenberg S. Non-prescription antimicrobial use worldwide: a systematic review. The Lancet Infectious Diseases. 2011;11:692–701. doi: 10.1016/S1473-3099(11)70054-8. [DOI] [PMC free article] [PubMed] [Google Scholar]
- 30.Yatsunenko T, et al. Human gut microbiome viewed across age and geography. Nature. 2012;486:222–227. doi: 10.1038/nature11053. [DOI] [PMC free article] [PubMed] [Google Scholar]
- 31.Caporaso JG, et al. QIIME allows analysis of high-throughput community sequencing data. Nature Methods. 2010;7:335–336. doi: 10.1038/nmeth.f.303. [DOI] [PMC free article] [PubMed] [Google Scholar]
- 32.Cole JR, et al. The ribosomal database project (RDP-II): introducing myRDP space and quality controlled public data. Nucleic Acids Res. 2007;35:D169–D172. doi: 10.1093/nar/gkl889. [DOI] [PMC free article] [PubMed] [Google Scholar]
- 33.DeSantis TZ, et al. Greengenes, a chimera-checked 16S rRNA gene database and workbench compatible with ARB. Applied Environ. Microbiol. 2006;72:5069–5072. doi: 10.1128/AEM.03006-05. [DOI] [PMC free article] [PubMed] [Google Scholar]
- 34.Rodrigue S, et al. Unlocking short read sequencing for metagenomics. PloS One. 2010;5:e11840. doi: 10.1371/journal.pone.0011840. [DOI] [PMC free article] [PubMed] [Google Scholar]
- 35.Kanehisa M, Goto S. KEGG: kyoto encyclopedia of genes and genomes. Nucleic Acids Res. 2000;28:27–30. doi: 10.1093/nar/28.1.27. [DOI] [PMC free article] [PubMed] [Google Scholar]
- 36.Edgar RC. Search and clustering orders of magnitude faster than BLAST. Bioinformatics. 2010;26:2460–2461. doi: 10.1093/bioinformatics/btq461. [DOI] [PubMed] [Google Scholar]
- 37.Ridaura VK, et al. Gut microbiota from twins discordant for obesity modulate metabolism in mice. Science. 2013;341:1241214. doi: 10.1126/science.1241214. [DOI] [PMC free article] [PubMed] [Google Scholar]
- 38.Langmead B, Trapnell C, Pop M, Salzberg SL. Ultrafast and memory-efficient alignment of short DNA sequences to the human genome. Genome Biol. 2009;10:R25. doi: 10.1186/gb-2009-10-3-r25. [DOI] [PMC free article] [PubMed] [Google Scholar]
- 39.Kristiansson E, Hugenholtz P, Dalevi D. ShotgunFunctionalizeR: an R-package for functional comparison of metagenomes. Bioinformatics. 2009;25:2737–2738. doi: 10.1093/bioinformatics/btp508. [DOI] [PubMed] [Google Scholar]
- 40.Anders S, Huber W. Differential expression analysis for sequence count data. Genome Biol. 2010;11:R106. doi: 10.1186/gb-2010-11-10-r106. [DOI] [PMC free article] [PubMed] [Google Scholar]
- 41.Schauder S, Shokat K, Surette MG, Bassler BL. The LuxS family of bacterial autoinducers: biosynthesis of a novel quorum-sensing signal molecule. Mol. Microbiol. 2001;41:463–476. doi: 10.1046/j.1365-2958.2001.02532.x. [DOI] [PubMed] [Google Scholar]
- 42.Walters M, Sircili MP, Sperandio V. AI-3 synthesis is not dependent on luxS in Escherichia coli. J. Bacteriol. 2006;188:5668–5681. doi: 10.1128/JB.00648-06. doi:10.1007/s12223-008-0030-1 (2008). [DOI] [PMC free article] [PubMed] [Google Scholar]
- 43.Miller VL, DiRita VJ, Mekalanos JJ. Identification of toxS, a regulatory gene whose product enhances toxR-mediated activation of the cholera toxin promoter. J. Bacteriol. 1989;171:1288–1293. doi: 10.1128/jb.171.3.1288-1293.1989. [DOI] [PMC free article] [PubMed] [Google Scholar]
- 44.Higgins DE, Nazareno E, DiRita VJ. The virulence gene activator ToxT from Vibrio cholerae is a member of the AraC family of transcriptional activators. J. Bacteriol. 1992;174:6974–6980. doi: 10.1128/jb.174.21.6974-6980.1992. [DOI] [PMC free article] [PubMed] [Google Scholar]
- 45.DiRita VJ. Co-ordinate expression of virulence genes by ToxR in Vibrio cholerae. Mol. Microbiol. 1992;6:451–458. doi: 10.1111/j.1365-2958.1992.tb01489.x. [DOI] [PubMed] [Google Scholar]
- 46.Higgins DE, DiRita VJ. Transcriptional control of toxT, a regulatory gene in the ToxR regulon of Vibrio cholerae. Mol. Microbiol. 1994;14:17–29. doi: 10.1111/j.1365-2958.1994.tb01263.x. [DOI] [PubMed] [Google Scholar]
- 47.Lee SH, Hava DL, Waldor MK, Camilli A. Regulation and temporal expression patterns of Vibrio cholerae virulence genes during infection. Cell. 1999;99:625–634. doi: 10.1016/s0092-8674(00)81551-2. [DOI] [PubMed] [Google Scholar]
- 48.Hsiao A, Liu Z, Joelsson A, Zhu J. Vibrio cholerae virulence regulator-coordinated evasion of host immunity. Proc. Natl. Acad. Sci. USA. 2006;103:14542–14547. doi: 10.1073/pnas.0604650103. [DOI] [PMC free article] [PubMed] [Google Scholar]
- 49.Larkin MA, et al. Clustal W and Clustal X version 2.0. Bioinformatics. 2007;21:2947–2948. doi: 10.1093/bioinformatics/btm404. [DOI] [PubMed] [Google Scholar]
- 50.Eckburg PB, et al. Diversity of the human intestinal microbial flora. Science. 2005;308:1635–1638. doi: 10.1126/science.1110591. [DOI] [PMC free article] [PubMed] [Google Scholar]
Associated Data
This section collects any data citations, data availability statements, or supplementary materials included in this article.


