

Abstract
Objectives
Benzene is a widely recognised cause of leukaemia but its association with non-Hodgkin’s lymphoma (NHL) is less well established. The goal of this project is to review the current published literature on this association.
Methods
We performed a meta-analysis of cohort and case-control studies of benzene exposure and NHL and a meta-analysis of NHL and refinery work, a potential source of benzene exposure.
Results
In 22 studies of benzene exposure, the summary relative risk for NHL was 1.22 (95% CI 1.02 to 1.47; one-sided p value = 0.01). When studies that likely included unexposed subjects in the “exposed” group were excluded, the summary relative risk increased to 1.49 (95% CI 1.12 to 1.97, n = 13), and when studies based solely on self-reported work history were excluded, the relative risk rose to 2.12 (95% CI 1.11 to 4.02, n = 6). In refinery workers, the summary relative risk for NHL in all 21 studies was 1.21 (95% CI 1.00 to 1.46; p = 0.02). When adjusted for the healthy worker effect, this relative risk estimate increased to 1.42 (95% CI 1.19 to 1.69).
Conclusions
The finding of elevated relative risks in studies of both benzene exposure and refinery work provides further evidence that benzene exposure causes NHL. In addition, the finding of increased relative risks after removing studies that included unexposed or lesser exposed workers in “exposed” cohorts, and increased relative risk estimates after adjusting for the healthy worker effect, suggest that effects of benzene on NHL might be missed in occupational studies if these biases are not accounted for.
Annual production of benzene in the USA is over 2 billion gallons and millions of people are exposed to benzene either occupationally through a variety of different industrial processes or environmentally from cigarette smoke, gasoline or automobile emissions. Benzene is a widely recognised cause of leukaemia, particularly acute non-lymphocytic leukaemia (ANLL), but its association with non-Hodgkin’s lymphoma (NHL) is less well established.
Previous epidemiological studies on the association between benzene and NHL have produced mixed results. For example, in a cohort study of 74 828 benzene-exposed workers from multiple industries in China, Hayes et al reported a relative risk of 4.7 (95% CI 1.2 to 18.1) for NHL.1 In contrast, Sorahan et al reported a relative risk of 1.00 (95% CI 0.64 to 1.49) for NHL in a cohort study of benzene-exposed workers in England and Wales.2 The reasons for these discrepancies are not entirely clear but could be related to differences in study populations, exposure levels and study designs. It could also be related to low statistical power or the presence of particular biases which may have limited the ability of some studies to identify real effects. In particular, biases resulting from the healthy worker effect, from inaccurate classification of exposure, and from inadequate study power can bias relative risk estimates towards the null and lead to true associations being missed.
In a previous publication, we assessed some of the evidence relating to benzene and NHL in a systematic review in which problems of bias due to the health worker effect were noted.3 In this paper we present a formal meta-analysis of studies of NHL and occupational exposure to benzene in work settings other than refineries, and a formal meta-analysis of NHL and refinery work, a setting that has historically been associated with benzene exposure.4 These were done separately since refinery work can be associated with many chemical exposures other than benzene. Two previous meta-analyses done on these topics did not find increased NHL risks with benzene exposure or refinery work.5,6 However, our meta-analysis differs from these prior reports in that we objectively evaluate the impact of the healthy worker effect and exposure misclassification (in particular, the inclusion of unexposed or lesser exposed workers in “exposed” cohorts) and incorporate the results of these evaluations directly into our overall summary relative risk estimates. As we show in this report, the incorporation of these factors can have important implications in the evaluation of a causal link between benzene and NHL.
METHODS
Databases including Medline were searched for all epidemiological studies on NHL and benzene exposure or refinery work. Searches included combinations of the keywords: NHL, lymphosarcoma, reticulosarcoma, cancer, benzene, solvents, refinery, and petroleum industry. The bibliographies of all relevant articles as well as relevant review articles were also searched. The results of these searches are reviewed in Smith et al.3
The meta-analysis of benzene exposure and NHL includes case-control and cohort studies that provided relative risk estimates specifically for benzene exposure. Only data published in scientific journals were used. Studies which reported relative risks only by job type (eg, shoe maker) or industry (eg, rubber manufacturing) without specific identification of those exposed to benzene were not included in the benzene–NHL meta-analysis. Studies that reported relative risks for many different solvent exposures combined and studies reporting only relative risk estimates for NHL combined with other cancer types were also not included. Many studies, especially older ones, presented results only for lymphosarcoma and reticulosarcoma combined. These were included in the analysis since these cancers compromise a major sub-classification of NHL. A few studies presented separate results for both NHL and lymphosarcoma and reticulosarcoma. For these studies, the results for NHL were used.
In most studies, relative risks were given for several different metrics of benzene exposure including cumulative exposure, average exposure intensity, peak exposure, exposure duration, and time since first exposure. When this occurred we chose a single relative risk selected in the following order: average exposure intensity, cumulative exposure, and exposure duration. Table 1 shows the selection criteria used for this meta-analysis. Several studies also reported relative risks for different levels of exposure (ie, high, medium, low). Simple cause and effect associations are best initially evaluated in groups with high exposure since relative risks are likely to be further away from 1.0 when exposures are high than when they are low. Higher relative risks are less likely to be subject to type II bias (ie, inadequate study power) since all else being equal, study power is greater when relative risks are higher. Higher relative risks are also less likely to be due to confounding or some other undetected bias.7 For these reasons, and because our focus was on evaluating causal inference rather than exact dose–response relationships, we selected the relative risk for the highest exposure category from each study.
Table 1.
Order of selection of relative risk estimates from the individual studies when more than one relative risk is given
| Benzene and NHL meta-analysis | Refinery work and NHL meta-analysis |
|---|---|
| 1. Exposure intensity | 1. Duration worked |
| 2. Cumulative exposure | 2. Years since first hire |
| 3. Duration of exposure | 3. Exposed job category |
| 4. Any benzene exposure | 4. Any refinery work |
NHL, non-Hodgkin’s lymphoma.
The highest categories of exposure were defined differently from study to study. For example, in Hayes et al the highest exposure category included only those workers with estimated average exposures greater than 25 ppm,1 while in Rinsky et al the highest exposure group was defined as those with exposures greater than 1 ppm-day.8 If a true association exists, combining relative risks from studies of highly exposed workers with those of studies including lesser exposed workers can drive summary relative risk estimates towards 1.0. As such, we performed a separate subgroup analysis that only included studies providing relative risks for workers that were most likely to be highly exposed. A single definition of high exposure could not be identified since studies used different exposure metrics. Because of this, we performed one analysis (labelled “high exposure”) in which we excluded all studies comparing a non-exposed group to a group with “any benzene exposure” and excluding the study by Rinsky et al (2002) which had a very low cut-off point for defining exposed workers (1 ppm-day). In an additional subgroup analysis (labelled “high exposure, no self reported data”) we included only those “high exposure” studies where some industrial hygiene measurement data were used to assess exposure. In this analysis, we excluded studies where benzene exposure was based solely on workers’ self-reports.
In some instances, the highest exposure category for the selected exposure metric had no cases. In these instances, the next highest exposure category or highest exposure category for the next most relevant exposure metric was selected. This was done to remove studies with low study power. This criterion only involved two studies and had only small impacts on our results.9,10 For example, removing these two studies or using the relative risks of zero for their selected exposure category changed the benzene–NHL summary relative risk estimate from 1.22 to 1.21 and 1.19, respectively.
We selected studies that reported either incidence rate ratios, odds ratios, or standardised mortality ratios (SMRs). Incidence rate ratios and odds ratios adjusted for age and gender were used. Several case-control studies and a few cohort studies also reported relative risks adjusted for other variables such as education, family history of cancer, ethnicity, income and smoking. Adjusted relative risks were used when available. In our meta-analysis of benzene and NHL, many studies reported data on NHL incidence and a few studies reported data on both incidence and mortality. Incidence relative risks were selected over mortality relative risks if both were reported. In the meta-analysis of refinery work and NHL, the Gun et al study was the only study that reported relative risks for both NHL incidence and mortality.11 Few refinery studies reported data on NHL incidence. Because of this, we used the Gun et al results for mortality in the refinery–NHL meta-analysis.
Some studies reported results for different latency periods (the time from first exposure to cancer diagnosis). Increases in ANLL have been associated more strongly with more recent benzene exposures compared to more distant exposures but this does not appear to be the case for NHL.1 Since many environmental agents can take decades to lead to detectable cancers, we chose the result for the longest latency period. These were generally about 10–20 years and never more than 40 years. For many specific benzene-exposed cohorts, publication of initial results was followed by one or more updates, usually extending the period of follow-up. In these instances the most recent publication giving the selected exposure metric was used in our analysis.
Occupational studies reporting SMRs can be biased by the healthy worker effect.12 In order to objectively evaluate the impact of this bias, we performed separate analyses in which SMRs were adjusted for the healthy worker effect using the methods initially presented by Miettinen and Wang to analyse proportionate mortality studies as case-control studies.13 This method involves computation of the mortality odds ratio for the cause of death of interest (NHL) and all other causes of death comparing the benzene-exposed group to the benzene-unexposed group. Justification and further details for this method are provided in Smith et al.3 For those studies that did not provide sufficient data to do these calculations, the unadjusted relative risks were used.
Summary relative risk estimates were calculated using both the fixed effects inverse variance weighting method14 and the random effects method.15 Heterogeneity among studies was assessed using the general variance-based method as described by Petitti.16 Some authors have suggested that because the random effects model incorporates between-study heterogeneity it is more conservative than the fixed effects model.16 However, a potential problem with the random effects model is that, unlike the fixed effects model, study weighting is not directly proportional to study precision. As a consequence, the random effects model gives relatively greater weight to smaller, less precise studies compared to larger, more precise studies than the fixed effects model. As shown by Poole and Greenland, this can actually lead to summary results that are less conservative than those produced using the fixed effects model.17 To avoid the problems introduced by the random effects model, we used the method first presented by Shore et al18 and used in several subsequent meta-analyses.19–22 In this method the summary relative risk estimate is calculated by directly weighting individual studies by their precision as in the fixed effects model. Between-study heterogeneity is not used to calculate the relative risk estimate, but is incorporated into calculations of its variance (ie, its 95% confidence interval).
Publication bias was assessed using funnel plots and Begg’s and Egger’s tests.23,24 The funnel plot is a graphical presentation of each study’s effect size versus an estimate of its precision and can be asymmetrical if smaller studies with null or unexpected results are not published. In Egger’s test, asymmetry in the funnel plot can be formally tested by performing a simple linear regression of the effect size divided by its standard error (SE) on the inverse of the SE.24 In Begg’s test, Kendall’s rank order test is used to assess the correlation between the studies’ effect sizes and their SEs.23
All p values for the meta-analysis results are one-sided since we had a clear one-directional a priori hypothesis: that benzene or refinery work was associated with an increased (not decreased) NHL risk.
Although the focus of our study was on benzene exposure, we performed a supplementary meta-analysis of refinery work since this industry has historically been associated with exposures to benzene. Our meta-analysis of refinery work and NHL was done using similar methods to those described above, except in this analysis only cohort studies were used and studies of refinery workers were used regardless of whether or not they provided specific information on benzene exposure. In these studies, exposure was commonly classified as the number of years worked at the refinery. The relative risk from each study associated with the greatest number of years worked was selected for the meta-analysis. When data on this metric weren’t provided, relative risks for metrics in the following order were selected: greatest number of years since hire, highly exposed job category (ie, hourly worker versus salary worker) and any refinery work (Table 1).
RESULTS
Studies of benzene exposure and NHL risk
Tables 2 and 3 provide details of the case-control and cohort studies used in the meta-analysis of benzene exposure and NHL risk, respectively. A list of studies not used and reasons why they were not used can be found at http://socrates.berkeley.edu/~asrg/links.html. In total, the meta-analysis of benzene exposure and NHL included 16 case-control and six cohort studies. The overall summary relative risk for all 22 studies combined was 1.22 (95% CI 1.02 to 1.47; p = 0.01) (Table 4). In an analysis by study design, the summary relative risks for cohort studies (RR = 1.21, 95% CI 0.83 to 1.77; p = 0.15) were similar to that for the case-control studies (RR = 1.23; 95% CI 0.99 to 1.52; p = 0.03). In the 13 studies that provided results specifically for highly exposed workers the summary relative risk was 1.49 (95% CI 1.12 to 1.97) (Figure 1). In the six of these studies that did not rely on self-reported exposure information for exposure assessment, the summary estimate was 2.12 (95% CI 1.11 to 4.02). When three of the four cohort studies in this analysis were adjusted for the healthy worker effect, the relative risk rose slightly to 2.26 (95% CI 1.29 to 3.97) (An internal comparison group was used in the cohort study by Hayes et al so the healthy worker effect adjustment was not done.1)
Table 2.
Case-control studies of benzene exposure and non-Hodgkin’s lymphoma (NHL)
| Author, year (Reference) | RR | CIlow | CIup | Type | N | Location | Exposure | Exposure category |
Self- report |
Outcome | Source |
|---|---|---|---|---|---|---|---|---|---|---|---|
| Bernard et al 198438 | 0.49 | 0.21 | 2.00 | cc | unk | Yorkshire | Benzene use | All | Yes | NHL incidence | Cancer registry/hospital controls |
| Blair et al 199339 | 1.5 | 0.7 | 3.1 | cc | 12 | Iowa/ Minnesota |
Higher intensity | High | Yes | NHL incidence | Cancer registry/RDD & HCFA |
| Dryver et al 200440 | 1.95 | 0.90 | 4.21 | cc | 15 | Sweden | High exposure aromatic HCs |
High | Yes | NHL incidence | Cancer registry/Sweden ID no. |
| Fabbro-Peray et al 200141 | 5.7 | 1.4 | 23.2 | cc | 8 | France | Cumulative >810 days exposed |
High | Yes | NHL incidence | Hospitals/electoral lists |
| Franceschi et al 198942 | 1.14 | 0.57 | 2.28 | cc | 15 | Italy | Benzene and solvents | All | Yes | NHL incidence | Hospitals/hospital controls |
| Fritschi et al 200543 | 0.31 | 0.06 | 1.50 | cc | 2 | Australia | Substantial (>10% TLV >5 days × 5 yrs) |
High | Yes | NHL incidence | Cancer registry/electoral lists |
| Gerin et al 199829 | 0.8 | 0.4 | 1.6 | cc | 9 | Montreal | Medium/high | High | Yes | NHL incidence | Hospitals/electoral lists |
| Glass et al 200344 | 1.48 | 0.30 | 7.16 | ncc | 2 | Australia | Cumulative exposure >16 ppm-yrs |
High | No | NHL incidence | Nested in cohort |
| Kato et al 200545 | 1.52 | 0.41 | 5.70 | cc | 7 | New York | Occupational exposure | All | Yes | NHL incidence | Cancer registry/DMV & HCFA |
| Mao et al 200046 men | 1.2 | 0.8 | 1.9 | cc | 36 | Canada | Occupational exposure | All | Yes | NHL incidence | Cancer registry/insurance & RDD |
| Mao et al 200046 women |
0.6 | 0.2 | 1.8 | cc | 5 | Canada | Occupational exposure | All | Yes | NHL incidence | Cancer registry/insurance & RDD |
| Miligi et al 200630 | 1.6 | 1.0 | 2.4 | cc | 58 | Italy | Medium/high intensity | High | Yes | NHL incidence | Hospital & cancer registry/ population sample |
| Persson & Fredrikson 199947 |
0.8 | 0.1 | 3.8 | cc | 3 | Sweden | Occupational 1 year, 5–45 years earlier |
All | Yes | NHL incidence | Hospitals/population registers |
| Scherr et al 199248 | 1.2 | 0.5 | 2.6 | cc | unk | Boston | Benzene | All | Yes | NHL incidence | Hospitals/town residency lists |
| Schnatter et al 199649 | 0.93 | 0.08 | 7.19 | ncc | 2 | Canada | Intensity (mean ppm)=0.20–0.49 ppm |
High | No | NHL mortality | Nested in cohort (petroleum workers) |
| Seidler et al 200750 | 1.0 | 0.4 | 2.3 | cc | 11 | Germany | Cumulative >130 ppm-yr | High | Yes | NHL incidence | Hospitals and physicians/ population registry |
cc, case-control; CIlow, lower 95% CI; CIup, upper 95% CI; DMV, Department of Motor Vehicles; exposure, the exposure category selected for this meta-analysis; exposure category, described as “High” if results for a high exposure category were used; HC, hydrocarbon; HCFA, Health Core Financing Administration; LR, lymphosarcoma and reticulosarcoma; N, number of cases in the selected exposure category; ncc, nested case control; RDD, random digit dialling; self-report, “Yes” means exposure history based primarily on self-reported work history; source, the source of cases and controls in case-control studies; TLV, threshold limit value; unk, unknown.
Table 3.
Cohort studies of benzene exposure and non-Hodgkin’s lymphoma (NHL)
| Author, year (Reference) |
RR | CIlow | CIup | N | Location/ industry |
Exposure | Exposure category |
Self- report |
Outcome | All cause SMR |
Adj RR |
Adj CIlow |
Adj CIup |
|---|---|---|---|---|---|---|---|---|---|---|---|---|---|
| Bloemen et al 20049 | 2.15 | 0.44 | 6.28 | 3 | Michigan/ Chemical |
Any exposure >10 yrs, 15 yr lag |
High | No | NHL SMR | 0.90 | 2.39 | 0.45 | 5.87 |
| Collins et al 200325 | 1.80 | 0.40 | 5.10 | 3 | Illinois/Chemical | >40 days exposed >100 ppm |
High | No | NHL SMR | 1.00 | 1.81 | 0.34 | 4.44 |
| Hayes et al 19971 | 4.70 | 1.20 | 18.10 | 7 | China/Multiple | Average exposure ≥25 ppm |
High | No | NHL incidence | na* | na | na | na |
| Rinsky et al 20028 | 0.96 | 0.31 | 2.25 | 5 | Ohio/Rubber | ≥1 ppm-day | All | No | NHL SMR | 0.98 | 0.98 | 0.31 | 2.03 |
| Sorahan et al 20052 | 1.00 | 0.64 | 1.49 | 24 | UK/Multiple | Identified by companies as being exposed to benzene |
All | Yes | NHL incidence | 1.07 | 0.93 | 0.60 | 1.34 |
| Wong 198726 | 1.51 | 0.02 | 8.40 | 1 | Multiple/Chemical | Continuous exposure, cumulative exposure >720 ppm-mo |
High | No | LR SMR | 0.63 | 2.39 | 0.00 | 9.38 |
Adj, adjusted for the healthy worker effect; CIlow, lower 95% CI; CIup, upper 95% CI; exposure, the exposure category selected for this meta-analysis; exposure category, described as “High” if results for a high exposure category were used; LR, lymphosarcoma and reticulosarcoma; N, number of cases in the selected exposure category; SMR, standardised mortality ratio; Self-report, “Yes” means exposure history based primarily on self-reported work history.
Internal comparison group used in Hayes et al 1997 so the healthy worker effect adjustment was not done.
Table 4.
Summary results of the meta-analysis of benzene exposure and non-Hodgkins lymphoma (NHL) and meta-analysis of refinery work and NHL
| Fixed effects |
Shore CI |
Random effects |
Heterogeneity |
||||||||||
|---|---|---|---|---|---|---|---|---|---|---|---|---|---|
| N | RR | CIlow | CIup | RR | CIlow | CIup | RR | CIlow | CIup | χ 2 | p | I2 (%) | |
| Benzene and NHL | |||||||||||||
| All studies | 22 | 1.22 | 1.03 | 1.46 | 1.22 | 1.02 | 1.47 | 1.23 | 1.02 | 1.48 | 22.8 | 0.36 | 8 |
| Case-control studies | 16 | 1.23 | 1.00 | 1.50 | 1.23 | 0.99 | 1.52 | 1.21 | 0.97 | 1.51 | 16.8 | 0.33 | 12 |
| Cohort studies | 6 | 1.21 | 0.86 | 1.71 | 1.21 | 0.83 | 1.77 | 1.34 | 0.86 | 2.09 | 5.9 | 0.31 | 16 |
| High exposure studies | |||||||||||||
| All | 13 | 1.49 | 1.15 | 1.92 | 1.49 | 1.12 | 1.97 | 1.49 | 1.09 | 2.04 | 14.9 | 0.25 | 20 |
| No self-reported data | 6 | 2.12 | 1.11 | 4.02 | na* | na | na | na | na | na | 2.1 | 0.83 | 0 |
| Healthy worker effect adjusted | |||||||||||||
| Cohort studies | 6 | 1.22 | 0.89 | 1.67 | 1.22 | 0.80 | 1.85 | 1.54 | 0.92 | 2.59 | 8.6 | 0.13 | 42 |
| All studies (cohort and case control) | 22 | 1.22 | 1.03 | 1.45 | 1.22 | 1.02 | 1.48 | 1.24 | 1.01 | 1.51 | 25.4 | 0.23 | 17 |
| All high exposure studies | 13 | 1.53 | 1.19 | 1.96 | 1.53 | 1.15 | 2.03 | 1.55 | 1.14 | 2.12 | 15.8 | 0.20 | 24 |
| High exposure, no self-reported data | 6 | 2.26 | 1.29 | 3.97 | na* | na | na | na | na | na | 2.1 | 0.83 | 0 |
| Refinery work and NHL | |||||||||||||
| All studies (cohort only) | 21 | 1.21 | 1.06 | 1.38 | 1.21 | 1.00 | 1.46 | 1.21 | 0.97 | 1.53 | 40.0 | <0.01 | 50 |
| High exposure studies† | 14 | 1.30 | 1.04 | 1.62 | 1.30 | 0.90 | 1.88 | 1.18 | 0.79 | 1.77 | 35.3 | <0.01 | 63 |
| Healthy worker effect adjusted | |||||||||||||
| All studies | 21 | 1.42 | 1.25 | 1.62 | 1.42 | 1.19 | 1.69 | 1.44 | 1.16 | 1.78 | 37.6 | 0.01 | 47 |
| All high exposure studies† | 14 | 1.51 | 1.22 | 1.88 | 1.51 | 1.07 | 2.14 | 1.37 | 0.94 | 2.01 | 33.1 | 0.01 | 47 |
Abbreviations: CIlow, lower 95% CI; CIup, upper 95% CI; p, p value for the heterogeneity statistic; RR, summary relative risk estimate; χ2, chi-square heterogeneity statistic.
If heterogeneity is not present (χ2 < the degrees of freedom) then the Shore or random effects models are the same as the fixed effects model. The degrees of freedom is the number of studies minus one.
Includes all studies in Table 5 with exposure category not marked “Total cohort”.
Figure 1.

Forest plot of high exposure studies in the meta-analysis of benzene and NHL.
The cohort investigated in Collins et al25 made up one of the seven plants included in the Wong study.26 However, the Wong study had a small number of cases (probably because the follow-up period was relatively short) and therefore received only a small fraction of the total weight in any analysis. Removing this study had little effect on our results.
Studies of refinery work and NHL risk
Table 5 shows details of the studies included in the meta-analysis of refinery work and NHL. Lists of studies and relative risks not used for this analysis can be found at http://socrates.berkeley.edu/~asrg/links.html. The summary relative risk for all 21 studies in this analysis was 1.21 (95% CI 1.00 to 1.46; p = 0.02). When adjusted for the healthy worker effect, this rose to 1.42 (95% CI 1.19 to 1.69; p<0.001). The Tsai et al study27 had a much higher relative risk than any other study in this analysis. Removing this study from this analysis caused a slight decrease in the summary estimate (RR = 1.37; 95% CI 1.18 to 1.58). Removing the Sorahan et al study,28 which had a much larger sample size and was weighted more heavily than any other study, also had little impact on this analysis (RR = 1.44; 95% CI 1.15 to 1.80). When the analysis of refinery studies with the healthy worker effect adjustment was confined to only those 14 studies that assessed a higher exposure category, the summary relative risk increased to 1.51 (95% CI 1.07 to 2.14) (This analysis included all studies in Table 5 that were not marked “Total cohort” for the exposure category.) The summary relative risk calculated using the random effects model was lower than this (RR = 1.37; 95% CI 0.94 to 2.01) because of the greater weight given to the smaller, less precise studies by this model.
Table 5.
Cohort studies of refinery work and non-Hodgkin’s lymphoma (NHL)
| Author, year (Reference) | RR | CIlow | CIup | N | Location | Exposure | Outcome | All cause SMR |
Adj RR | Adj CIlow | Adj CIup |
|---|---|---|---|---|---|---|---|---|---|---|---|
| Collingwood et al 199651 | 0.71 | 0.09 | 2.57 | 2 | Paulsboro, New Jersey | Employed 30+ years | LR SMR | 0.93 | 0.76 | 0.07 | 2.19 |
| Consonni et al 199952 | 2.12 | 0.68 | 4.95 | 5 | Northern Italy | Total cohort | NHL SMR | 0.87 | 2.46 | 0.78 | 5.08 |
| Dagg et al 199253 | 0.55 | 0.01 | 3.05 | 1 | Chevron, El Segundo | Employed 30+ years | LR SMR | 0.73 | 0.75 | 0.00 | 2.94 |
| Dagg et al 199253 | 2.26 | 0.97 | 4.45 | 8 | Chevron, Richmond | Employed 30+ years | LR SMR | 0.86 | 2.71 | 1.16 | 4.90 |
| Divine et al 199954 | 0.3 | 0.1 | 0.7 | 5 | Texaco Mortality Study | Employed 30+ years | LR SMR | 0.79 | 0.38 | 0.12 | 0.78 |
| Gun et al 200611 | 0.99 | 0.62 | 1.50 | 22 | Health Watch | Total cohort (men) | NHL SMR | 0.72 | 1.38 | 0.87 | 2.02 |
| Honda et al 199555 | 0.96 | 0.51 | 1.64 | 13 | Illinois refinery | Hourly | LR SMR | 0.82 | 1.17 | 0.62 | 1.89 |
| Huebner et al 200456 | 1.46 | 0.86 | 2.3 | 18 | Exxon Mobile, Baton Rouge |
Employed 30+ years | NHL SMR | 0.79 | 1.86 | 1.10 | 2.82 |
| Huebner et al 200456 | 0.66 | 0.27 | 1.36 | 7 | Exxon Mobile, Baytown | Employed 30+ years | NHL SMR | 0.79 | 0.83 | 0.33 | 1.57 |
| Kaplan 198657 | 0.9 | 0.51 | 1.46 | 16 | US refinery workers, TCA, API |
Total cohort | LR SMR | 0.78 | 1.15 | 0.66 | 1.79 |
| Lewis et al 200058 | 1.09 | 0.68 | 1.65 | 22 | Canada, Exxon Mobile | Total cohort (men) | NHL SMR | 0.92 | 1.19 | 0.74 | 1.73 |
| Pukkala 199859 | 2.01 | 1.00 | 3.59 | 11 | Finland | Blue collar workers | NHL incidence | na* | na | na | na |
| Satin et al 199660 | 0.27 | 0.03 | 0.97 | 2 | Gulf/Chevron, Pt Arthur | Employed 30+ years | LR SMR | 0.88 | 0.31 | 0.03 | 0.87 |
| Sorahan et al 200228 | 1.22 | 0.97 | 1.51 | 84 | 8 British oil refineries | Total cohort (men) | LR SMR | 0.88 | 1.39 | 1.11 | 1.70 |
| Thomas et al 198261 | 1.57 | 0.75 | 2.89 | 10 | OCAW | Retired | NHL PMR | na* | na | na | na |
| Tsai et al 199362 | 1.21 | 0.15 | 4.37 | 2 | Shell, Martinez | Total cohort | LR SMR | 0.89 | 1.36 | 0.13 | 3.90 |
| Tsai et al 199627 | 6.75 | 2.48 | 14.69 | 6 | Shell, Deer Park | Employed 30+ years | LR SMR | 1.04 | 6.91 | 2.49 | 13.55 |
| Tsai et al 200363 | 2.32 | 0.48 | 6.79 | 3 | Norro, LA | Total cohort | LR SMR | 0.74 | 3.15 | 0.59 | 7.71 |
| Waxweiler et al 198364 | 0.68 | 0.18 | 1.74 | 4 | Texas City | Hourly | LR SMR | 0.8 | 0.85 | 0.22 | 1.89 |
| Wong et al 2001a65 | 1.16 | 0.24 | 3.40 | 3 | Mobil, Beaumont | Employed 30+ years | NHL SMR | 0.94 | 1.24 | 0.23 | 3.04 |
| Wong et al 2001b66 | 1.14 | 0.24 | 3.35 | 3 | Mobil, Torrance | Hired 40+ years ago | NHL SMR | 0.91 | 1.25 | 0.24 | 3.07 |
Adj, adjusted for the healthy worker effect; CIlow, lower 95% CI; CIup, upper 95% CI; exposure, the exposure category selected for this meta-analysis; LR, lymphosarcoma and reticulosarcoma; N, number of cases in the selected exposure category; PMR, proportionate mortality ratio; SMR, standardised mortality ratio; self-report, “Yes” means exposure history based primarily on self-reported work history.
No evidence of publication bias was evident in the funnel plots, Begg’s test, or Egger’s test in either the benzene or refinery analyses. For example, in the benzene–NHL meta-analysis involving the 13 high exposure studies (not adjusted for the healthy worker effect), Begg’s test Kendall’s score was −2 (p = 0.90), Egger’s test p value for bias was 0.81, and the funnel plot showed no evidence of asymmetry (Figure 2).
Figure 2.
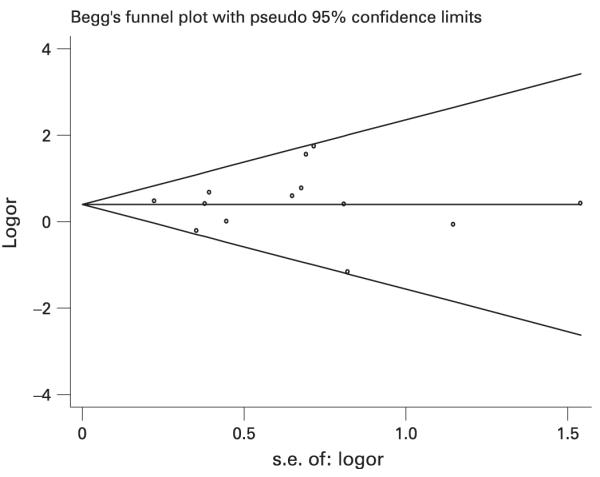
Funnel plot of benzene and NHL high exposure studies (n = 13) (not adjusted for the healthy worker effect).
DISCUSSION
The elevated summary relative risk estimate we identified in studies that specifically examined high benzene exposure provides new evidence that benzene causes NHL. The increase in summary relative risks when analyses were confined to results in highly exposed workers and reports not based primarily on self-reported exposure provides an example of how exposure misclassification and the inclusion of low or unexposed workers in “exposed” cohorts can bias or dilute relative risk estimates towards the null. This highlights the importance of evaluating and incorporating information on exposure level when reviewing epidemiological literature on the health effects of benzene.
We also found evidence that increased risks of NHL are associated with work in petroleum refineries. Refinery work can be associated with exposure to many different chemical agents so this analysis by itself does not provide direct evidence that any single agent is responsible for the observed increase. However, benzene exposures have traditionally been seen in this industry and no other chemical commonly found at high levels in refinery work has been conclusively linked with NHL. Thus, while these results do not directly implicate benzene as a cause of NHL, they do support the findings of our analyses that looked directly at benzene exposure.
Our findings differ from a previous meta-analysis of benzene exposure and NHL which did not find evidence of an association.5 There were several reasons for this including our use of a few studies that were published only after the previous meta-analysis was published and our exclusion of studies where exposure was based solely on death certificate information. The primary reason however was our selection of relative risks for highly exposed groups instead of those for all exposure groups combined. In general, this resulted in us using higher relative risks for several studies than were used in the previous meta-analysis. For example, for the Bloemen et al and Collins et al studies we used the relative risks of 2.15 for >10 years of exposure group and 1.80 for >40 days of exposure to >100 ppm group, respectively. In the previous meta-analysis, relative risks for all exposed groups combined were used for both of these studies and these were markedly lower than the ones we used (1.06 and 0.89, respectively).
Our analysis of refinery studies provided some interesting results with regards to the healthy worker effect. In the analysis of all refinery studies combined, the relative risk rose from 1.21 (95% CI 1.00 to 1.46; p = 0.02) to 1.42 (95% CI 1.19 to 1.69; p<0.001) after adjustment for this bias. These results provide a good example of the potential importance of evaluating and adjusting for the healthy worker effect in occupational mortality studies.
Despite our analyses of the healthy worker effect and the dilution of exposed cohorts with lesser exposed workers, several other important biases could have affected our results. For example, our results may not represent an effect of benzene but could be due to some chemical or other exposure that is highly correlated with benzene exposure. Several studies have reported a high correlation between benzene exposure and certain other chemicals such as toluene and xylene.29,30 However, several biological observations suggest that benzene is responsible for the elevated relative risks we found. First, benzene has been shown to have the ability to produce chromosomal and genetic changes important to NHL induction. Second, benzene is a known human carcinogen and a known bone marrow toxin.4 None of the other agents closely correlated with high benzene exposure have shown similar effects. Third, benzene has been linked to lymphomas in several animal studies including the 1986 National Toxicology Program carcinogenicity bioassay of benzene.31–34
Many other agents have been linked to NHL in some studies, but for several reasons are not likely to be important confounding variables in our analysis. Confounding variables must be associated with both exposure and disease. For many of the factors linked to NHL (eg, some pesticides, certain dietary and lifestyle variables), positive associations have not been consistent from study to study and a true causal link may not exist.35 Other factors (eg, family history of NHL, autoimmune disorders, viral infections) are probably too rare to substantially impact our analyses. Still other factors may be associated with NHL, but are not strongly associated with benzene exposure or refinery work and therefore would not act as important confounders. As a whole, while we cannot completely exclude the possibility that some other agent is causing the effects we identified, most evidence suggests the major causative agent is benzene.
Other potential biases could result from the inclusion of case-control studies in our analysis of benzene and NHL. Factors such as recall bias or bias in the selection of controls can affect case-control studies. However, in our analyses based on study design, the summary relative risks were similar when we assessed case-control and cohort studies separately. If substantial bias affected case-control studies more than cohort studies we would expect these estimates to be markedly different from each other. Also, in our analysis of high exposure studies excluding those based primarily of self-reported data (the analysis where we found our highest relative risks of 2.12 and 2.26), the two case-control studies in this analysis were nested in cohort studies. As such, many of the potential problems that can occur with un-nested studies would not likely have occurred in these studies.
Another issue that could impact the studies included in our meta-analysis is the varying definitions of NHL that were used from study to study. As explained above, we included studies of both NHL and studies of lymphosarcoma/reticulosarcoma. Various ICD or other coding classifications were used including the International Classification of Diseases (ICD), the Rappaport classification, the Revised European-American Lymphoma classification, and the National Cancer Institutes Working Formulation system. Most studies used ICD7–9 codes 200 and 202. The use of different classifications has added some complexity to the diagnosis of NHL. Wong and Raabe provide a thorough review of this issue.6 Importantly, the inclusion of NHL subtypes unrelated to benzene would bias relative risk estimates towards the null, not towards the positive associations we identified. Other errors in diagnosing NHL may have also occurred; however, the diagnosis of cancer was done independently of benzene exposure. As such, any misclassification of disease would have likely been non-differential and therefore biased relative risk estimates towards the null, not towards the positive effects we identified. Similar effects would likely be seen with misclassification of benzene exposure or the use of exposure metrics that are not truly associated with NHL risk. In all studies benzene exposure was assessed independently of disease status; thus, bias from errors in misclassification would most likely be towards the null, not towards the positive associations we identified.
Another potential bias that can impact meta-analyses is publication bias, the tendency of journals or researchers to publish statistically significant effects.36 In our analysis, no obvious asymmetry was identified in the funnel plots,37 and no evidence of publication bias was seen in Egger’s or Begg’s tests. Further evidence that publication did not have a substantial impact on our analysis is the large number of results that were not statistically significant. Only four of the 43 studies (9%) we included in our analyses reported statistically significant positive effects (Tables 2, 3, 5). This small percentage suggests that for this particular topic, there was not a strong tendency to only publish statistically significant positive results. It should be noted that none of the methods we used to assess publication bias are completely reliable and publication bias may still be occurring despite their findings. However, as a whole, the results of these tests combined provide evidence that publication bias was not responsible for the positive associations we report.
Some heterogeneity was seen in some of the meta-analyses we performed, particularly in those of refinery studies. As discussed above, some of this may have been due to including very low exposed workers in exposed groups in some studies but not in others. Some of this may have also been due to the differences across studies in assessing exposure and classifying NHL discussed above. Other sources of heterogeneity include other differences in study methodology or differences across study populations.
In conclusion, the results of these analyses suggest that benzene causes NHL and failure to exclude unexposed workers from “exposed cohorts” and failure to incorporate information on the healthy worker effect could lead to important effects being missed. While our meta-analysis of refinery work does not directly implicate benzene as a cause of NHL, the benzene exposures that can occur in this industry, combined with the lack of any other obvious or likely causative agent supports the hypothesis that benzene is the agent responsible for the effects we identified. Other human, animal, and laboratory data linking benzene to NHL and immunotoxicity provide further support and biological plausibility to our findings. Misclassification of both exposure and NHL could have biased the individual studies and our meta-analysis as a whole. However, these biases were most likely non-differential and thus not likely to cause the positive effects we identified. Publication bias may also impact meta-analyses such as this one, but the funnel plots and statistical tests we performed, and the very small number of statistically significant results used in these analyses, all combine to suggest that this bias was also not responsible for the positive associations reported here.
Main messages.
▶ Benzene may cause non-Hodgkin’s lymphoma.
▶ Refinery work may be associated with an increased risk of non-Hodgkin’s lymphoma.
▶ Biases from the healthy worker effect and exposure misclassification may have masked this effect in some studies.
Policy implication.
▶ Risk assessments for environmental and occupational standard setting for benzene should incorporate its possible effects on non-Hodgkin’s lymphoma incidence.
Acknowledgements
Northern California Center for Occupational and Environmental Health and NIH grants P42ES04705, R01ES06721, and R01CA104862 (MT Smith) and National Institute for Occupational Safety and Health Training Grant T42 OH008429 (RM Jones).
The views expressed are those of the authors and do not necessarily represent those of the Office of Environmental Health Hazard Assessment, the California Environmental Protection Agency, or the State of California.
Funding: MTS has received consulting and expert testimony fees from law firms representing both plaintiffs and defendants in cases involving exposure to benzene.
Footnotes
Competing interests: None declared.
REFERENCES
- 1.Hayes RB, Yin SN, Dosemeci M, et al. Benzene and the dose-related incidence of hematologic neoplasms in China. Chinese Academy of Preventive Medicine--National Cancer Institute Benzene Study Group. J Natl Cancer Inst. 1997;89:1065–71. doi: 10.1093/jnci/89.14.1065. [DOI] [PubMed] [Google Scholar]
- 2.Sorahan T, Kinlen LJ, Doll R. Cancer risks in a historical UK cohort of benzene exposed workers. Occup Environ Med. 2005;62:231–6. doi: 10.1136/oem.2004.015628. [DOI] [PMC free article] [PubMed] [Google Scholar]
- 3.Smith MT, Jones RM, Smith AH. Benzene exposure and risk of non-Hodgkin lymphoma. Cancer Epidemiol Biomarkers Prev. 2007;16:385–91. doi: 10.1158/1055-9965.EPI-06-1057. [DOI] [PubMed] [Google Scholar]
- 4.International Agency for Research on Cancer . Occupational exposures in petroleum refining: crude oil and major petroleum fuels. World Health Organization; Lyon, France: 1989. IARC Monographs on the evaluation of carcinogenic risks to humans. [PMC free article] [PubMed] [Google Scholar]
- 5.Lamm SH, Engle A, Byrd DM. Non-Hodgkin’s lymphoma and benzene exposure: A systematic literature review. Chem Biol Interact. 2005;153–154:231–7. doi: 10.1016/j.cbi.2005.03.027. [DOI] [PubMed] [Google Scholar]
- 6.Wong O, Raabe GK. Non-Hodgkin’s lymphoma and exposure to benzene in a multinational cohort of more than 308,000 petroleum workers, 1937 to 1996. J Occup Environ Med. 2000;42:554–68. doi: 10.1097/00043764-200005000-00016. [DOI] [PubMed] [Google Scholar]
- 7.Greenland S. In: Modern epidemiology. 2nd ed Rothman K, Greenland S, editors. Lippincott Raven; Philadelphia: 1998. [Google Scholar]
- 8.Rinsky RA, Hornung RW, Silver SR, et al. Benzene exposure and hematopoietic mortality: A long-term epidemiologic risk assessment. Am J Ind Med. 2002;42:474–80. doi: 10.1002/ajim.10138. [DOI] [PubMed] [Google Scholar]
- 9.Bloemen LJ, Youk A, Bradley TD, et al. Lymphohaematopoietic cancer risk among chemical workers exposed to benzene. Occup Environ Med. 2004;61:270–4. doi: 10.1136/oem.2003.007013. [DOI] [PMC free article] [PubMed] [Google Scholar]
- 10.Schnatter AR, Theriault G, Katz AM, et al. A retrospective mortality study within operating segments of a petroleum company. Am J Ind Med. 1992;22:209–29. doi: 10.1002/ajim.4700220207. [DOI] [PubMed] [Google Scholar]
- 11.Gun RT, Pratt N, Ryan P, et al. Update of mortality and cancer incidence in the Australian petroleum industry cohort. Occup Environ Med. 2006;63:476–81. doi: 10.1136/oem.2005.023796. [DOI] [PMC free article] [PubMed] [Google Scholar]
- 12.Rothman K. An introduction. Oxford University Press; New York: 2002. Epidemiology. [Google Scholar]
- 13.Miettinen OS, Wang JD. An alternative to the proportionate mortality ratio. Am J Epidemiol. 1981;114:144–8. doi: 10.1093/oxfordjournals.aje.a113161. [DOI] [PubMed] [Google Scholar]
- 14.Greenland S. Meta-analysis. In: Rothman K, Greenland S, editors. Modern epidemiology. 2nd ed Lippincott Raven; Philadelphia: 1998. pp. 643–73. [Google Scholar]
- 15.DerSimonian R, Laird N. Meta-analysis in clinical trials. Control Clin Trials. 1986;7:177–88. doi: 10.1016/0197-2456(86)90046-2. [DOI] [PubMed] [Google Scholar]
- 16.Petitti D. Meta-analysis, decision analysis, and cost effectiveness analysis. Oxford University Press; New York: 1994. [Google Scholar]
- 17.Poole C, Greenland S. Random effects meta-analyses are not always conservative. Am J Epidemiol. 1999;150:469–75. doi: 10.1093/oxfordjournals.aje.a010035. [DOI] [PubMed] [Google Scholar]
- 18.Shore RE, Gardner MJ, Pannett B. Ethylene oxide: an assessment of the epidemiological evidence on carcinogenicity. Br J Ind Med. 1993;50:971–97. doi: 10.1136/oem.50.11.971. [DOI] [PMC free article] [PubMed] [Google Scholar]
- 19.Bhatia R, Lopipero P, Smith AH. Diesel exhaust exposure and lung cancer. Epidemiology. 1998;9:84–91. [PubMed] [Google Scholar]
- 20.Setia MS, Steinmaus C, Ho CS, et al. The role of BCG in prevention of leprosy: a meta-analysis. Lancet Infect Dis. 2006;6:162–70. doi: 10.1016/S1473-3099(06)70412-1. [DOI] [PubMed] [Google Scholar]
- 21.Steinmaus CM, Nunez S, Smith AH. Diet and bladder cancer: a meta-analysis of six dietary variables. Am J Epidemiol. 2000;151:693–702. doi: 10.1093/oxfordjournals.aje.a010264. [DOI] [PubMed] [Google Scholar]
- 22.Zhuo H, Smith AH, Steinmaus C. Selenium and lung cancer: a quantitative analysis of heterogeneity in the current epidemiological literature. Cancer Epidemiol Biomarkers Prev. 2004;13:771–8. [PubMed] [Google Scholar]
- 23.Begg CB, Mazumdar M. Operating characteristics of a rank correlation test for publication bias. Biometrics. 1994;50:1088–101. [PubMed] [Google Scholar]
- 24.Egger M, Davey Smith G, Schneider M, et al. Bias in meta-analysis detected by a simple, graphical test. BMJ. 1997;315:629–34. doi: 10.1136/bmj.315.7109.629. [DOI] [PMC free article] [PubMed] [Google Scholar]
- 25.Collins JJ, Ireland B, Buckley CF, et al. Lymphohaematopoeitic cancer mortality among workers with benzene exposure. Occup Environ Med. 2003;60:676–9. doi: 10.1136/oem.60.9.676. [DOI] [PMC free article] [PubMed] [Google Scholar]
- 26.Wong O. An industry wide mortality study of chemical workers occupationally exposed to benzene. II. Dose response analyses. Br J Ind Med. 1987;44:382–95. doi: 10.1136/oem.44.6.382. [DOI] [PMC free article] [PubMed] [Google Scholar]
- 27.Tsai SP, Gilstrap EL, Cowles SR, et al. Long-term follow-up mortality study of petroleum refinery and chemical plant employees. Am J Ind Med. 1996;29:75–87. doi: 10.1002/(SICI)1097-0274(199601)29:1<75::AID-AJIM10>3.0.CO;2-X. [DOI] [PubMed] [Google Scholar]
- 28.Sorahan T, Nichols L, Harrington JM. Mortality of United Kingdom oil refinery and petroleum distribution workers, 1951–1998. Occup Med (Lond) 2002;52:333–9. doi: 10.1093/occmed/52.6.333. [DOI] [PubMed] [Google Scholar]
- 29.Gerin M, Siemiatycki J, Desy M, et al. Associations between several sites of cancer and occupational exposure to benzene, toluene, xylene, and styrene: Results of a case-control study in Montreal. Am J Ind Med. 1998;34:144–56. doi: 10.1002/(sici)1097-0274(199808)34:2<144::aid-ajim7>3.0.co;2-x. [DOI] [PubMed] [Google Scholar]
- 30.Miligi L, Costantini AS, Benvenuti A, et al. Occupational exposure to solvents and the risk of lymphomas. Epidemiology. 2006;17:552–61. doi: 10.1097/01.ede.0000231279.30988.4d. [DOI] [PubMed] [Google Scholar]
- 31.Cronkite EP, Bullis J, Inoue T, et al. Benzene inhalation produces leukemia in mice. Toxicol Appl Pharmacol. 1984;75:358–61. doi: 10.1016/0041-008x(84)90219-9. [DOI] [PubMed] [Google Scholar]
- 32.Maltoni C, Ciliberti A, Cotti G, et al. Benzene, an experimental multipotential carcinogen: results of the long-term bioassays performed at the Bologna Institute of Oncology. Environ Health Perspect. 1989;82:109–24. doi: 10.1289/ehp.8982109. [DOI] [PMC free article] [PubMed] [Google Scholar]
- 33.National Toxicology Program . Toxicology and Carcinogenesis Studies of Benzene (CAS No. 71-43-2) in F344/N Rats and B6C3F1 Mice (Gavage Studies) U.S. Department of Health and Human Services, Public Health Service, National Institutes of Health, Research Triangle Park; 1986. NC. NIH Pub. No. 86-2545. [PubMed] [Google Scholar]
- 34.Snyder CA, Goldstein BD, Sellakumar AR, et al. The inhalation toxicology of benzene: Incidence of hematopoietic neoplasms and hematotoxicity in AKR/J and C57BL/6J mice. Toxicol Appl Pharmacol. 1980;54:323–31. doi: 10.1016/0041-008x(80)90202-1. [DOI] [PubMed] [Google Scholar]
- 35.Alexander DD, Mink PJ, Adami HO, et al. The non-Hodgkin lymphomas: a review of the epidemiologic literature. Int J Cancer. 2007;120(Suppl. 12):1–39. doi: 10.1002/ijc.22719. [DOI] [PubMed] [Google Scholar]
- 36.Sterne JA, Gavaghan D, Egger M. Publication and related bias in meta-analysis: power of statistical tests and prevalence in the literature. J Clin Epidemiol. 2000;53:1119–29. doi: 10.1016/s0895-4356(00)00242-0. [DOI] [PubMed] [Google Scholar]
- 37.Light R, Pillemar D. Summing up: the science of reviewing research. Harvard University Press; Cambridge, MA: 1984. [Google Scholar]
- 38.Bernard SM, Cartwright RA, Bird CC, et al. Aetiologic factors in lymphoid malignancies: a case-control epidemiological study. Leuk Res. 1984;8:681–9. doi: 10.1016/0145-2126(84)90016-x. [DOI] [PubMed] [Google Scholar]
- 39.Blair A, Linos A, Stewart PA, et al. Evaluation of risks for non-Hodgkin’s lymphoma by occupation and industry exposures from a case-control study. Am J Ind Med. 1993;23:301–12. doi: 10.1002/ajim.4700230207. [DOI] [PubMed] [Google Scholar]
- 40.Dryver E, Brandt L, Kauppinen T, et al. Occupational exposures and non-Hodgkin’s lymphoma in southern Sweden. Int J Occup Environ Health. 2004;10:13–21. doi: 10.1179/oeh.2004.10.1.13. [DOI] [PubMed] [Google Scholar]
- 41.Fabbro-Peray P, Daures JP, Rossi JF. Environmental risk factors for non-Hodgkin’s lymphoma: a population-based case-control study in Languedoc-Roussillon, France. Cancer Causes Control. 2001;12:201–12. doi: 10.1023/a:1011274922701. [DOI] [PubMed] [Google Scholar]
- 42.Franceschi S, Serraino D, Bidoli E, et al. The epidemiology of non-Hodgkin’s lymphoma in the north-east of Italy: a hospital-based case-control study. Leuk Res. 1989;13:465–72. doi: 10.1016/0145-2126(89)90168-9. [DOI] [PubMed] [Google Scholar]
- 43.Fritschi L, Benke G, Hughes AM, et al. Risk of non-Hodgkin’s lymphoma associated with occupational exposure to solvents, metals, organic dusts and PCBs (Australia) Cancer Causes Control. 2005;16:599–607. doi: 10.1007/s10552-004-7845-0. [DOI] [PubMed] [Google Scholar]
- 44.Glass DC, Gray CN, Jolley DJ, et al. Leukemia risk associated with low-level benzene exposure. Epidemiology. 2003;14:569–77. doi: 10.1097/01.ede.0000082001.05563.e0. [DOI] [PubMed] [Google Scholar]
- 45.Kato I, Koenig KL, Watanabe-Meserve H, et al. Personal and occupational exposure to organic solvents and risk of non-Hodgkin’s lymphoma (NHL) in women (United States) Cancer Causes Control. 2005;16:1215–24. doi: 10.1007/s10552-005-0385-4. [DOI] [PubMed] [Google Scholar]
- 46.Mao Y, Hu J, Ugnat AM, et al. Non-Hodgkin’s lymphoma and occupational exposure to chemicals in Canada. Canadian Cancer Registries Epidemiology Research Group. Ann Oncol. 2000;11(Suppl. 1):69–73. [PubMed] [Google Scholar]
- 47.Persson B, Fredrikson M. Some risk factors for non-Hodgkin’s lymphoma. Int J Occup Med Environ Health. 1999;12:135–42. [PubMed] [Google Scholar]
- 48.Scherr PA, Hutchison GB, Neiman RS. Non-Hodgkin’s lymphoma and occupational exposure. Cancer Res. 1992;52(19 Suppl.):5503s–9s. [PubMed] [Google Scholar]
- 49.Schnatter AR, Armstrong TW, Nicolich MJ, et al. Lymphohaematopoietic malignancies and quantitative estimates of exposure to benzene in Canadian petroleum distribution workers. Occup Environ Med. 1996;53:773–81. doi: 10.1136/oem.53.11.773. [DOI] [PMC free article] [PubMed] [Google Scholar]
- 50.Seidler A, Mohner M, Berger J, et al. Solvent exposure and malignant lymphoma: a population-based case-control study in Germany. J Occup Med Toxicol. 2007;2:2. doi: 10.1186/1745-6673-2-2. [DOI] [PMC free article] [PubMed] [Google Scholar]
- 51.Collingwood KW, Raabe GK, Wong O. An updated cohort mortality study of workers at a northeastern United States petroleum refinery. Int Arch Occup Environ Health. 1996;68:277–88. doi: 10.1007/BF00409412. [DOI] [PubMed] [Google Scholar]
- 52.Consonni D, Pesatori AC, Tironi A, et al. Mortality study in an Italian oil refinery: extension of the follow-up. Am J Ind Med. 1999;35:287–94. doi: 10.1002/(sici)1097-0274(199903)35:3<287::aid-ajim9>3.0.co;2-f. [DOI] [PubMed] [Google Scholar]
- 53.Dagg TG, Satin KP, Bailey WJ, et al. An updated cause specific mortality study of petroleum refinery workers. Br J Ind Med. 1992;49:203–12. doi: 10.1136/oem.49.3.203. [DOI] [PMC free article] [PubMed] [Google Scholar]
- 54.Divine BJ, Hartman CM, Wendt JK. Update of the Texaco mortality study 1947–93: Part I. Analysis of overall patterns of mortality among refining, research, and petrochemical workers. Occup Environ Med. 1999;56:167–73. doi: 10.1136/oem.56.3.167. [DOI] [PMC free article] [PubMed] [Google Scholar]
- 55.Honda Y, Delzell E, Cole P. An updated study of mortality among workers at a petroleum manufacturing plant. J Occup Environ Med. 1995;37:194–200. doi: 10.1097/00043764-199502000-00020. [DOI] [PubMed] [Google Scholar]
- 56.Huebner WW, Wojcik NC, Rosamilia K, et al. Mortality updates (1970–1997) of two refinery/petrochemical plant cohorts at Baton Rouge, Louisiana, and Baytown, Texas. J Occup Environ Med. 2004;46:1229–45. [PubMed] [Google Scholar]
- 57.Kaplan SD. Update of a mortality study of workers in petroleum refineries. J Occup Med. 1986;28:514–16. doi: 10.1097/00043764-198607000-00012. [DOI] [PubMed] [Google Scholar]
- 58.Lewis RJ, Schnatter AR, Katz AM, et al. Updated mortality among diverse operating segments of a petroleum company. Occup Environ Med. 2000;57:595–604. doi: 10.1136/oem.57.9.595. [DOI] [PMC free article] [PubMed] [Google Scholar]
- 59.Pukkala E. Cancer incidence among Finnish oil refinery workers, 1971–1994. J Occup Environ Med. 1998;40:675–9. doi: 10.1097/00043764-199808000-00003. [DOI] [PubMed] [Google Scholar]
- 60.Satin KP, Wong O, Yuan LA, et al. A 50-year mortality follow-up of a large cohort of oil refinery workers in Texas. J Occup Environ Med. 1996;38:492–506. doi: 10.1097/00043764-199605000-00010. [DOI] [PubMed] [Google Scholar]
- 61.Thomas TL, Waxweiler RJ, Moure-Eraso R, et al. Mortality patterns among workers in three Texas oil refineries. J Occup Med. 1982;24:135–41. [PubMed] [Google Scholar]
- 62.Tsai SP, Gilstrap EL, Cowles SR, et al. A cohort mortality study of two California refinery and petrochemical plants. J Occup Med. 1993;35:415–21. [PubMed] [Google Scholar]
- 63.Tsai SP, Wendt JK, Cardarelli KM, et al. A mortality and morbidity study of refinery and petrochemical employees in Louisiana. Occup Environ Med. 2003;60:627–33. doi: 10.1136/oem.60.9.627. [DOI] [PMC free article] [PubMed] [Google Scholar]
- 64.Waxweiler RJ, Alexander V, Leffingwell SS, et al. Mortality from brain tumor and other causes in a cohort of petrochemical workers. J Natl Cancer Inst. 1983;70:75–81. [PubMed] [Google Scholar]
- 65.Wong O, Harris F, Rosamilia K, et al. An updated mortality study of workers at a petroleum refinery in Beaumont, Texas, 1945 to 1996. J Occup Environ Med. 2001a;43:384–401. doi: 10.1097/00043764-200104000-00017. [DOI] [PubMed] [Google Scholar]
- 66.Wong O, Harris F, Rosamilia K, et al. Updated mortality study of workers at a petroleum refinery in Torrance, California, 1959 to 1997. J Occup Environ Med. 2001b;43:1089–102. doi: 10.1097/00043764-200112000-00011. [DOI] [PubMed] [Google Scholar]