

Abstract
Cichlid fishes are famous for large, diverse and replicated adaptive radiations in the Great Lakes of East Africa. To understand the molecular mechanisms underlying cichlid phenotypic diversity, we sequenced the genomes and transcriptomes of five lineages of African cichlids: the Nile tilapia (Oreochromis niloticus), an ancestral lineage with low diversity; and four members of the East African lineage: Neolamprologus brichardi/pulcher (older radiation, Lake Tanganyika), Metriaclima zebra (recent radiation, Lake Malawi), Pundamilia nyererei (very recent radiation, Lake Victoria), and Astatotilapia burtoni (riverine species around Lake Tanganyika). We found an excess of gene duplications in the East African lineage compared to tilapia and other teleosts, an abundance of non-coding element divergence, accelerated coding sequence evolution, expression divergence associated with transposable element insertions, and regulation by novel microRNAs. In addition, we analysed sequence data from sixty individuals representing six closely related species from Lake Victoria, and show genome-wide diversifying selection on coding and regulatory variants, some of which were recruited from ancient polymorphisms. We conclude that a number of molecular mechanisms shaped East African cichlid genomes, and that amassing of standing variation during periods of relaxed purifying selection may have been important in facilitating subsequent evolutionary diversification.
Wide variation in the rates of diversification among lineages is a feature of evolution that has fascinated biologists since Darwin1,2. With approximately 2,000 known species, hundreds of which coexist in individual African lakes, cichlid fish are amongst the most striking examples of adaptive radiation, the phenomenon wherebya single lineage diversifies into many ecologically varied species in a short span of time3 (Fig. 1). The largest radiations, which inLakesVictoria, Malawi and Tanganyika, have generated between 250 (Tanganyika) and 500 (Malawi and Victoria) species per lake, took no more than 15,000 to 100,000 years for Victoria and less than 5 million years for Malawi3–5, but 10–12 million years for Lake Tanganyika6. The radiations in Lake Victoria and Malawi thus display the highest sustained rates of speciation known to date invertebrates7. The evolution of these lineages and their genomes has presumably been shaped by cycles of population expansion, fragmentation and contraction as lineages colonized lakes, diversified, collapsed when lakes dried up, and re-colonized lakes, and by episodic adaptation to a multitude of ecological niches coupled with strong sexual selection. Genetic diversity within lake radiations has been influenced by admixture following multiple colonization events and periodic infusions through hybridization8,9.
Figure 1. The adaptive radiation of African cichlid fish.

Top left, map of Africa showing lakes in which cichlid fish have radiated. Right, the five sequenced species: Pundamilia nyererei (endemic of Lake Victoria); Neolamprologus brichardi (endemic of Lake Tanganyika); Metriaclima zebra (endemic of Lake Malawi); Oreochromis niloticus (from rivers across northern Africa); Astatotilapia burtoni (from rivers connected to Lake Tanganyika). Major ecotypes are shown from each lake: a, pelagic zooplanktivore; b, rock-dwelling algaescraper; c, paedophage (absent from Lake Tanganyika); d, scale eater; e, snail crusher; f, reef-dwelling planktivore; g, lobe-lipped insect eater; h, pelagic piscivore; i, ancestral river-dweller also found in lakes (absent from Lake Tanganyika). Bottom left, phylogenetic tree illustrating relationships between the five sequenced species (red), major adaptive radiations and major river lineages. The tree is from ref. 4, pruned to the major lineages. Upper timescale (4), lower timescale (32). Photos by Ad Konings (Tanganyika a, b, d, e, g, h; Malawi a, c, d, e, f, g, h, i), O.S. (Victoria a–g, i; Malawi b), Frans Witte (Victoria h), W.S. (Tanganyika f), Oliver Selz (Victoria f, A. burtoni), Marcel Haesler (O. niloticus).
Cichlid phenotypic diversity encompasses variation inbehaviour,body shape, coloration and ecological specialization. The frequent occurrence of convergent evolution of similar ecotypes (Fig. 1) suggests a primary role of natural selection in shaping cichlid phenotypic diversity10,11. In addition, the importance of sexual selection is demonstrated by a profusion of exaggerated sexually dimorphic traits like male nuptial colour and elaborate bower building by males3. Ecological and sexual selection converge in the cichlid visual system, where trichromatic colour vision, eight different opsin genes and novel spherical lenses promote sensitivity in the highly dimensional visual world of clear-water lakes12–14. Rapidly evolving sex determination systems, often linked to male and female colour patterns, may also speed cichlid diversification15,16. Ecological, social and behavioural variation correlates with striking diversity in brain structures17 that appears early in development18.
Exceptional phenotypic variation, even among closely related species, makes cichlids different from most other fish groups, including those that share the same habitats with them but have not diversified as much, as well as those that have radiated into much smaller species flocks in northern temperate lakes19. However, how cichlids evolve in this exceptionally highly dimensional phenotype space remains unexplained.
We sequenced the genomes of five representative cichlid species from throughout the East African haplo-tilapiine lineage (Extended Data Fig 1a), which gave rise to all East African cichlid radiations. These five lineages diverged primarily through geographical isolation, and three of them subsequently underwent adaptive radiations in the three largest lakes of Africa (Fig. 1). Here we describe the comparative analyses of the five genomes coupled with an analysis of the genetic basis of species divergence in the Lake Victoria species flock to examine the genomic substrate for rapid evolutionary diversification.
Accelerated gene evolution
To assess whether accelerated sequence evolution was a general feature of East African cichlids, we annotated the genomes of all five cichlids (Extended Data Fig. 1a) and estimated the non synonymous/synonymous nucleotide substitution (dN/dS) ratioby sampling the concatenated alignments of all genes annotated with particular gene ontology (GO) terms. An elevated rate of nonsynonymous nucleotide substitutions can indicate accelerated evolution (either due to relaxed constraint or positive selection); this approach has been applied previously in the context of cichlid vision13 and morphology20,21. We obtained significantly higher dN/dS ranks in O.niloticus (89terms) compared to stickleback (11 terms), but considerably higher ranks still in the lineages of the East African radiation, haplochromines (299 terms) and N. brichardi (254 terms), (Extended Data Fig. 1b). In general, terms involved in morphological and developmental processes ranked significantly higher in haplochro-mines than in O. niloticus (P value = 0.036, Mann–Whitney U-test).
Amongst protein-coding genes with an increased number of non-synonymous variants in haplochromines compared to N. brichardi and O. niloticus, twodevelopmentalgenes, nog2 and bmpr1b, emerged showing haplochromine-specific substitutions. This result is notable given that three genes, a ligand (bmp4)21, a receptor (bmpr1b) and an antagonist (nog2) in the BMP pathway, all known to influence cichlid jaw morphology, show accelerated rates of protein evolution in haplochromine cichlids.
Of 22 candidate genes previously identified in teleost morphogenesis, vision and pigmentation, three are predicted to have undergone accelerated evolution in the common ancestors of the East African radiations suggesting a role in the diversification of cichlids: endothelin receptor type B1(ednrb1) affects colour patterning22 and perhaps pharyngealjaw development (Extended Data Fig. 2); green-sensitive opsin (kfh-g) and Rhodopsin (rho) are proteins important in vision.
Gene duplication
Gene duplication allows for subsequent divergent evolution of the resultant gene copies, enabling functional innovation of the proteins and/or expression patterns23. East African cichlids, including Oreochromis niloticus, possess an unexpectedly large number of gene duplicates. We find 280 duplications in the lineage leading to the common ancestor of the lake radiations and 148 events in the common ancestor of the haplochro-mines. When normalizing for branch lengths this corresponds to an approximately 4.5- to 6-fold increase in gene duplications that occurred in the common ancestor of the East African lake radiations relative to older clades, and an even higher duplication rate inthe common ancestor of just the haplochromines (Fig. 2, Extended Data Fig. 3a–c).
Figure 2. Gene duplication in the ancestry of East African lake cichlids.

Black numbers represents species divergence calculated as neutral genomic divergence between the sequenced species using ~2.7 million fourfold degenerate sites from the alignment of 9 teleost genomes. This neutral substitution model suggests ~2% pairwise divergence between the three haplochromines and a ~6% divergence to N. brichardi. Red numbers represent duplicated genes. Asterisks indicate excluded branches owing to incomplete lineage sorting in haplochromines or weak support of consensus species tree.
Inferred duplication rates in ancestral populations exceeded those in the extant taxa (Fig. 2). This could reflect the technical challenge of separating young, near-identical gene paralogues or true reduced rates in eachlake radiation. Additionally, we could be underestimating lineage-specific rates of duplication owing to the sampling of a single species per radiation, if duplications accumulate during speciation but only some become fixed.
Cichlid-specific gene duplicates do not show statistically significant enrichment for particular gene categories (Supplementary Information). Expansion of the olfactory receptor gene family, whichis a frequent feature of vertebrate evolution24, was also seen in O. niloticus, but not in any of the lake cichlids (Extended Data Fig. 4; Supplementary Information). Retained duplicated genes are known to often diverge in function through neo- or subfunctionalization25, and this has been suggested as part of the reason why bony fish generally are sospecies-rich (morethan 50% of all known species of vertebrates are fish). Moreover, differential retention of alternative copies of duplicated genes through the process of divergent resolution has been suggested to promote speciation rates directly26.
Differences in the expression patterns of duplicate genes may contribute to evolutionary divergence of species. The expression patterns of 888 duplicate gene pairs fromthe common ancestor of the East Africa cichlids were categorized according to whether they are expressed widely among tissues (52.8%), are similarly restricted in their expression patterns for both gene copies (26.6%), or, in at least one gene copy, have newly gained expression in one or more tissues (20.6%). 7.5% of duplicates lost or gained complete tissue specificity, many (43%) of which have gained specific expression in the testis. In each of the stomatin and RNF141 gene pairs, one gene copy is broadly expressed whereas expression of the other is restricted to the testis (Extended Data Fig. 3d). RNF141 is the zebrafish orthologue of the human ZNF230, a transcription factor suggested to have a role during spermatogenesis. This observation is particularly interesting in the context of strong sexual selection14 observed in many East African cichlids15,16, including our sequenced species with the exception of N. brichardi.
Transposable element insertions alter gene expression
As in other teleosts, approximately 16–19% of the four East African cichlid genomes consist of transposable elements (TEs), and over 60% of cichlid TEs are DNA transposons (Extended Data Fig. 5; Supplementary Information). Three waves of TE insertions were detected in each of the cichlid genomes (Extended Data Fig. 6a–f), including a cichlid-specific burst of the Tigger family27. Notably, this TE family has continued expanding in the youngest radiation, Lake Victoria (Extended Data Fig. 6a).
We analysed the distribution of TE insertions near the 5′ untranslated region (5′ UTR; 0–20 kilobases upstream), or 3′ UTR (0–20 kb downstream) oforthologous gene pairs. We find that genes with TE insertions near the 5′ UTRs are significantly associated with increased gene expression in all tissues (false discoveryrate (FDR) < 0.05, Mann–Whitney test, Extended Data Fig. 7a) compared to genes without TE insertions. In contrast, TE insertions near 3′ UTRs are significantly associated with increased gene expression in all tissues except brain and skeletal muscle (FDR < 0.05, Mann–Whitney U-test).
Generally, when inserted within or near genes in the transcriptional sense orientation, TE insertions show the expected pattern of purifying selection. Such TEs often contain polyadenylation signals that result in transcriptional arrest27. In all five cichlid species, intronic TE insertions occur preferentially in the antisense orientation of protein-coding genes, with the strongest bias being observed for long terminal repeats (LTRs) or long interspersed nucleotide repetitive elements (LINEs) (Extended Data Fig. 7b). As expected, intronic DNA transposons and LINEs or LTRs present in intergenic regions fail to show a significant orientation bias, and short interspersed nucleotide repetitive elements (SINE) show a moderate bias for sense insertions (Extended Data Fig. 7c).
Surprisingly, none of the five cichlid genomes showed any deficit of sense-oriented LINE insertions with approximately 15% divergence, which correspond to a time of transposable element insertions in the common ancestor of the haplo-tilapiine cichlids (Extended Data Fig. 7d). This suggests that ancestral East African cichlids went through an extended period of relaxed purifying selection during which overall TE activity increased (Extended Data Fig. 6a–f). However, in more recent history, haplochromine cichlids showed an increased efficiency in purging potentially deleterious TE insertions (Extended Data Fig. 7d).
Divergence of regulatory elements
Toidentify potential regulatory sequences that have diverged amongthe East African cichlids, we first predicted conserved noncoding elements (CNEs)28 in Nile tilapia and eight other teleosts using a 9-way alignment of teleost genomes (zebrafish, Tetraodon, stickleback, medaka and the five cichlids; Supplementary Information). We then identified 13,053 highly conserved noncoding elements (hCNEs) in tilapia and medaka. These are expected to be similarly conserved among the four East African lake cichlids as they shared a common ancestor with Nile tilapia more recently than with medaka. Among these hCNEs we searched for CNEs that exhibited significant changes (accelerated CNEs, aCNEs) (FDR-adjusted P < 0.05). A total of 625 such aCNEs (4.8%) were found to have diverged in one or more of the East African lake cichlids. Whereas the majority of aCNEs (93%) have experienced a higher rate of nucleotide substitutions, approximately a quarter have also experienced insertions (23%) and/or deletions (32%), again suggesting relaxed purifying selection. The aCNEs are distributed in intergenic regions(70%), introns(28%) and UTRs (2%) of protein-coding genes (Supplementary information).
The largest number of aCNEs is found in N. brichardi (n = 214), with lower numbers found in A. burtoni (n = 140), P. nyererei (n = 129) and M. zebra (n = 142). Approximately 60% of the aCNEs (n = 370) are accelerated in only one lineage. The remaining aCNEs have either accumulated mutations independently in several lineages, or their accelerated evolution was initiated in a common ancestor.
The majority of aCNEs in lake cichlids showed enrichment for nearby genes involved in ‘homophilic cell adhesion’ (P = 5.8 × 10⁻⁴) and ‘G-protein coupled receptor activity’ (P = 6.4 × 10⁻⁴). To verify the cis-regulatory function of these aCNEs, we assayed the ability of six selected aCNEs and their corresponding O. niloticus hCNEs to drive reporter gene expression in transgenic zebrafish. The assays not only indicated their potential to function as enhancers, but also demonstrated that aCNEs have altered the expression pattern compared to their homologous hCNEs, indicating their potential for altering expression of their target genes in a tissue-specific manner. We illustrate this with an example in Extended Data Fig. 8 (additional examples in Extended Data Fig.9).
Novel microRNAs alter gene expression
MiRNAs offer yet another effective way of altering gene expression programs. We identified 1,344 miRNA loci (259–286 per cichlid species) from deep sequencing of small RNAs in late stage embryos (Extended Data Fig. 10a). By comparing these loci with known teleost microRNAs (Supplementary Information) we discovered: (1) 40 cases of de novo miRNA emergence and nine cases of apparent miRNA loss; (2) four distinct mature miRNAs with mutation(s) in the seed sequence; (3) at least 9 cases of arm switching29, (4) one case of seed shifting29, and (5) 92 distinct miRNAs with mutation(s) outside the seed sequence.
We explored miRNA spatial expression patterns in one case of arm switching (t_mze-miR-7132a-5p and t_mze-miR-7132a-3p) andfor four de novo miRNAs (Fig. 3 and Extended Data Fig. 10). In the case of arm switching, spatial expression of the miRNA is clearly differentiated between the two pairs, consistent with results described previously30. The spatial expression of the four de novo miRNAs (miR-10029, miR10032, miR-10044, miR-10049) isconfined to specific tissues (for example, fins, facial skeleton, brain) and is strikingly complementary to genes predicted to contain target sites for these miRNAs (miR-10032 targets neurod2, and miR-10029 targets bmpr1b). The neurod2 gene is known to be involved in brain development and neural differentiation whereas bmpr1b, previously described amongst the fast evolving genes, is implicated in the development and morphogenesis of nearly all organ systems.
Figure 3. Novel cichlid microRNAs.
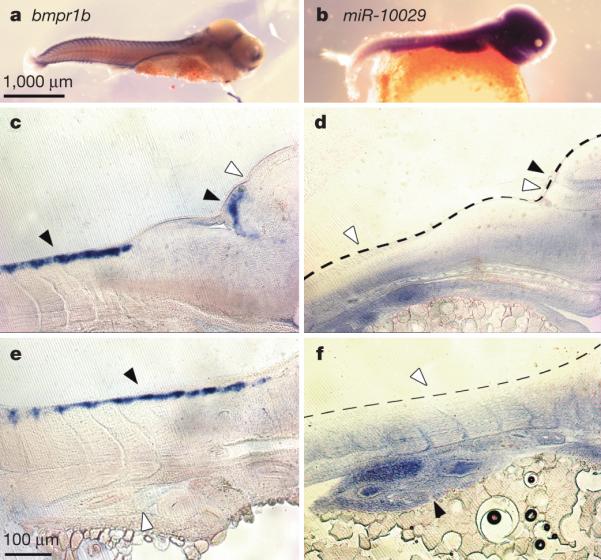
a–f, Complementary expression of mir-10029 (b, d, f) and its predicted target gene bmpr1b (a, c, e) in stage 18 (6 days post-fertilization) Metriaclima zebra embryos. c–f are 18-μm sagittal sections. In c and d arrows point to expression (black) or lack of expression (white) in the somites, presumptive cerebellum, and optic tectum (from left to right). In e and f, arrows point to expression and lack of expression in the somites (dorsal) and the gut (ventral). In all panels, anterior is to the right.
Extensive shared polymorphisms
Owing to their relatively recent divergence time and the potential for gene flow between lakes8,9,31, we predicted widespread incomplete lineage sorting (ILS) among haplochromine cichlids. We found that nearly half (43%) of the nucleotides sequenced are incompletely sorted amongst the three haplochromines (Fig. 4a). Furthermore, assuming a constant mutation rate, and an A. burtoni–M. zebra–P. nyererei speciation event ~10 million years ago (Myr ago) (ranging from 7 Myr ago to 15 Myr ago depending on whether Gondwana rifting dates are included or excluded from calibration32), we predict the subsequent speciation event between the lineages to which M. zebra and P. nyererei belong to about 8.5 Myr ago (Supplementary Information). The degree of ILS is highly variable across chromosomes. Compared to intergenic regions, coding regions were found to be slightly, yet significantly, depleted in ILS (43.5% vs 41.0%, P < 0.001). Reduction ofILS in coding versus noncoding regions in allopatric lineages of haplochromine cichlids is less than that found inthe similarly divergent primate trio,gorilla–chimpanzee–human (30% vs 22%)33. This suggests that natural selection has been a more efficient force on primate genomes than on the allopatrically diverging genomes of the haplochromine cichlid lineages, with important implications for genetic diversity in the radiations to which these lineages gave rise.
Figure 4. Genomic divergence stems from incomplete lineage sorting (ILS) and both old and novel coding and noncoding variation.

a, Coalescence times and trees supporting ILS among the genomes of allopatric East African cichlid lineages were inferred by coalHMM. The most common genealogy matches the known species tree and represents a M. zebra–P. nyererei coalescence that falls between the two speciation times, Tzn (speciation M. zebra–P. nyererei) and Tznb (speciation M. zebra–P. nyererei–A. burtoni). In genealogies 1 (dashed line), 2, and 3, all coalescence events are ancient and occur before time Tznb. b, Phylogenetic analysis of RAD-sequence data showing well-supported differentiation among young Victoria species. The complete data set (top) renders the genus Mbipia non-monophyletic, exclusion of the top 1% divergent loci (bottom) supports monophyly of each genus. c, Genomic divergence in paired comparisons of Lake Victoria cichlids (per-site FST; black/grey are chromosomes). Sister species from top: Pundamilia nyererei/P. pundamilia and Mbipia lutea/M. mbipi differ in male breeding coloration but have conserved morphology; Neochromis omnicaeruleus/N. sp. “unicuspid scraper” and distant relatives P. pundamilia/M. mbipi and P. nyererei/M. lutea have similar coloration but differ in morphology. Red-highlighted SNPs indicate significantly divergent sites between colour-contrasting species, but not between same-colour species. Bar plots show the proportion of SNPs in four annotation categories: exons (orange), introns (dark blue), 25-kb flanking genes (turquoise), or none of the above (grey), for thresholds of increasing FST. In “All sites” and “Ancient variant sites” analyses, symbols indicate an excess of SNPs in a given annotation category compared to expectations from the full data set or from all non-ancient variant sites, respectively (FDR q-values: *q < 0.05; †q = 0.05), (Supplementary Information, Data Portals, Supplementary Population Genomics FTP files).
Lake Victoria, a recent evolutionary radiation
Cichlid fish adaptive radiationis characterized by rapid speciation without geographical isolation. In Lake Victoria, several hundred endemic species emerged within the past 15,000–100,000 years34. We analysed patterns of genome-wide genetic variation in six sympatric and closely related species of the genera Pundamilia, Mbipia and Neochromis, all of which are endemic to Lake Victoria. We used the P. nyererei genome to investigate the pattern and magnitude of genomic differentiation in pairwise species comparisons. We then further characterized the regions of genomic differentiation to learn about: (1) the genomic distribution of diver-gent sites putatively under selection;(2) their nature (coding vs regulatory); (3) whether diversification occurred by selection on old standing variation, newer mutations or both.
Divergent selection on many genes
Analyses of restriction-site-associated DNA (RAD) data showed that the average genome-wide divergence was significant in all pairwise speciescomparisons(P < 0.001). In each pairwise comparison, we find many SNPs with high fixation index (FST) values distributed across all chromosomes (Fig. 4c). In each pair, 250 to 439 of these SNPs constitute significant outliers from the FST distribution (FDR < 5%; Fig. 4c), and BAYESCAN results indicate numerous loci under selection. Phylogenetic trees reconstructed from the concatenated RAD sequence data resolve species with high bootstrap support35, and loci putatively under selection play a strong role in differentiating species (Fig. 4b). Taken together, these results suggest that even the most recent rapid speciation in African lake cichlids is associated with genomically widespread divergence. Fixation of alternative alleles between species happens but is restricted to a minority of the many divergent loci, consistent with models of polygenic adaptation from standing genetic variation36.
We used the annotated P. nyererei reference genome to identifygenes that diverged during and soon after speciation for three sister species pairs and two pairs of more distant relatives (Fig. 4c). We annotated all SNPs according to their positions in exons and potential cis-regulatory elements (in introns and 25 kb either side of genes), and analysed the proportion of SNPs in each category over increasing FST. In both pairs of sister species that differ primarily in male breeding coloration, the proportion of SNPs in exons increases from <10% in the fullset of SNPs, to > 18% at highly divergent SNPs. In the species that have diverged primarily in morphology, we find no exonic variants among highly divergent SNPs, and an increasing proportion of SNPs in introns with increasing FST (Fig. 4c).
These data suggest contrasting genomic mechanisms underlying phenotypic evolution depending on whether speciation is driven primarily by divergence of coloration and associated traits or by divergence of morphology associated with feeding ecology. This supports two predictions from evolutionary developmental biology37: (1) variation in coding sequence is most likely to be involved in the divergence of physiological and/or terminally differentiated traits like colour; (2) regulatory variation is more important in morphological changes involving genes that have pleiotropic effects in developmental networks.
For the Pundamilia species pair, putative regulatory SNPs with FST values significantly greater than zero show enrichment in conserved transcription factor binding sites and PhastCon elements (conserved elements across 46 vertebrate species), supporting a regulatory role for these variants. GO term enrichment analyses indicate that exonic SNPs are associated with metabolism and biosynthesis processes, while putative regulatory SNPs are associated with terms related to morphogenesis and development.
Comparing FST for each SNP in all six pairwise comparisons of the Mbipia and Pundamilia species revealed 3 candidate regulatory SNPs on LG6, 7 and 22 that are highly divergent in all comparisons of species with different colours, but not significantly differentiated between species with similar colours (Fig. 4c). The SNP on LG7 falls within a known quantitative trait locus (QTL) intervalfor yellowversus blue colour (and sex determination) in Malawi cichlids15. None of these SNPs are fixed differences between species, suggesting polygenic adaptation.
Sorting of ancient polymorphisms
To investigate whether ancient genetic variation, predating the origin of the Lake Victoria species flock, was an important source ofalleles that are divergently sorted during speciation, for SNPs in each of the three Victoria sister species pair comparisons, we identified orthologous sites among the four other cichlid genomes. We find 14–15% of all Victoria SNPs are also variable among the other cichlid genomes. Among these ‘ancientvariants’, the proportion of SNPs in exons increases from 9–15% among all sites to 30–100% at highly divergent SNPs in both pairs of sister species that differ primarily in male breeding coloration (Fig. 4c). Among the ancient exonic variants that became fixed in the red/blue Pundamilia speciation event is srd5a2b, a teleost-specific duplicate of srd5a2 which, in mammals, converts testosterone to dihydrotestosterone and has been implicated in sexual differentiation38. In the blue sister species thathave diverged primarily in morphology,twoancient variants in potential cis-regulatory regions are highly divergent despite incomplete reproductive isolation among these incipient species39 (Fig. 4b). We compared the proportions of putative ancient variants to all SNPs between annotation categories, and findevidence for higher proportions of ancient variants in gene-associated regions than in non-genic regions (likelihood ratio tests on 2 × 2 contingency tables; exons: Pundamilia P = 0.016, Neochromis P = 0.015; flanking regions: Pundamilia P = 0.020; all other P > 0.1).
These analyses suggest that the genomic substrate for adaptive radiation includes ample coding and regulatory polymorphism, likely to be present well before the start of the radiations, some of which became subsequently sorted during species divergence.
Conclusions
In African lakes, nearly 1,500 new species of cichlid fish evolved in a few million years when environmentally determined opportunity for sexual selection and ecological niche expansion4 was met by an evolutionary lineage with unusual potential to adapt, speciate and diversify. Our analyses of five cichlid species representing five different lineages in the haplo-tilapiine clade, some of which gave rise to radiations, and of six closely related species from the most recent radiation, shed light into the complex genomic mechanisms that may give East African cich-lids their unusual propensity for diversification.
We provide evidence for accumulation of genetic variation under relaxed constraint preceding radiation and involving multiple evolutionary mechanisms, including accelerated evolution of regulatory and coding sequence, increased gene duplication, TE insertions, novel micoRNAs and retention of ancient polymorphisms, possibly including interspecific hybridization. In addition, our data on genomic divergence within the Lake Victoria species flock suggest that adaptive radiation within the lakes is associated with divergent selection on many regions in the genome, both coding and regulatory, often recruiting old alleles from standing variation.
We conclude that neutral and adaptive processes both make important contributions to the genetic basis of cichlid radiations, but their roles are distinct and their relative importance has changed through time: neutral(andnon-adaptive) processes seem to have been crucial to amassing genomic variation, whereas selection subsequently sorted some of this variation. The interaction of both is likely to have been necessary for generating many and diverse new species in very short periods of time.
Extended Data
Extended Data Figure 1. Genome assembly and evolutionary rates.

a, Genome assembly and annotation. b, Genome-wide dN/dS. Rates are calculated from 20 resampled sets of 200 orthologous genes. Gene annotations from interspecies projections (see Methods in Supplementary Information) were excluded from the data set.
Extended Data Figure 2. Rapid Evolution of EDNRB1.

a, Alignments of EDNRB1 in cichlids with human (HS), zebrafish (DAR) and medaka (ORL). Black star denotes site shown to be required to activate SRF in human by interacting with the G protein G13 (ref. 40). Red star denotes site that may affect the anchoring of the C terminus of EDNRB1to the transmembrane domain41. Highlighted are amino acid substitution in the ancestor of haplochromine and lamprologini (blue) and in the ancestor of haplochromine (red). b, Location of substitutions on 7 transmembrane domain representation (Adapted from ref. 42 Science 318, 1453–1455. Reprinted with permission from AAAS.). c, Sites (spheres) on the structure of the human kappa opioid receptor in complex (4DJH). Only the right homodimer is annotated.
Extended Data Figure 3. Duplication in the cichlid genomes.

a, The number of the recently duplicated genomic regions identified by the read depth method in the five East African cichlid genomes. The numbers in red is the number of duplicated genes and the numbers in black is the corresponding branch length. b, Summary of duplication regions in the five African cichlid genomes. c, Venn diagram of the duplicated genes detected by aCGH across cichlid species relative to O. niloticus. d, Expression patterns of duplicate genes. Matrix represents the expression level of retained duplicate genes from the cichlid common ancestor in the specified tissues. Expression is showed as an inverse logit function of log2-transformed, relative sequence fragment numbers. Uncoloured fields designate missing expression data or absence of either of the paralogue copies in the annotation set.
Extended Data Figure 4. Cichlid OR and TAAR genes.

a, Cichlid OR and TAAR genes identified in this study. b, PHYML tree based on the fish TAAR and OR amino acid sequences. A phylogeny tree was constructed with all OR and TAAR cichlid proteins identified in this study (n = 503 + 119) plus 229 OR and 173 TAAR genes identified in zebrafish, fugu, tetraodon, medaka and stickleback. The amino-acid sequences were aligned with MAFFT version 7 and a tree constructed with PHYML and visualized with Fig Tree (version 1.3.1). The TAAR branches are in pink and the OR branches in blue or yellow. Colours indicate the composition of the branches. Dark blue branches are made of cichlid OR only, light blue indicates the presence of cichlid and model fish OR proteins. Yellow is for branches made of OR model fish proteins, only. Light pink branches correspond to cichlid and model fish TAAR proteins and dark pink to model fish TAAR proteins only. Letters correspond to family names.
Extended Data Figure 5. Comparison of TEs among cichlids and other vertebrate genomes.

a, Repeat content of selected vertebrate genomes. Table, no legend. b, Proportions of TEs in the genomes. c, Proportions of each TE class among all TEs. The TE proportions are much lower in cichlid genomes than that in zebrafish.
Extended Data Figure 6. A comparison of TEs in the African cichlids and Medaka genomes.

a–f, The x-axis indicates a specific TE family at a given divergence from the consensus sequence and y-axis indicates its percentage of the genome.
Extended Data Figure 7. Cichlid transposable elements.

a, Association between TE insertions and gene expression levels of orthologous genes. All 5 cichlids are merged into the same data set. Groupings are based on whether one gene copy lies within 20 kb up or downstream of a TE. b, Orientation bias of transposable elements within or near non-duplicated genes. TE orientation bias in intron sequence of 5 cichlid species. Bias is shown as log2(sense/antisense) of TE counts. c, Orientation bias of transposable elements in introns of protein coding genes. The x-axis denotes the maximum age of the TEs as divergence from the consensus sequence. The y-axis shows the proportion of TE insertions in the sense of transcription. Data points with large confidence intervals (exceeding the display range) are omitted. d, Orientation bias of LINE insertions in introns in 4% divergence wide windows in O. niloticus, N. brichardi and combined haplochromines. Proportion of sense oriented LINEs in introns is shown on the y-axis. Age is shown on the x-axis as percent divergence from the TE consensus.
Extended Data Figure 8. Reporter gene expression of a selectedO. niloticus hCNE–P. nyererei aCNE pair in transgenic zebrafish.

a, O. niloticus Pbx1a locus showing the conservation track and alignment of an hCNE (LG18.20714) in O. latipes and East Africa cichlids. b, Reporter gene expression in 72 hours post-fertilization (hpf) G1 transgenic zebrafish. Expression is shown for the hCNE in O. niloticus and the corresponding aCNE in P. nyererei. The P. nyererei aCNE also shows expression in circulating blood cells.
Extended Data Figure 9. Reporter gene expression of a selected hCNE–aCNE pairs in transgenic zebrafish (G0).

a, b, Comparison of expression pattern driven by O. niloticus and N. brichardi aCNE #911 (UNCX locus) in 72 hours post-fertilization (hpf) zebrafish embryos. c, d, Comparison of expression pattern driven by tilapia and N. brichardi aCNE #7012 (SERPINH1 locus) in 72 hpf zebrafish embryos. e, f, Comparison of expression pattern driven by tilapia and N. brichardi aCNE #1649 (TBX2 locus) in 72 hpf zebrafish embryos. g, h, Comparison of expression pattern driven by tilapia and M. zebra aCNE #26432 (FOXP4 locus) in 72 hpf zebrafish embryos. i, j, Comparison of expression pattern driven by tilapia and A. burtoni aCNE #5509 (PROX1 locus) in 72 hpf zebrafish embryos.
Extended Data Figure 10. Cichlid microRNAs.

a, Novelty in microRNAs mapped on the phylogenetic tree of the five cichlid species. Complementary expression of novel cichlid miRNA mir-10032 (c, e, g) and predicted target gene neurod2 (b, d, f) in stage 23 (9–10 days post-fertilization) Metriaclima zebra embryos. d, e are 18-μm sagittal sections. In d and e, arrows point to expression in the medulla (left), cerebellum (middle) and optic tectum (right). neurod2 is expressed in the neural tube (b, f), while mir-10032 is expressed in the surrounding somites (c, g). In all panels, anterior is to the right.
Supplementary Material
Acknowledgements
We would like to thank the Broad Institute Genomics Platform for sequencing of the 5 cichlid genomes and transcriptomes. Sequencing, assembly, annotation and analysis by Broad Institute were supported by grants from the National Human Genome Research Institute (NHGRI). Genome evolution, duplication and TE analysis, ILS and ancient variant analyses were also supported by Swiss National Science Foundation grant PBLAP3-142774 awarded to D.B. and by University of Oxford Nuffield Department of Medicine Prize Studentship to Y.I.L. TE and copy number variation analyses were supported by the German Science Foundation (DFG), and advanced grant 29700 (“GenAdap”) by the European Research Council (ERC). CNE analysis and zebrafish functional assays were supported by the Biomedical Research Council of A*STAR, Singapore. MicroRNA sequencing and annotation was supported byERC Starting Grant to E.A.M.; M.M. was supported bya fellowship from the Wellcome Trust. MicroRNA and target in situ hybridization was supported by grant 2R01DE019637-04 to J.T.S. Population genomics analyses were supported by Swiss National Science Foundation grants 31003A-118293 and 31003A-144046 to O.S.
Footnotes
Author Contributions T.D.K., R.D.F., A.M., O.S., J.T.S., K.L.C., N.O., J.-F.B., D.J.P. and H.A.H. conceived the original tilapia white paper. F.D.P., K.L.-T. and E.S.L. revised, planned and oversaw the genome project. D.J.P., W.S., H. S. G., M.E.S., O.S., K.L.C., T.D.K., G.H., O.E. and H.A.H. provided tissues and RNAs for sequencing. C.A. prepared the high molecular weight tilapia DNA. M.L. extracted genomic DNA for sequencing. L.W. prepared 40-kb libraries (Fossils) for Illumina sequencing. R.S. performed quality control of RNA. J.A., J.J. and F.D.P. oversaw the sequencing and assembly of genomes and transcriptomes as well as submissions of data. J.T.M. and P.R. performed quality control of assemblies and alignments of genomes. J.M.T. performed de novo assembly of transcriptomes. M.C. performed quality control of tilapia and M. zebra assemblies. A.B., Sa.Y., I.M., S.G., D.P., F.J.R., T.S., Sh.Y. and D.B.J. assembled the genome. F.G., R.G., M.R., J.-F.B., H.D'C., C.O.-C. contributed to the tilapia radiation hybrid map. F.B.-H. and N.A. analysed the OR and TAAR gene families. B.A., T.H. and S.S. annotated the tilapia genome. D.B. and Y.I.L. annotated the N. brichardi and the lake cichlids. D.B. performed gene expression, genome evolution, gene duplication and TE insertion analyses. Y.I.L. and L. S.-P. performed quality control of RNA-seq data and assemblies, gene evolution, incomplete lineage sorting and ancient variant analyses. S.F., Oleg S. and A.M., N.O., M.N. and H.N. analysed the TE landscape of cichlid genomes. S.F., Oleg S. and A.M. performed the TE burst history analysis and analysed copy number variants using read depth. E.B. and S.C.P.R. analysed duplications by comparative genomic hybridization (aCGH). H.A.H. and R.M.H. performed PCR to validate the transcriptome. A.Y.N., Z.W.L., A.P.L. and B.V. performed conserved CNE analysis and functional assays of cichlid CNEs. M.M. and E.M. performed microRNA sequencing and annotation from embryos of cichlid species as well as target identification. R.A., F.J.T. and R.D.F. annotated adult brain microRNAs in A. burtoni. R.B., N.S.H. and J.T.S. performed microRNA and target gene in situ hybridization. O.S. designed and oversaw the population genomics data analysis from Lake Victoria species; L.G., S.M. and I.K. generated the data; C.E.W., I.K., H.J.N. and O.S. analysed the data. F.D.P., K.L.-T. and O.S. wrote the manuscript with input from D.B., C.E.W. and Y.I.L., I.K., J.T.S., W.H., C.P.P. as well as additional authors. L.G. assisted with figure preparation and coordination.
Author Information Genome assemblies and transcriptomes have been deposited in GenBank. The BioProject Identifiers are as follows. Genome sequencing: PRJNA59571 (SRP004171) for O. niloticus; PRJNA60365 (SRP004799) for N. brichardi; PRJNA60367 (SRP004869) for P. nyererei; PRJNA60369 (SRP004788) for M. zebra; and PRJNA60363 (SRP004787) for A. burtoni. Transcriptome sequencing (mRNAs): PRJNA78915 for O. niloticus; PRJNA77747 for N. brichardi; PRJNA83153 for P. nyererei; PRJNA77743 for M. zebra; and PRJNA78185 for A. burtoni. Additional SRA information for each tissue can be found in the Supplementary Informations. Transcriptome sequencing (microRNAs): PRJNA221867 (SRS489376) for O. niloticus; PRJNA222491 (SRS491903) for N. brichardi; PRJNA222489 (SRS491906) for P. nyererei; PRJNA221871 (SRS491904) for M. zebra; and PRJNA222490 (SRS491905) for A. burtoni. Cichlid microRNAs were deposited in miRBase.
The authors declare no competing financial interests. Readers are welcome to comment on the online version of the paper.
Online Content Methods, along with any additional Extended Data display items and Source Data, are available in the online version of the paper; references unique to these sections appear only in the online paper.
Supplementary Information is available in the online version of the paper.
References
- 1.Darwin C. On the Origin of Species. 6th edn John Murray; 1859. [Google Scholar]
- 2.Simpson GG. Tempo and Mode in Evolution. Columbia Univ. Press; 1944. [Google Scholar]
- 3.Kocher TD. Adaptive evolution and explosive speciation: the cichlid fish model. Nature Rev. Genet. 2004;5:288–298. doi: 10.1038/nrg1316. [DOI] [PubMed] [Google Scholar]
- 4.Wagner CE, Harmon LJ, Seehausen O. Ecological opportunity and sexual selection together predict adaptive radiation. Nature. 2012;487:366–369. doi: 10.1038/nature11144. [DOI] [PubMed] [Google Scholar]
- 5.Meyer A. Morphometrics and allometry in the trophically polymorphic cichlid fish, Cichlasoma citrinellum: alternative adaptations and ontogenic changes in shape. J. Zool. 1990;221:237–260. [Google Scholar]
- 6.Cohen AS, Soreghan MJ, Schloz CA. Estimating the age of formation of lakes: an example from Lake Tanganyika, East African Rift system. Geology. 1993;21:511–514. [Google Scholar]
- 7.McCune A. How Fast is Speciation: Molecular, Geological and Phylogenetic Evidences from Adaptive Radiations of Fish. Cambridge Univ. Press; 1997. pp. 585–610. [Google Scholar]
- 8.Joyce DA, et al. Repeated colonization and hybridization in Lake Malawi cichlids. Curr. Biol. 2011;21:R108–R109. doi: 10.1016/j.cub.2010.11.029. [DOI] [PubMed] [Google Scholar]
- 9.Loh Y-HE, et al. Origins of shared genetic variation in african cichlids. Mol. Biol. Evol. 2013;30:906–917. doi: 10.1093/molbev/mss326. [DOI] [PMC free article] [PubMed] [Google Scholar]
- 10.Albertson RC, Streelman JT, Kocher TD, Yelick PC. Integration and evolution of the cichlid mandible: the molecular basis of alternate feeding strategies. Proc. Natl Acad. Sci. USA. 2005;102:16287–16292. doi: 10.1073/pnas.0506649102. [DOI] [PMC free article] [PubMed] [Google Scholar]
- 11.Muschick M, Barluenga M, Salzburger W, Meyer A. Adaptive phenotypic plasticity in the Midas cichlid fish pharyngeal jaw and its relevance in adaptive radiation. BMC Evol. Biol. 2011;11:116. doi: 10.1186/1471-2148-11-116. [DOI] [PMC free article] [PubMed] [Google Scholar]
- 12.Fernald RD. Vision and behavior in an african cichlid fish. Am. Sci. 1984;72:58–65. [Google Scholar]
- 13.Hofmann CM, et al. The eyes have it: regulatory and structural changes both underlie cichlid visual pigment diversity. PLoS Biol. 2009;7:e1000266. doi: 10.1371/journal.pbio.1000266. [DOI] [PMC free article] [PubMed] [Google Scholar]
- 14.Maan ME. Intraspecific sexual selection on a speciation trait, male coloration, in the Lake Victoria cichlid Pundamilia nyererei. Proc. R. Soc. Lond. B. 2004;271:2445–2452. doi: 10.1098/rspb.2004.2911. [DOI] [PMC free article] [PubMed] [Google Scholar]
- 15.Parnell NF, Streelman JT. Genetic interactions controlling sex and color establish the potential for sexual conflict in Lake Malawi cichlid fishes. Heredity. 2013;110:239–246. doi: 10.1038/hdy.2012.73. [DOI] [PMC free article] [PubMed] [Google Scholar]
- 16.Roberts RB, Ser JR, Kocher TD. Sexual conflict resolved by invasion of a novel sex determiner in Lake Malawi cichlid fishes. Science. 2009;326:998–1001. doi: 10.1126/science.1174705. [DOI] [PMC free article] [PubMed] [Google Scholar]
- 17.Huber R, vanStaaden MJ, Kaufman LS, Liem KF. Microhabitat use, trophic patterns, and the evolution of brain structure in African cichlids. Brain Behav. Evol. 1997;50:167–182. doi: 10.1159/000113330. [DOI] [PubMed] [Google Scholar]
- 18.Sylvester JB, et al. Competing signals drive telencephalon diversity. Nat. Commun. 2013;4:1745. doi: 10.1038/ncomms2753. [DOI] [PubMed] [Google Scholar]
- 19.Jones FC, et al. The genomic basis of adaptive evolution in threespine sticklebacks. Nature. 2012;484:55–61. doi: 10.1038/nature10944. [DOI] [PMC free article] [PubMed] [Google Scholar]
- 20.Fan S, Elmer KR, Meyer A. Positive Darwinian selection drives the evolution of the morphology-related gene, EPCAM, in particularly species-rich lineages of African cichlid fishes. J. Mol. Evol. 2011;73:1–9. doi: 10.1007/s00239-011-9452-5. [DOI] [PubMed] [Google Scholar]
- 21.Terai Y, Morikawa N, Okada N. The evolution of the pro-domain of bone morphogenetic protein 4 (Bmp4) in an explosively speciated lineage of East African cichlid fishes. Mol. Biol. Evol. 2002;19:1628–1632. doi: 10.1093/oxfordjournals.molbev.a004225. [DOI] [PubMed] [Google Scholar]
- 22.Parichy DM, et al. Mutational analysis of endothelin receptor b1 (rose) during neural crest and pigment pattern development in the zebrafish Danio rerio. Dev. Biol. 2000;227:294–306. doi: 10.1006/dbio.2000.9899. [DOI] [PubMed] [Google Scholar]
- 23.Lynch M, Conery JS. The evolutionary fate and consequences of duplicate genes. Science. 2000;290:1151–1155. doi: 10.1126/science.290.5494.1151. [DOI] [PubMed] [Google Scholar]
- 24.Plenderleith M, van Oosterhout C, Robinson RL, Turner GF. Female preference for conspecific males based on olfactory cues in a Lake Malawi cichlid fish. Biol. Lett. 2005;1:411–414. doi: 10.1098/rsbl.2005.0355. [DOI] [PMC free article] [PubMed] [Google Scholar]
- 25.Taylor JS, Braasch I, Frickey T, Meyer A, Van de Peer Y. Genome duplication, a trait shared by 22000 species of ray-finned fish. Genome Res. 2003;13:382–390. doi: 10.1101/gr.640303. [DOI] [PMC free article] [PubMed] [Google Scholar]
- 26.Taylor JS, Van de Peer Y, Meyer A. Genome duplication, divergent resolution and speciation. Trends Genet. 2001;17:299–301. doi: 10.1016/s0168-9525(01)02318-6. [DOI] [PubMed] [Google Scholar]
- 27.Medstrand P, van de Lagemaat LN, Mager DL. Retroelement distributions in the human genome: variations associated with age and proximity to genes. Genome Res. 2002;12:1483–1495. doi: 10.1101/gr.388902. [DOI] [PMC free article] [PubMed] [Google Scholar]
- 28.Siepel A, et al. Evolutionarily conserved elements in vertebrate, insect, worm, and yeast genomes. Genome Res. 2005;15:1034–1050. doi: 10.1101/gr.3715005. [DOI] [PMC free article] [PubMed] [Google Scholar]
- 29.Berezikov E. Evolution of microRNA diversity and regulation in animals. Nature Rev. Genet. 2011;12:846–860. doi: 10.1038/nrg3079. [DOI] [PubMed] [Google Scholar]
- 30.Ro S, Park C, Young D, Sanders KM, Yan W. Tissue-dependent paired expression of miRNAs. Nucleic Acids Res. 2007;35:5944–5953. doi: 10.1093/nar/gkm641. [DOI] [PMC free article] [PubMed] [Google Scholar]
- 31.Salzburger W, Meyer A, Baric S, Verheyen E, Sturmbauer C. Phylogeny of the Lake Tanganyika cichlid species flock and its relationship to the Central and East African haplochromine cichlid fish faunas. Syst. Biol. 2002;51:113–135. doi: 10.1080/106351502753475907. [DOI] [PubMed] [Google Scholar]
- 32.Genner MJ, et al. Age of cichlids: New dates for ancient lake fish radiations. Mol. Biol. Evol. 2007;24:1269–1282. doi: 10.1093/molbev/msm050. [DOI] [PubMed] [Google Scholar]
- 33.Scally A, et al. Insights into hominid evolution from the gorilla genome sequence. Nature. 2012;483:169–175. doi: 10.1038/nature10842. [DOI] [PMC free article] [PubMed] [Google Scholar]
- 34.Johnson TC, et al. Late Pleistocene desiccation of Lake Victoria and rapid evolution of cichlid fishes. Science. 1996;273:1091–1093. doi: 10.1126/science.273.5278.1091. [DOI] [PubMed] [Google Scholar]
- 35.Wagner CE, et al. Genome-wide RAD sequence data provides unprecedented resolution of species boundaries and relationships in the Lake Victoria cichlid adaptive radiation. Mol. Ecol. 2012;22:787–798. doi: 10.1111/mec.12023. [DOI] [PubMed] [Google Scholar]
- 36.Barrett RD, Schluter D. Adaptationfrom standing genetic variation. Trends Ecol. Evol. 2008;23:38–44. doi: 10.1016/j.tree.2007.09.008. [DOI] [PubMed] [Google Scholar]
- 37.Stern DL, Orgogozo V. The loci of evolution: how predictable is genetic evolution? Evolution. 2008;62:2155–2177. doi: 10.1111/j.1558-5646.2008.00450.x. [DOI] [PMC free article] [PubMed] [Google Scholar]
- 38.Thigpen AE, et al. Molecular genetics of steroid 5 alpha-reductase 2 deficiency. J. Clin. Invest. 1992;90:799–809. doi: 10.1172/JCI115954. [DOI] [PMC free article] [PubMed] [Google Scholar]
- 39.Magalhaes IS, Lundsgaard-Hansen B, Mwaiko S, Seehausen O. Evolutionary divergence in replicate pairs of ecotypes of Lake Victoria cichlid fish. Evol. Ecol. Res. 2012;14:381–401. [Google Scholar]
- 40.Liu B, Wu D. The first inner loop of endothelin receptor type B is necessary for specific coupling to Ga13. J. Biol. Chem. 2003;278:2384–2387. doi: 10.1074/jbc.M208683200. [DOI] [PubMed] [Google Scholar]
- 41.Okamoto Y, et al. Palmitoylation of human endothelinB. Its critical role in G protein coupling and a differential requirement for the cytoplasmic tail by G protein subtypes. J. Biol. Chem. 1997;272:21589–21596. doi: 10.1074/jbc.272.34.21589. [DOI] [PubMed] [Google Scholar]
- 42.Lalueza-Fox C, et al. A melanocortin 1 receptor allele suggests varying pigmentation among Neanderthals. Science. 2007;318:1453–1455. doi: 10.1126/science.1147417. [DOI] [PubMed] [Google Scholar]
Associated Data
This section collects any data citations, data availability statements, or supplementary materials included in this article.