Abstract
Background
Both acetabular undercoverage (hip dysplasia) and overcoverage (pincer-type femoroacetabular impingement) can result in hip osteoarthritis. In contrast to undercoverage, there is a lack of information on radiographic reference values for excessive acetabular coverage.
Questions/purposes
(1) How do common radiographic hip parameters differ in hips with a deficient or an excessive acetabulum in relation to a control group; and (2) what are the reference values determined from these data for acetabular under- and overcoverage?
Methods
We retrospectively compared 11 radiographic parameters describing the radiographic acetabular anatomy among hip dysplasia (26 hips undergoing periacetabular osteotomy), control hips (21 hips, requiring no rim trimming during surgical hip dislocation), hips with overcoverage (14 hips, requiring rim trimming during surgical hip dislocation), and hips with severe overcoverage (25 hips, defined as having acetabular protrusio). The hips were selected from a patient cohort of a total of 593 hips. Radiographic parameters were assessed with computerized methods on anteroposterior pelvic radiographs and corrected for neutral pelvic orientation with the help of a true lateral radiograph.
Results
All parameters except the crossover sign differed among the four study groups. From dysplasia through control and overcoverage, the lateral center-edge angle, acetabular arc, and anteroposterior/craniocaudal coverage increased. In contrast, the medial center-edge angle, extrusion/acetabular index, Sharp angle, and prevalence of the posterior wall sign decreased. The following reference values were found: lateral center-edge angle 23° to 33°, medial center-edge angle 35° to 44°, acetabular arc 61° to 65°, extrusion index 17% to 27%, acetabular index 3° to 13°, Sharp angle 38° to 42°, negative crossover sign, positive posterior wall sign, anterior femoral head coverage 15% to 26%, posterior femoral head coverage 36% to 47%, and craniocaudal coverage 70% to 83%.
Conclusions
These acetabular reference values define excessive and deficient coverage. They may be used for radiographic evaluation of symptomatic hips, may offer possible predictors for surgical outcomes, and serve to guide clinical decision-making.
Level of Evidence
Level III, diagnostic study.
Introduction
Both acetabular undercoverage (developmental dysplasia of the hip [DDH]) and overcoverage (such as “pincer”-type femoroacetabular impingement [FAI]) can lead to degenerative hip arthritis. A different pathomechanism for each of these two conditions is supposed. Undercoverage may cause higher joint contact pressures [12] and subsequent degeneration of the articular cartilage resulting from static overload [13, 20]. Acetabular overcoverage may lead to early pathological contact between the overcovering acetabulum and the femoral head-neck junction [11]. This can lead to prearthrotic chondrolabral damage as a result of a more dynamic conflict at the acetabular rim [30].
Although acetabular undercoverage has been quantified before [5, 20, 34], there is a lack of information in the literature on excessive coverage. To our knowledge, an anatomically based quantification of overcoverage has never been explicitly described.
We therefore asked: (1) how do common radiographic hip parameters differ between hips with a deficient or excessive acetabulum in comparison to a control group; and (2) what are the anatomically based reference values for acetabular under- and overcoverage?
Material and Methods
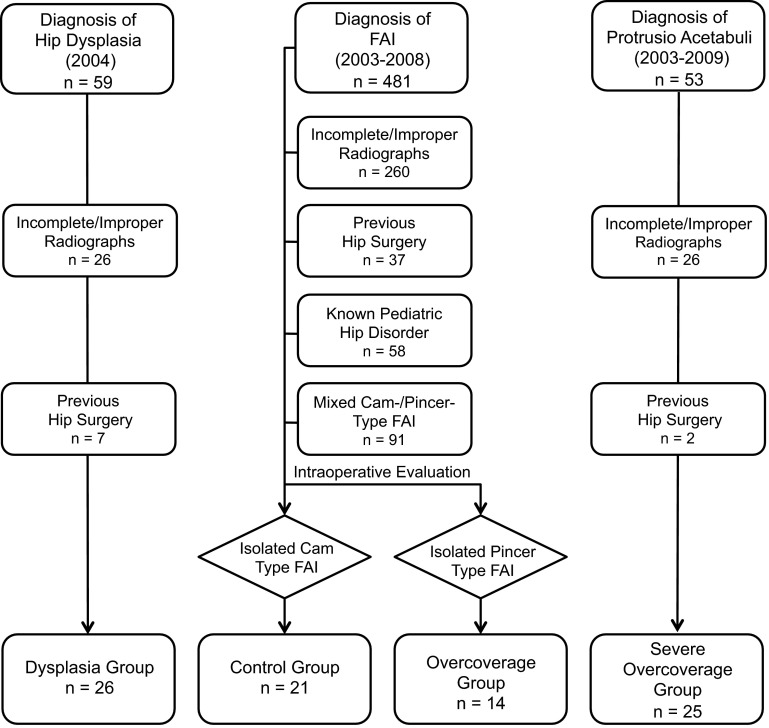
We performed a retrospective comparative study including a total of 86 selected, nonconsecutive nonarthritic hips (Table 1). We compared the radiographic anatomy of the acetabulum among four groups: a “dysplastic,” “control,” “overcoverage,” and “severe overcoverage” group. The allocation to each group (Fig. 1) was based on established radiographic criteria and direct visual inspection of the type of impingement conflict during surgical hip dislocation [9]. The “dysplastic” group consisted of a consecutive series of patients undergoing periacetabular osteotomy (PAO) [10] in 2004 (n = 59 hips). Inclusion criteria was a lateral center-edge (LCE) angle of ≤ 20° [20]. Exclusion criteria were improper/incomplete radiographs (n = 26) and hips with previous surgery (n = 26). The “control” and the “overcoverage” groups were recruited from 481 consecutive hips undergoing surgical hip dislocation for FAI (Fig. 1) [6]. Exclusion criteria were improper/incomplete radiographs (n = 260), previous hip surgery (n = 37), a history of pediatric hip disorder (n = 58), and hips with mixed cam-/pincer-type of FAI (n = 91). The remaining 35 hips either had isolated cam (n = 21 hips, “control” group) or pincer-type FAI (“overcoverage” group). The allocation to these two groups was based on the direct visual intraoperative dynamic assessment. The “control” hips only required a correction of the aspherical femoral head until impingement-free ROM was present during surgical hip dislocation. The “overcoverage” group only required isolated rim trimming without addressing the femoral head-neck junction. The “severe overcoverage” group consisted of hips with acetabular protrusio, which is established as the most severe form of pincer impingement. This group included hips in which the femoral head touches or crosses the ilioischial line on the AP pelvic radiograph [17, 32]. We excluded 26 hips with improper/incorrect radiographs and two hips with previous surgery from an initial cohort of 53 hips leaving 25 hips for the “severe overcoverage” group (Fig. 1). This retrospective comparative study was approved by the local institutional review board.
Table 1.
Demographic data of the four study groups
| Parameter | Dysplasia | Control | Overcoverage | Severe overcoverage | p value |
|---|---|---|---|---|---|
| Number | 26 | 21 | 14 | 25 | – |
| Sex (percent male of all hips) | 19 | 76 | 36 | 0 | < 0.001 |
| Side (percent right of all hips) | 42 | 62 | 43 | 44 | 0.518 |
| Age (years) | 33 ± 9 (16–44) | 34 ± 13 (17–58) | 34 ± 13 (15–57) | 41 ± 15 (15–70) | 0.074 |
| Height (cm) | 167 ± 8 (152–180) | 171 ± 7 (159–182) | 167 ± 5 (162–173) | 168 ± 9 (157–196) | 0.394 |
| Weight (kg) | 73 ± 18 (47–73) | 69 ± 15 (47–102) | 69 ± 14 (53–86) | 69 ± 12 (51–93) | 0.785 |
| Body mass index (kg/m2) | 26 ± 6 (18–26) | 24 ± 5 (19–33) | 25 ± 5 (20–33) | 25 ± 5 (17–32) | 0.420 |
Continuous data are expressed as mean ± SD and range in parentheses.
Fig. 1.
The figure shows how the four different groups were recruited.
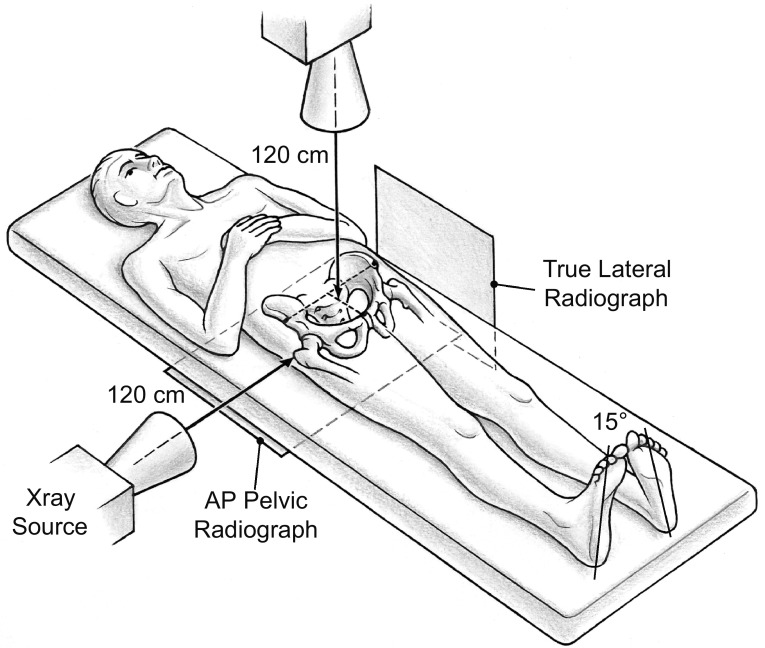
Two radiographic views acquired with a standardized technique were used for evaluation: an AP and a true lateral pelvic radiograph [32]. The AP radiograph was used to calculate the radiographic parameters; the true lateral radiograph was used to assess the individual pelvic tilt (described later). Both radiographs were taken consecutively without repositioning of the patient (Fig. 2). The film-focus distance was 120 cm for both views. For the AP pelvic radiograph, the center of the x-ray beam was directed to the midpoint of the symphysis and a line connecting the anterosuperior iliac spines. For the true lateral radiograph, the x-ray beam was centered on the tip of the greater trochanter.
Fig. 2.
The figure shows the radiographic setup for the AP and the true lateral pelvic radiographs. Both radiographs are taken consecutively without repositioning of the patient. The film-focus distance is 120 cm for both radiographs. For the AP pelvic radiograph, the center of the x-ray beam is directed to the midpoint of the symphysis and a line connecting the anterosuperior iliac spines. For the true lateral radiograph, the x-ray beam was centered on the tip of the greater trochanter. Reprinted with kind permission from the American Roentgen Ray Society: Tannast M, Siebenrock KA, Anderson SE. Femoroacetabular impingement: radiographic diagnosis—what the radiologist should know. AJR Am J Roentgenol. 2007;188:1540–1552.
We used previously validated and commercially available software (Hip2Norm [31, 33, 38]; University of Bern, Bern, Switzerland) for the evaluation of these radiographs. This software allows a reliable and reproducible evaluation of the most commonly used radiographic hip parameters. Repeatability statistics with use of this program have been published elsewhere [31]; briefly, the interobserver reliability and the intraobserver repeatability for the following chosen 11 parameters (Table 2) was good to very good (ie, intraclass correlation coefficient ≥ 0.61): LCE angle, medial center-edge angle, acetabular arc, extrusion index, acetabular index, Sharp angle, crossover sign, posterior wall sign, anterior femoral head coverage, posterior femoral head coverage, and craniocaudal femoral head coverage (Fig. 3). A special feature of Hip2Norm is the ability of correcting the radiographic parameters for tilt and rotation [33]. To exclude the influence of pelvic malpositioning, we calculate all radiographic value relative to a neutral pelvic orientation regarding tilt (around the transverse axis) and rotation (around the longitudinal axis). A neutral pelvic tilt was defined by a pelvic inclination of 60° [6, 19, 37]. This angle is formed by a horizontal line and a line connecting the upper border of the symphysis with the sacral promontory. This angle was measured on the lateral pelvic radiograph. A neutral pelvic rotation was defined when the center of the sacrococcygeal joint was aligned vertically with the middle of the pubic symphysis [33]. One observer (MT) assessed all radiographs.
Table 2.
Definitions of the investigated radiographic hip parameters (see Fig. 2 for schematic illustration)
| Parameter | Definition |
|---|---|
| Lateral center-edge (LCE) angle | Angle formed by a line parallel to the longitudinal pelvic axis and a line connecting the center of the femoral head with the lateral edge of the acetabular sourcil |
| Medial center-edge (MCE) angle | Angle formed by a line parallel to the longitudinal pelvic axis and a line connecting the center of the femoral head with the medial edge of the acetabular sourcil |
| Acetabular arc | Angle formed by two lines connecting the center of the femoral head with the medial and the lateral edge of the acetabular sourcil (sum of the LCE and the MCE angle) |
| Extrusion index | Percentage of uncovered femoral head (A) in comparison to the total horizontal head diameter (A + B) |
| Acetabular index | Angle formed by a horizontal line and a line through the most medial point of the sclerotic zone of the acetabular roof and the lateral edge of the acetabulum |
| Sharp angle | Angled formed by a horizontal line and a line through the caudal tip of the teardrop and the lateral edge of the acetabulum |
| Crossover sign | Positive if the projected anterior wall crosses the posterior wall |
| Posterior wall sign | Positive if the posterior acetabular rim is projected medial of the center of the hip |
| Anterior coverage | The percentage of femoral head covered by the anterior acetabular rim in AP direction |
| Posterior coverage | The percentage of femoral head covered by the posterior acetabular rim in posteroanterior direction |
| Craniocaudal coverage | The percentage of femoral head covered by the acetabulum in craniocaudal direction |
Fig. 3.
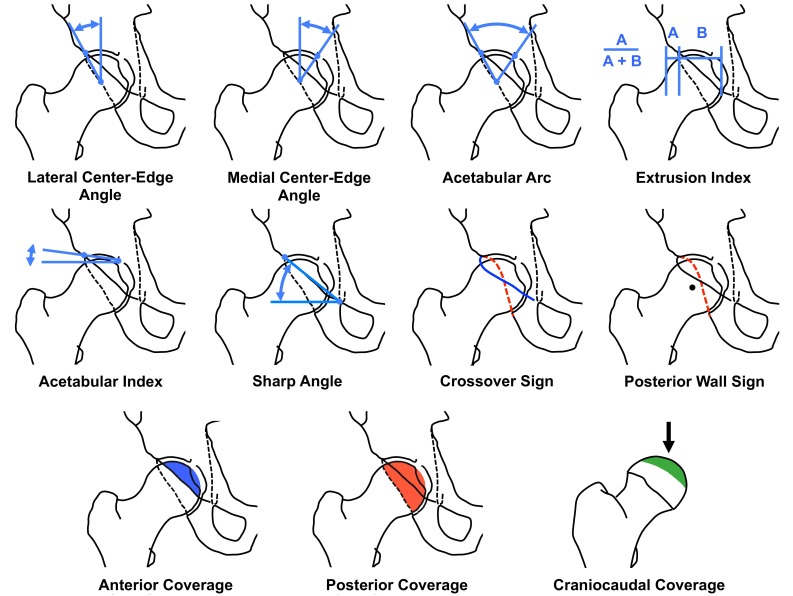
The definitions of the 11 evaluated radiographic parameters are illustrated using schematic drawings. The craniocaudal view direction is indicated (black arrow).
Normal distribution was determined with the Kolmogorov-Smirnov test. Differences for demographic and radiographic data among the four study groups were determined with analysis of variance for continuous variables and the chi-square test for categorical variables. Reference values were derived from the intersection points of the normal distribution curves for each continuous variable. Reference values for categorical variables were determined by the highest prevalence in the control group.
Results
All parameters except the crossover sign differed among the four study groups (Table 3). Of the nine evaluated continuous variables, five parameters (LCE angle, acetabular arc, AP/cranial coverage) increased steadily from dysplasia through control and overcoverage to severe overcoverage (Fig. 4). In contrast, four of the continuous parameters (medial center-edge angle, extrusion/acetabular index, Sharp angle) decreased from dysplasia to severe overcoverage.
Table 3.
Results of the 11 evaluated radiographic parameters for the four study groups
| Parameter | Dysplasia | Control | Overcoverage | Severe overcoverage | p value |
|---|---|---|---|---|---|
| LCEA (degrees) | 16 ± 7 (−1 to 20) | 26 ± 5 (20–35) | 35 ± 6 (24–46) | 49 ± 6 (31–59) | < 0.001 |
| MCEA (degrees) | 48 ± 9 (36–63) | 41 ± 6 (27–52) | 31 ± 5 (24–43) | 27 ±7 (12–40) | < 0.001 |
| Acetabular arc (degrees) | 59 ± 7 (46–77) | 67 ± 6 (51–77) | 66 ± 7 (57–85) | 75 ± 9 (60–93) | < 0.001 |
| Extrusion index (degrees) | 33 ± 6 (26–54) | 23 ± 5 (12–31) | 15 ± 5 (5–25) | 7 ± 4 (0–18) | < 0.001 |
| Acetabular index (degrees) | 13 ± 8 (7–32) | 9 ± 4 (4–19) | 0 ± 4 (−7 to 7) | −10 ± 6 (−17 to 7) | < 0.001 |
| Sharp angle (degrees) | 46 ± 3 (39–52) | 40 ± 2 (34–45) | 38 ± 4 (32–45) | 34 ± 4 (25–44) | < 0.001 |
| Crossover sign (percent positive) | 19 | 10 | 14 | 8 | 0.635 |
| Posterior wall sign (percent positive) | 100 | 71 | 57 | 4 | < 0.001 |
| Anterior coverage (percent) | 12 ± 5 (4–22) | 19 ± 6 (7–29) | 29 ± 9 (13–42) | 42 ± 8 (25–54) | < 0.001 |
| Posterior coverage (percent) | 37 ± 8 (15–47) | 43 ± 7 (32–59) | 49 ± 9 (32–64) | 66 ± 7 (55–81) | < 0.001 |
| Craniocaudal coverage (percent) | 63 ± 8 (42–76) | 78 ± 7 (68–92) | 85 ± 7 (72–95) | 95 ± 5 (85–100) | < 0.001 |
Continuous data are expressed as mean ± SD and range in parentheses; LCEA = lateral center-edge angle; MCEA = medial center-edge angle.
Fig. 4.
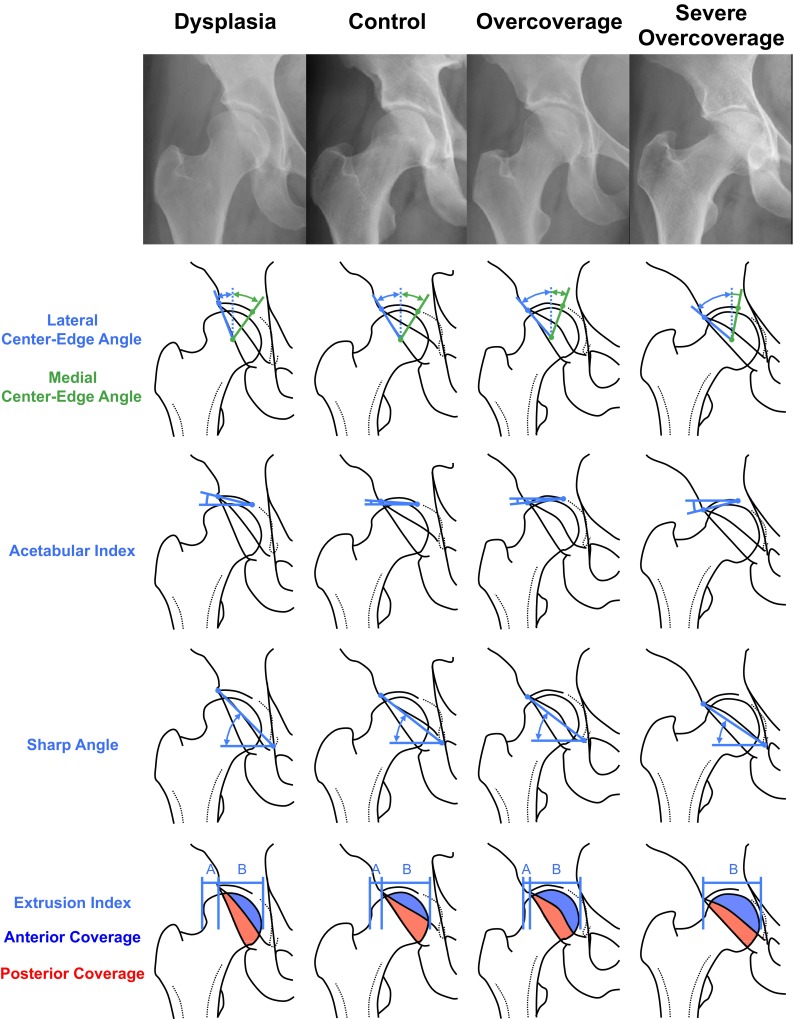
Schematic illustration showing the differences of the radiographic parameters among the four study groups. From dysplasia through control, overcoverage and severe overcoverage, LCE angle, acetabular arc, and AP coverage increased. In contrast, medial center-edge angle, acetabular/extrusion indices, and the Sharp angle decreased from dysplasia to severe overcoverage.
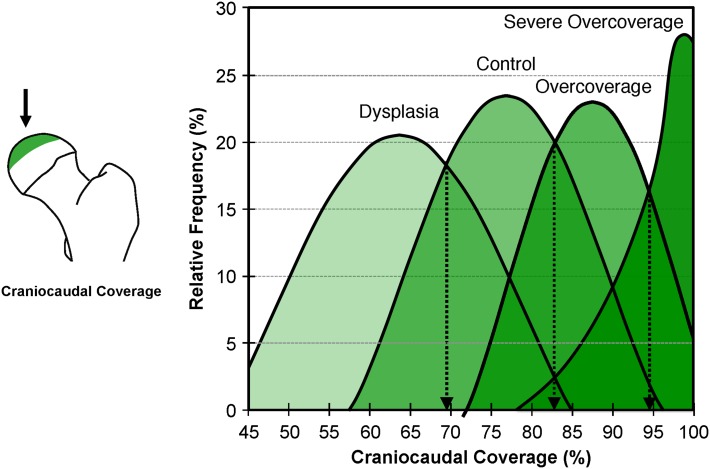
The intersection of the normal distribution curves results (Fig. 5) in the formulation of characteristic thresholds for each continuous parameter. The following reference values were found: LCE angle 23° to 33°, medial center-edge angle 35° to 44°, acetabular arc 61° to 65°, extrusion index 17% to 27%, acetabular index 3° to 13°, Sharp angle 38° to 42°, negative crossover sign, positive posterior wall sign, anterior femoral head coverage 15% to 26%, posterior femoral head coverage 36% to 47%, and craniocaudal coverage 70% to 83% (Table 4).
Fig. 5.
The distribution curves for craniocaudal coverage of the four study groups are shown as an example for definition of the range of values for each group. The intersection of the distribution curves resulted in the definition thresholds for each parameter (Table 4). Image to the left indicates craniocaudal coverage and craniocaudal view direction (black arrow).
Table 4.
Novel anatomically based radiographic reference values for the acetabulum on an AP pelvic radiograph
| Parameter | Dysplasia | Control | Overcoverage | Severe overcoverage |
|---|---|---|---|---|
| LCEA (degrees) | < 22 | 23–33 | 34–39 | > 40 |
| MCEA (degrees) | > 45 | 35–44 | 34–29 | < 28 |
| Acetabular arc (degrees) | < 60 | 61–65 | 66–69 | > 69 |
| Extrusion index (percent) | > 27 | 17–27 | 12–16 | < 11 |
| Acetabular index (degrees) | > 14 | 3–13 | −7 to 2 | < −8 |
| Sharp angle (degrees) | > 43 | 38–42 | 34–37 | < 34 |
| Crossover sign (percent positive) | Positive | Negative | Negative | Negative |
| Posterior wall sign (percent positive) | Positive | Positive | Positive or negative | Negative |
| Anterior coverage (percent) | < 14 | 15–26 | 27–32 | > 33 |
| Posterior coverage (percent) | < 35 | 36–47 | 48–55 | > 56 |
| Craniocaudal coverage (percent) | < 69 | 70–83 | 84–93 | > 93 |
LCEA = lateral center-edge angle; MCEA = medial center-edge angle.
Discussion
Undercoverage and overcoverage are two distinct pathologic forms of acetabular morphology. They can result in two different clinically pathomechanisms: static overload (undercoverage) or dynamic FAI conflict (overcoverage). The overload concept has been widely accepted for decades with a good body of literature on reference values for undercoverage (Table 5). However, because the concept of FAI resulting from excessive acetabular coverage has not gained acceptance until the last 10 years, quantitative data on radiographic reference values are sparse. We therefore raised the following questions: (1) how do the common radiographic hip parameters differ in hips with a deficient or excessive acetabulum in comparison to a control group; and (2) what are the reference values determined from these data for acetabular under- and overcoverage?
Table 5.
Selected publications on normal radiographic values describing the acetabular anatomy
| Study | Method | Hips | Hip dysplasia | Normal hips | Pincer/protrusio |
|---|---|---|---|---|---|
| Lateral center-edge angle | |||||
| Wiberg (1939) [36] | AP pelvic radiograph | 200 | < 20° Borderline: 20°–25° |
> 25° | |
| Fredensborg (1976) [8] | AP pelvic radiograph | 40 | Adults: < 20° (borderline 20°–25°) Children: < 15° (borderline 15°–20°) |
Adults: > 25° Children: > 20° |
|
| Anda et al. (1986) [2] and (1991) [3] | Scout view of CT | 82 and 33 | 13° ± 5° (3°–19°) | Male: 38° ± 5° (23–42) Female: 35° ± 6° (21–42) |
|
| Murphy et al. (1995) [20] | AP pelvic radiograph | 117 | 7° ± 12° (−22°–28°) | 34° ± 9° (16°–49°) | |
| Kojima et al. (1998) [14] | Computer simulation and AP pelvic radiograph | 146 | 9° ± 9° | Male: 31° ± 6° Female: 29° ± 5° |
|
| Tönnis and Heinecke (1999) [34] | AP pelvic radiograph | NA | < 20° | Deep acetabulum: 39°–44° Protrusio: > 44° |
|
| Li and Ganz (2003) [18] | AP pelvic radiograph | 232 | 6° ± 9° (−22°–25°) | ||
| Jacobsen et al. (2005) [13] | AP pelvic radiograph | 4151 | Male: 35° ± 7° (10°–62°) Female: 35° ± 7° (10°–65°) |
||
| Ecker et al. (2007) [7] | AP pelvic radiograph | 25 | 33° ± 6° (24°–47°) | ||
| Steppacher et al. (2008) [28] | AP pelvic radiograph | 100 | 14° ± 9° (−16°–24°) | 44° ± 5° (39°–59°) | |
| Shi et al. (2010) [24] | AP pelvic radiograph | 1494 | Childhood: 23° (5°–46°) Adolescents: 29° (6°–48°) Adults: 33° (14°–59°) |
||
| Siebenrock et al. (2012) [25] | AP pelvic radiograph | 87 | 10° (−13°–21°) | 27° (20°–35°) | 42° (24°–56°) |
| Lepage-Saucier et al. (2014) [16] | AP pelvic radiograph | 94 | Male: 35° ± 6° (22°–47°) Female: 32° ± 6° (21°–44°) |
||
| Scheidt et al. (2014) [22] | AP pelvic radiograph | 164 | 34° ± 7° (20°–56°) | ||
| Acetabular index | |||||
| Murphy et al. (1995) [20] | AP pelvic radiograph | 117 | 25° ± 10° (6°–46°) | 6° ± 6° (−5° to 15°) | |
| Tönnis and Heinecke (1999) [34] | AP pelvic radiograph | NA | > 14° | Deep acetabulum <−5° | |
| Li and Ganz (2003) [18] | AP pelvic radiograph | 232 | 25° ± 10° (0°–50°) | ||
| Ecker et al. (2007) [7] | AP pelvic radiograph | 25 | 9° ± 5° (−4° to 16°) | ||
| Steppacher et al. (2008) [28] | AP pelvic radiograph | 100 | 21° ± 6° (14°–38°) | −1° ± 5° (−13° to 14°) | |
| Lepage-Saucier et al. (2014) [16] | AP pelvic radiograph | 94 | Male: 6° ± 5° (−3° to 14°) Female: 6° ± 4° (−1° to 16°) |
||
| Scheidt et al. (2014) [22] | AP pelvic radiograph | 164 | 2° ± 5° (−11° to 14°) | ||
| Extrusion index | |||||
| Murphy et al. (1995) [20] | AP pelvic radiograph | 117 | 36% ± 12% (15%–62%) | 12% ± 8% (0%–31%) | |
| Li and Ganz (2003) [18] | AP pelvic radiograph | 232 | 39% ± 12% (11%–65%°) | ||
| Jacobsen et al. (2005) [13] | AP pelvic radiograph | 4151 | Male: 12% ± 9% (0%–45%) Female: 8% ± 7% (0%–46%) |
||
| Ecker et al. (2007) [7] | AP pelvic radiograph | 25 | 15% ± 6% (2%–33%) | ||
| Steppacher et al. (2008) [28] | AP pelvic radiograph | 100 | 34%° ± 7% (22%–57%) | 9% ± 4% (0%–16%) | |
| Scheidt et al. (2014) [22] | AP pelvic radiograph | 164 | 11% ± 6% (6%–27%) | ||
| Sharp angle | |||||
| Sharp (1961) [23] | AP pelvic radiograph | 200 | 33°–38° | ||
| Jacobsen et al. (2005) [13] | AP pelvic radiograph | 4151 | Male: 37° ± 4° (26°–54°) Female: 39° ± 4° (24°–56°) |
||
| Scheidt et al. (2014) [22] | AP pelvic radiograph | 164 | 39° ± 4° (28°–49°) | ||
| Crossover sign | |||||
| Reynolds et al. (1999) [21] | AP pelvic radiograph | 446 | Negative | Negative | |
| Posterior wall sign | |||||
| Reynolds et al. (1999) [21] | AP pelvic radiograph | 446 | Positive | Negative | |
| Anterior coverage | |||||
| Siebenrock et al. (2012) [25] | AP pelvic radiograph | 87 | 10% (0%–22%) | 19% (7%–29%) | 36% (13%–54%) |
| Posterior coverage | |||||
| Siebenrock et al. (2012) [25] | AP pelvic radiograph | 87 | 37% (15%–53%) | 43% (32%–59%) | 59% (32%–79%) |
| Craniocaudal coverage | |||||
| Konishi et al. (1993) [15] | CT | 286 | Male: 79% ± 5% Female: 77% ± 6% |
||
| Steppacher et al. (2008) [28] | AP pelvic radiograph | 100 | 63% ± 12% (32%–87%) | 92% ± 6% (79%–100%) | |
| Dandachli et al. (2013) [5] | CT | 75 | 51% ± 7% (38%–64%) | 73% ± 4% (66%–81%) | |
NA = not applicable.
This study has limitations. First, we were unable to provide radiographic data for the “control” group from asymptomatic patients. This would not have been compliant with institutional review board policies in our country. However, our group of “control” acetabuli consisted of patients with isolated cam-type FAI who all underwent surgical hip dislocation with offset creation. In all these hips, an impingement-free ROM was ensured by direct intraoperative observation during dynamic examination of the hip. A relevant additional morphology in terms of overcoverage can therefore be excluded. Second, we do not use a population-based approach to determine the reference values, unlike other authors [13, 24]. Third, our determined reference values are only valid in symptomatic patients. They can be used for diagnosis and treatment in these patients but must be used in adjunct with patient history, clinical findings, and the femoral morphology. A potential application of these reference values to the asymptomatic general population and its relevance for the natural history has yet to be proven. Fourth, another potential limitation is the diversity of the selection criteria to create the study groups. We used radiographic criteria for the most severely affected “dysplasia” and the “severe overcoverage” groups, whereas we depended on intraoperative assessment for the less affected “control” and the “overcoverage” groups. However, the radiographic criteria for dysplasia (LCE angle of less than 20°) are established parameters [20, 35, 36] that have been shown by both finite element analysis [4] and natural history [20] to result in overload and osteoarthritis if untreated. In contrast, a direct intraoperative dynamic examination offers the best assessment of a potential impingement conflict in a pincer-type hip. We thus feel that the risk of selection bias is minimal.
When comparing our mean values for the four groups with other studies (Table 5), good agreement can be found for many of the parameters, in particular for the dysplasia group. For example, a LCE angle of less than 22° seems to be a reproducible indicator for static overload (Table 5). This is in accordance with the results of various methodologies including population-based approaches [22], finite-element modeling [4], computation of joint-contact pressures [12], and studies on natural history [20]. The upper thresholds for the LCE angle found in our study require further clarification. We believe that the reported upper values from large population-based approaches might include falsely high values. A reason could be the lack of information about the pain status and physical examination [24] or a publication date before the introduction of the FAI concept [8]. The same is true for other parameters (eg, the Sharp angle or the extrusion index).
The established reference values have already been applied in several clinical studies, which support their validity. In a long-term followup study of 147 patients, Albers et al. [1] could show that there is at least a two times higher risk of failure after PAO for DDH if the majority of the radiographic hip parameters for the acetabulum were not in the normal range. Similarly, our determined reference values were found as predictive factors for the 5- and the 10-year followup after surgical hip dislocation for FAI [26, 27]. The reference values described can also be used as an adjunct for choosing the most appropriate surgical option of symptomatic hips. This can be very helpful in borderline cases of mixed DDH and pincer pathomorphologies (Fig. 6) or in the evaluation of acetabular coverage (Fig. 7).
Fig. 6A–B.
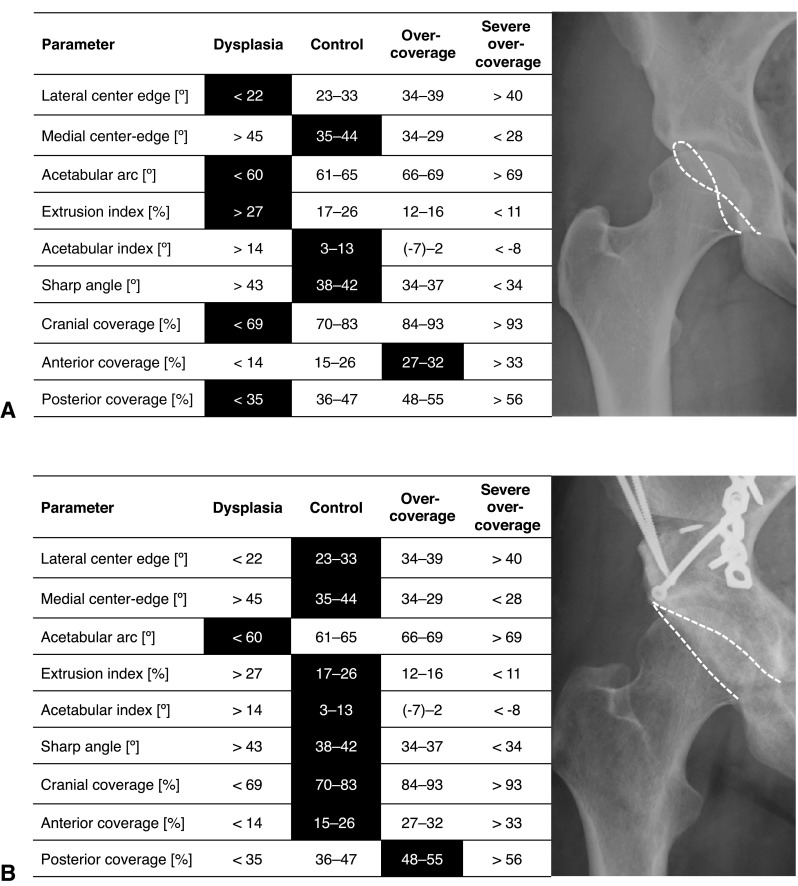
This figure shows a potential application of the established reference values in clinical practice. (A) The case of a 24-year-old female patient with groin pain is shown. The results of the analysis with Hip2Norm (indicated by darkened boxes) show that most of the parameters are indicative for a deficient acetabulum (dysplasia) except the anterior coverage, which is excessive. A dysplastic hip with acetabular retroversion was diagnosed. (B) The patient underwent anteverting PAO, which could normalize almost all parameters.
Fig. 7A–B.
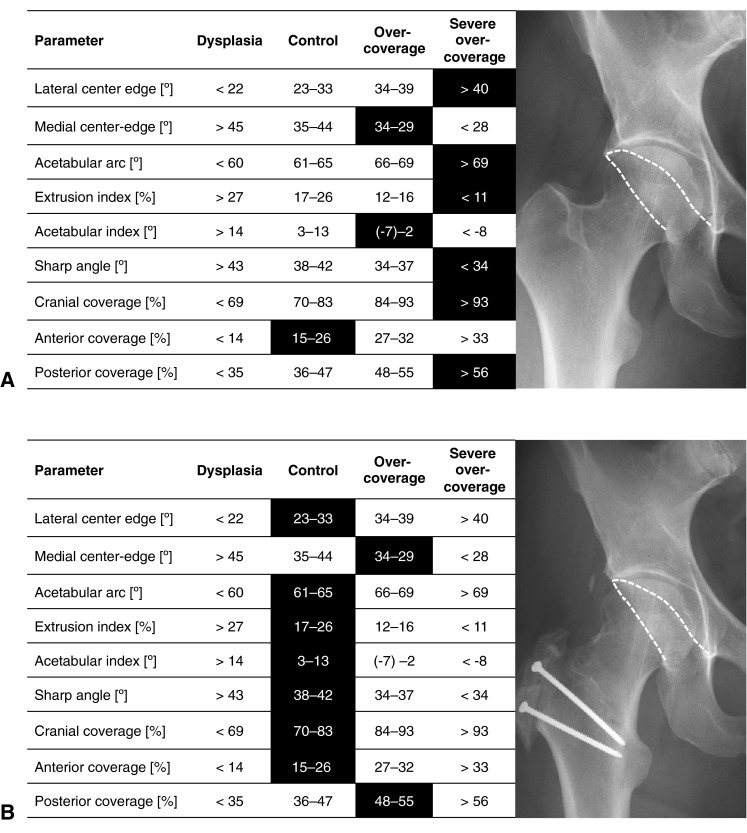
This figure shows a second potential application of the determined reference values for the acetabulum. (A) The AP pelvic radiograph of a 32-year-old male patient is shown. The analysis with Hip2Norm reveals excessive values of all parameters (indicated by darkened boxes) except for the anterior coverage, which was normal. Acetabular overcoverage with a too prominent posterior acetabular rim was diagnosed. (B) The patient underwent surgical hip dislocation with trimming of the posterior and superior acetabular rim. The anterior rim was not addressed surgically. This led to normalization of most of the parameters.
In summary, based on direct intraoperative observation, we developed acetabular reference values for excessive and deficient coverage. These values can be used for radiographic evaluation of symptomatic hips, possible predictors of surgical outcomes, and as an adjunct for clinical decision-making. As shown in a previous study [29], the following parameters can be reliably measured without necessarily compensating for pelvic tilt and rotation on an AP pelvic radiograph (ie, without a true lateral radiograph): LCE angle, Sharp angle, acetabular and extrusion index, and craniocaudal coverage. Similar to what has been shown for the dysplastic hips [20], future studies need to investigate the natural course of hips with acetabular overcoverage. Despite the establishment of our preliminary guidelines, we emphasize that incidentally found abnormal radiographic values in asymptomatic patients are not an indication for surgery unless patients at risk would have been identified who will ultimately develop hip osteoarthritis.
Footnotes
One of the authors (MT) has received funding from the Swiss National Science Foundation.
All ICMJE Conflict of Interest Forms for authors and Clinical Orthopaedics and Related Research ® editors and board members are on file with the publication and can be viewed on request.
Clinical Orthopaedics and Related Research ® neither advocates nor endorses the use of any treatment, drug, or device. Readers are encouraged to always seek additional information, including FDA-approval status, of any drug or device prior to clinical use.
Each author certifies that his or her institution approved the human protocol for this investigation, that all investigations were conducted in conformity with ethical principles of research, and that informed consent for participation in the study was obtained.
References
- 1.Albers CE, Steppacher SD, Ganz R, Tannast M, Siebenrock KA. Impingement adversely affects 10-year survivorship after periacetabular osteotomy for DDH. Clin Orthop Relat Res. 2013;471:1602–1614. doi: 10.1007/s11999-013-2799-8. [DOI] [PMC free article] [PubMed] [Google Scholar]
- 2.Anda S, Svenningsen S, Dale LG, Benum P. The acetabular sector angle of the adult hip determined by computed tomography. Acta Radiol Diagn (Stockh). 1986;27:443–447. doi: 10.1177/028418518602700415. [DOI] [PubMed] [Google Scholar]
- 3.Anda S, Terjesen T, Kvistad KA, Svenningsen S. Acetabular angles and femoral anteversion in dysplastic hips in adults: CT investigation. J Comput Assist Tomogr. 1991;15:115–120. doi: 10.1097/00004728-199101000-00018. [DOI] [PubMed] [Google Scholar]
- 4.Chegini S, Beck M, Ferguson SJ. The effects of impingement and dysplasia on stress distributions in the hip joint during sitting and walking: a finite element analysis. J Orthop Res. 2009;27:195–201. doi: 10.1002/jor.20747. [DOI] [PubMed] [Google Scholar]
- 5.Dandachli W, Islam SU, Liu M, Richards R, Hall-Craggs M, Witt J. Three-dimensional CT analysis to determine acetabular retroversion and the implications for the management of femoro-acetabular impingement. J Bone Joint Surg Br. 2009;91:1031–1036. doi: 10.1302/0301-620X.91B8.22389. [DOI] [PubMed] [Google Scholar]
- 6.Drenckhahn D, Eckstein F. Lower extremity. In: Benninghoff A, Drenckhahn D, eds. Anatomy, Volume 1. 16th ed [in German]. Munich, Germany: Urban & Fischer; 2003:342–350.
- 7.Ecker TM, Tannast M, Puls M, Siebenrock KA, Murphy SB. Pathomorphologic alterations predict presence or absence of hip osteoarthrosis. Clin Orthop Relat Res. 2007;465:46–52. doi: 10.1097/BLO.0b013e318159a998. [DOI] [PubMed] [Google Scholar]
- 8.Fredensborg N. The CE angle of normal hips. Acta Orthop Scand. 1976;47:403–405. doi: 10.3109/17453677608988709. [DOI] [PubMed] [Google Scholar]
- 9.Ganz R, Gill TJ, Gautier E, Ganz K, Krugel N, Berlemann U. Surgical dislocation of the adult hip a technique with full access to the femoral head and acetabulum without the risk of avascular necrosis. J Bone Joint Surg Br. 2001;83:1119–1124. doi: 10.1302/0301-620X.83B8.11964. [DOI] [PubMed] [Google Scholar]
- 10.Ganz R, Klaue K, Vinh TS, Mast JW. A new periacetabular osteotomy for the treatment of hip dysplasias. Technique and preliminary results. Clin Orthop Relat Res. 1988;232:26–36. [PubMed] [Google Scholar]
- 11.Ganz R, Parvizi J, Beck M, Leunig M, Notzli H, Siebenrock KA. Femoroacetabular impingement: a cause for osteoarthritis of the hip. Clin Orthop Relat Res. 2003;417:112–120. doi: 10.1097/01.blo.0000096804.78689.c2. [DOI] [PubMed] [Google Scholar]
- 12.Hipp JA, Sugano N, Millis MB, Murphy SB. Planning acetabular redirection osteotomies based on joint contact pressures. Clin Orthop Relat Res. 1999;364:134–143. doi: 10.1097/00003086-199907000-00018. [DOI] [PubMed] [Google Scholar]
- 13.Jacobsen S, Sonne-Holm S, Soballe K, Gebuhr P, Lund B. Hip dysplasia and osteoarthrosis: a survey of 4151 subjects from the Osteoarthrosis Substudy of the Copenhagen City Heart Study. Acta Orthop. 2005;76:149–158. doi: 10.1080/00016470510030517. [DOI] [PubMed] [Google Scholar]
- 14.Kojima A, Nakagawa T, Tohkura A. Simulation of acetabular coverage of femoral head using anteroposterior pelvic radiographs. Arch Orthop Trauma Surg. 1998;117:330–336. doi: 10.1007/s004020050260. [DOI] [PubMed] [Google Scholar]
- 15.Konishi N, Mieno T. Determination of acetabular coverage of the femoral head with use of a single anteroposterior radiograph. A new computerized technique. J Bone Joint Surg Am. 1993;75:1318–1333. doi: 10.2106/00004623-199309000-00007. [DOI] [PubMed] [Google Scholar]
- 16.Lepage-Saucier M, Thiery C, Larbi A. Lecouvet FE, Vande Berg BC, Omoumi P. Femoroacetabular impingement: normal values of the quantitative morphometric parameters in asymptomatic hips. Eur Radiol. 2014;24:1707–1714. doi: 10.1007/s00330-014-3171-4. [DOI] [PubMed] [Google Scholar]
- 17.Leunig M, Nho SJ, Turchetto L, Ganz R. Protrusio acetabuli: new insights and experience with joint preservation. Clin Orthop Relat Res. 2009;467:2241–2250. doi: 10.1007/s11999-009-0853-3. [DOI] [PMC free article] [PubMed] [Google Scholar]
- 18.Li PL, Ganz R. Morphologic features of congenital acetabular dysplasia: one in six is retroverted. Clin Orthop Relat Res. 2003;416:245–253. doi: 10.1097/01.blo.0000081934.75404.36. [DOI] [PubMed] [Google Scholar]
- 19.Lierse W. Pelvis. In: Lanz T, Wachsmuth W, editors. Practical Anatomy, Volume II/8a [in German] Berlin, Germany: Springer; 1984. pp. 30–32. [Google Scholar]
- 20.Murphy SB, Ganz R, Muller ME. The prognosis in untreated dysplasia of the hip. A study of radiographic factors that predict the outcome. J Bone Joint Surg Am. 1995;77:985–989. doi: 10.2106/00004623-199507000-00002. [DOI] [PubMed] [Google Scholar]
- 21.Reynolds D, Lucas J, Klaue K. Retroversion of the acetabulum. A cause of hip pain. J Bone Joint Surg Br. 1999;81:281–288. doi: 10.1302/0301-620X.81B2.8291. [DOI] [PubMed] [Google Scholar]
- 22.Scheidt RB, Galia CR, Diesel CV, Rosito R, Macedo CA. Prevalence of radiographic markers of femoroacetabular impingement in asymptomatic adults. Rev Col Bras Cir. 2014;41:36–42. doi: 10.1590/S0100-69912014000100008. [DOI] [PubMed] [Google Scholar]
- 23.Sharp IK. Acetabular dysplasia: the acetabular angle. J Bone Joint Surg Br. 1961;43:268–272. [Google Scholar]
- 24.Shi YY, Liu TJ, Zhao Q, Zhang LJ, Ji SJ, Wang EB. The normal centre-edge angle of Wiberg in the Chinese population: a population-based cross-sectional study. J Bone Joint Surg Br. 2010;92:1144–1147. doi: 10.1302/0301-620X.92B8.23993. [DOI] [PubMed] [Google Scholar]
- 25.Siebenrock KA, Kistler L, Schwab JM, Buchler L, Tannast M. The acetabular wall index for assessing anteroposterior femoral head coverage in symptomatic patients. Clin Orthop Relat Res. 2012;470:3355–3360. doi: 10.1007/s11999-012-2477-2. [DOI] [PMC free article] [PubMed] [Google Scholar]
- 26.Steppacher SD, Anwander H, Zurmühle CA, Tannast M, Siebenrock KA. Surgical hip dislocation for treatment of femoroacetabular impingement: a concise followup at 10-year. Clin Orthop Relat Res. 2014;472:337–348. doi: 10.1007/s11999-013-3268-0. [DOI] [PMC free article] [PubMed] [Google Scholar]
- 27.Steppacher SD, Huemmer C, Schwab JM, Tannast M, Siebenrock KA. Surgical hip dislocation for treatment of femoroacetabular impingement: factors predicting 5-year survivorship. Clin Orthop Relat Res. 2013;472:337–348. doi: 10.1007/s11999-013-3268-0. [DOI] [PMC free article] [PubMed] [Google Scholar]
- 28.Steppacher SD, Tannast M, Werlen S, Siebenrock KA. Femoral morphology differs between deficient and excessive acetabular coverage. Clin Orthop Relat Res. 2008;466:782–790. doi: 10.1007/s11999-008-0141-7. [DOI] [PMC free article] [PubMed] [Google Scholar]
- 29.Tannast M, Fritsch S, Zheng G, Siebenrock KA, Steppacher SD. Which radiographic hip parameters do not have to be corrected for pelvic rotation and tilt? Clin Orthop Relat Res., 2014 Sep 18 [Epub ahead of print]. [DOI] [PMC free article] [PubMed]
- 30.Tannast M, Goricki D, Beck M, Murphy SB, Siebenrock KA. Hip damage occurs at the zone of femoroacetabular impingement. Clin Orthop Relat Res. 2008;466:273–280. doi: 10.1007/s11999-007-0061-y. [DOI] [PMC free article] [PubMed] [Google Scholar]
- 31.Tannast M, Mistry S, Steppacher SD, Reichenbach S, Langlotz F, Siebenrock KA, Zheng G. Radiographic analysis of femoroacetabular impingement with Hip2Norm-reliable and validated. J Orthop Res. 2008;26:1199–1205. doi: 10.1002/jor.20653. [DOI] [PubMed] [Google Scholar]
- 32.Tannast M, Siebenrock KA, Anderson SE. Femoroacetabular impingement: radiographic diagnosis—what the radiologist should know. AJR Am J Roentgenol. 2007;188:1540–1552. doi: 10.2214/AJR.06.0921. [DOI] [PubMed] [Google Scholar]
- 33.Tannast M, Zheng G, Anderegg C, Burckhardt K, Langlotz F, Ganz R, Siebenrock KA. Tilt and rotation correction of acetabular version on pelvic radiographs. Clin Orthop Relat Res. 2005;438:182–190. doi: 10.1097/01.blo.0000167669.26068.c5. [DOI] [PubMed] [Google Scholar]
- 34.Tönnis D, Heinecke A. Acetabular and femoral anteversion: relationship with osteoarthritis of the hip. J Bone Joint Surg Am. 1999;81:1747–1770. doi: 10.2106/00004623-199912000-00014. [DOI] [PubMed] [Google Scholar]
- 35.Werner CM, Ramseier LE, Ruckstuhl T, Stromberg J, Copeland CE, Turen CH, Rufibach K, Bouaicha S. Normal values of Wiberg’s lateral center-edge angle and Lequesne’s acetabular index – a coxometric update. Skeletal Radiol. 2012;41:1273–1278. doi: 10.1007/s00256-012-1420-7. [DOI] [PubMed] [Google Scholar]
- 36.Wiberg G. The anatomy and roentgenographic appearance of a normal hip joint. Acta Chir Scand. 1939;83:7–38. [Google Scholar]
- 37.Williams PL, Warwick R, Dyson M, Bannister LH. The skeleton of the lower limb. In: William PL, editor. Gray’s Anatomy. Edinburgh, Scotland: Churchill Livingstone; 1989. pp. 422–446. [Google Scholar]
- 38.Zheng G, Tannast M, Anderegg C, Siebenrock KA, Langlotz F. Hip2Norm: an object-oriented cross-platform program for 3D analysis of hip joint morphology using 2D pelvic radiographs. Comput Methods Programs Biomed. 2007;87:36–45. doi: 10.1016/j.cmpb.2007.02.010. [DOI] [PubMed] [Google Scholar]


