Abstract
Background
Fat mass (FM) is measured with dual-energy X-ray absorptiometry (DXA), but is expensive and not portable. Multifrequency bioimpedance spectroscopy (BIS) measures total body water (TBW) and intracellular and extracellular water (ICW, ECW). Fat mass (FM) is calculated subtracting Fat Free Mass (FFM) from weight assuming fractional hydration of FFM of 0.73. Hemodialysis patients (HD), however, have non physiologic expansion of ECW. Our aim was to apply a model to estimate FM in HD and controls.
Methods
We estimated the hydration of FFM in healthy subjects (C) and HD with BIS (Impedimed multifrequency) assuming hydration of 0.73 or using a formula allowing ECW and ICW to vary, deriving a value for FM accounting for variances in ECW and ICW. FM was measured by DXA (Hologic Discovery W) in 25 C and in 11 HD. We measured TBW, ECW and ICW with BIS and calculated FM using either Weight - TBW/.73 or with a formula accounting for variations in ECW/ICW to estimate FM.
Results
ECW/ICW was greater in HD than in C (0.83±0.08 vs 0.76± 0.04; p=0.001). FM (Kg) measured by DXA, or estimated from TBW using constant hydration or accounting for variations in ECW/ICW were not significantly different in C or in HD. Values obtained by all methods correlated (p<0.001) and none of the Bland-Altman plots regressed (r2=0.00). FM measured by DXA and by BIS in both C and HD combined correlated (r2=0.871).
Conclusion
Expansion of ECW in HD is statistically significant, however the effect on hydration of FFM is insufficient to cause significant deviation from values derived using a hydration value of 0.73 within the range of expansion of ECW in the HD population studied here.
Keywords: body composition, fat mass, hemodialysis, extracellular water, intracellular water
Introduction
Poor nutritional status is strongly associated with morbidity and mortality in hemodialysis (HD) patients (1-3). Therefore, a valid tool for an accurate evaluation of body composition modifications of HD patients appears clinically relevant. Fat mass (FM) can be measured clinically by Dual Energy X-ray Absorptiometry (DXA), however these devices are not portable. Since body mass index (BMI) (kg/m2) does not distinguish muscle or other water containing compartments from fat, having a direct measure of FM may assist in understanding the association between BMI and outcomes in dialysis patients. Having access to a portable device that can provide reliable information therefore can be useful.
Both multifrequency and single frequency bio-impedance devices are portable and can be used to measure total body water (TBW) as well as to estimate the distribution of water between the extracellular and intracellular compartment, known as extracellular water (ECW) and intracellular water (ICW). FM is estimated as the difference between body weight and fat free mass (FFM) (4). The composition of FFM is complex and includes water found in both the extracellular and intracellular spaces, solutes contained in each of these fluid phases as well as components of limited hydration such as bone mineral (4). The hydration of FFM is assumed to be 0.73 and has been directly measured across a wide variety of mammals as diverse as the shrew, the cow and seals (5, 6).
Hydration of FFM is greater in new born mammals (7) and is also increased in elderly humans (8). In the case of differences within species and with age within species, the relative proportion of TBW that is distributed between intracellular water ICW and ECW is physiologically regulated. End-stage renal disease (ESRD) offers a non physiologic expansion of ECW that may confound estimates of hydration of FFM and lead to bias in the estimation of adiposity, since the hydration of ECW is approximately 0.98 (9). In particular, ESRD patients on HD can accumulate a large amount of fluid between dialysis sessions potentially altering the hydration of FFM introducing systemic error into measures of FM (10). In this view, the expanded ECW value could play a confounding effect in evaluating FM in HD patients (11-13).
Bioimpedance spectroscopy (BIS) is a clinically availably portable technique able to measure TBW and to discriminate between ICW and ECW compartments, more directly and accurately than single frequency techniques (14-16). In particular, this type of analysis is able to more precisely verify the effect of edema in HD patients (15).
Fat mass analysis by bioimpedance is useful not only in patients at nutritional risk, such as cancer and HD patients, but also in normal condition, such as sports medicine (15). In particular, bioimpedance is helpful to evaluate FM content at baseline and during patients or normal subjects ‘ follow-up. An accurate FM evaluation is useful in diagnosing and treating body composition alterations to improve nutritional status.
Dou et al. compared the accuracy of BIS in body fluid volume point estimation in HD patients, showing that body composition spectroscopy equations provide accurate estimation of ICW and TBW (17). Zhu et al. investigated the agreement between TBW and ECW measured by both whole body and segmental BIS and tracer dilution (deuterium oxide and sodium bromide) in dialysis patients and found significant agreement between measures of water and distribution of water by BIS techniques compared to those obtained by isotope dilution (18).
However, bioimpedance methods provide only an indirect assessment of FM requiring assumptions concerning the hydration of fat free mass (FFM). Although DXA is able to give a detailed and fairly accurate distribution of FFM, FM, and bone mineral content, it is an expensive device, is not portable and exposes subjects to radiation, albeit at low doses.
BIS is a non invasive technique used to evaluate TBW, ECW, and ICW. FFM is then determined assuming a hydration of FFM of 0.73 for TBW. FM is then determined as the difference between body weight and FFM, but its method is indirect and presumes an equivalent hydration of FFM between individuals having different body compositions and more importantly different distributions of water within the more greatly hydrated ECW and less hydrated ICW.
We used a previously described physiological modeling approach to calculate hydration of FFM within likely limits applied in the situation where ECW was expanded non -physiologically (9). Our aim was to find whether a constant hydration coefficient of FFM may affect the accuracy of FM evaluation in a group of HD patients.
We carried out the present study to apply the model proposed by Wang et al. (9) to estimate FM content in healthy subjects, using BIS and compare the FM value to the one obtained with DXA and applied the same model to calculate FM in a group of HD patients comparing these results to the one obtained with DXA within the same group to establish how potential expansion of ECW confounded estimates of FM in patients undergoing thrice weekly HD.
Materials and methods
The study was approved the Institutional Review Board at the University of California Davis as well as by Dialysis Clinics Incorporated (DCI). All subjects signed consent. BIS and DXA measurements were performed at the Clinical Translational Science Center (CTSC). Dialysis subjects were recruited from among prevalent HD patients. Written informed consent was obtained from all patients and from healthy subjects, before enrollment in the study. Exclusion criteria both for control and HD patients was the presence of diabetes (fasting blood sugar > 120 mg/dL or the use of anti-diabetic drugs) and use of lipid lowering medication and proteinuria in excess of 300 mg/day.
All subjects had been on maintenance HD for at least 3 months prior to study. They were studied on the day following dialysis. Weight was determined to 0.1 kg using Scale model # BWB-800 and height measured using a stadiometer (AYRTON model number S100)
Whole body BIS was performed using an Impedimed multifrequency device (Impedimed IMP SFB7 San Diego, Ca). The electrodes and recording pads were placed on the non-access side of the body in those patients having an arm access. In those patients with a catheter providing dialysis access the dominant arm was chosen. All the subjects were in supine position with four gel-type electrodes, two voltage and two current ones, pasted on the right foot and wrist. Two pairs electrodes were placed: on the hand to foot for injecting current with frequency from 4 kHz to 1 MHz, and on the wrist to ankle for measuring voltage, respectively. Data derived from these measurements included resistance, reactance, phase angle and impedance. DXA was performed with a whole body scanner using a Hologic Discovery W (Denver CO) using Apex 3.1 software.
The output from the BIS provided an estimate of TBW, ICW and ECW. We calculated FM as the difference between body weight and FFM. We estimated the hydration of FFM at 73% (FFM = TBW/0.73) or used a formula that calculates hydration of FFM that allows ECW and ICW to vary (TBW/FFM = 1 +ECW/ICW/(1.569+1.16*(ECW/ICW) (9). The authors proposed this equation to solve questions related to hydration stability, including body mass and age effects. The physiological model reveals that four water-related ratios combine to produce the observed TBW-to FFM ratio over the human life span. This equation provides a conceptual framework for the TBW-fat estimation method. Therefore, we tested this method in the circumstance of expected ECW expansion, in HD patients.
We then calculate a value for hydration of FFM to correct for the effects of non physiologic expansion of ECW to be applied to both HD patients and normal subjects.
FM was measured directly by DXA in 25 healthy subjects (11 male and 14 female; C group) median age 40.5 y (20-53 y) , weight 76.1 kg (48.3-105.3 kg), body mass index (BMI; kg/m2) 25.3 (17.5-34), and in 11 HD patients (10 male and 1 female) (D group) with median (range) age 46 y (21-55 y), weight 97 kg (55.2-120.9 kg), BMI of 30 (20.9-36.9). We measured TBW, ECW and ICW with BIS and calculated FM using either Weight - TBW/.73 or with the formula to account for differences in ECW/ICW to estimate FM.
Ten of the patients were maintained on regular HD, three times a week, for sessions ranging from 3 to 4 hours (average 3.5 ± 0.4hr). One patient was dialyzed 4 times a week with a treatment time of 4 hours. All patients were treated with high permeability flux membranes. Average Kt/V for patients dialyzed 3 times a week was Kt/V was 1.42 ± 0.22. Treatment Kt/V for the patient dialyzed 4 times a week was 0.88.
All patients were taking antihypertensive medications including angiotensin-converting enzyme inhibitors, angiotensin II receptor antagonists, calcium channel blockers, and vitamin supplements. All HD patients were under weekly treatment with erythropoietin. Height and weight were measured in both HD patients and control subjects at the time that body composition measurements were performed. Both DXA and BIS measures were performed on the same day in the fasting state, and with regard to the HD patients, the measurements were performed on a mid week non-dialysis day.
Data are given as Mean ± SD. Student’s t test for unpaired data and Mann-Whitney test for parametric and non-parametric statistical analysis, respectively, and ANOVA test were used as appropriate. The association of effects of age, sex, BMI, and treatment on outcome variables were analyzed by forward stepwise multiple regression analysis. The presence of significant correlations was assessed according to Spearman’s test. Bland Altman plots to compare the measurement techniques were used. A p value of < 0.05 was considered statistically significant.
Results
Anthropometric, demographic, and body composition characteristics of HD patients and control group are reported in Table 1. ECW/ICW was significantly greater in D group than in C group (0.83±0.08 vs 0.76± 0.04; p=0.001) (Table 1). When analyzed by multiple regression analysis this effect was independent of age, sex, race, BMI and total body fat measured by DXA and only a function of being on dialysis (r2 for the model= 0.242; p=0.003). ECW/TBW for HD patients was also significantly greater than for controls (0.452 ± 0.02 vs 0.431 ± 0.01; p=0.003). Hydration of FFM (TBW/FFM) calculated from the model was significantly greater in HD patients than in controls (0.722±0.005 vs 0.718±0.003; p=0.005), although in both cases less than the assumption of hydration of 0.73.
Table 1.
Demographic, anthropometric, and body composition parameters in hemodialysis (HD) patients (D group) and healthy subjects (C group) (mean ± SD)
|
D group (n = 11) |
C group (n = 25) |
|
|---|---|---|
| Sex, n (male: female) | 10:1 | 11:14 |
| Age, years (median; range) | 46 (21-55) | 40 (20-53) |
| Weight, kg | 92.48±22.1* | 76.2±19.89 |
| Race (AA:C:A:H:O) | 7:4:0:0:0 | 3:12:4:5:1 |
| BMI | 29.8±5.5* | 25.7±4.67 |
| ECF (BIS) | 22.13±4.85# | 17.20±5.09 |
| ICF(BIS) | 26.81±5.71 | 22.76±6.73 |
| ECF/ICF (BIS) | 0.83±0.08° | 0.76±0.04 |
| TBW (BIS) | 48.94±10.29* | 39.86±11.65 |
| FFM (BIS, %) | 72.92±5.42 | 71.46±8.81 |
| BCM (DXA) | 2.67±0.45 | 2.50±0.52 |
| BMD (DXA) | 1.21 ± 0.14 | 1.22± 0.12 |
| FFM (DXA, Kg) | 61.09±13.43* | 48.79±14.04 |
| FFM + BMD (DXA, Kg) | 63.76±13.62* | 51.29±14.51 |
| Body Mass (DXA, Kg) | 89.46±21.38* | 73.96±19.22 |
| Trunk Fat (DXA, %) | 28.2±7.59 | 31.52.±9.1 |
p<0.05;
p=0.01;
p<0.01
AA (African American), C (Caucasian), A (Asian), H (Hispanic), O (Other), Body Mass Index (BMI), Extracellular Fluid (ECF), Intracellular Fluid (ICF), Total Body Water (TBW), Fat Free Mass (FFM), Body Cell Mass (BCM), Bone Mineral Density (BMD), Biompedance Spectroscopy (BIS), Dual Energy X-ray Absorptiometry (DXA).
We also analyzed ECW/TBW vs difference between FM by DXA and FM by BIS, and we found no correlation between ECW/TBW and no difference by both methods in HD patients (r2=0.007) and in controls (r2=0.0002).
The FM (Kg) estimated by DXA, whole body BIS and the model respectively were not statistically different in HD patients (25.7±9.7, 25.6±9.5, 24.7±9.4, p=n.s), in control subjects (22.7 ± 8.9, 21.6 ± 8.9, 20.7 ± 9.1, p=n.s.). FM measured by DXA was not significantly different between C and 22.7 ± 8.9 kg in C and HD 25.7 ± 9.7 kg in HD (p=0.4).
The correlation between estimated adiposity using either a fixed or variable estimation of FFM from BIS or the model to allow ECW and ICW to vary independently and DXA correlated (p< 0.001).
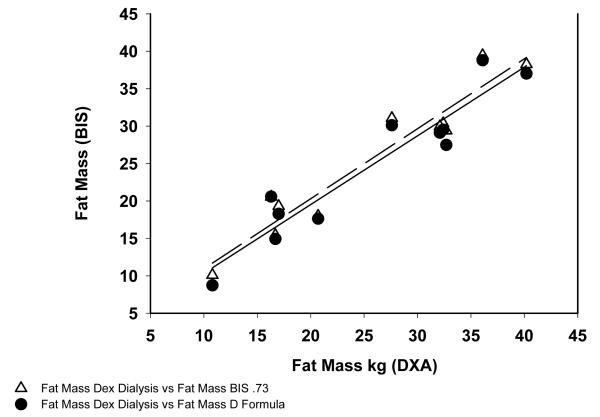
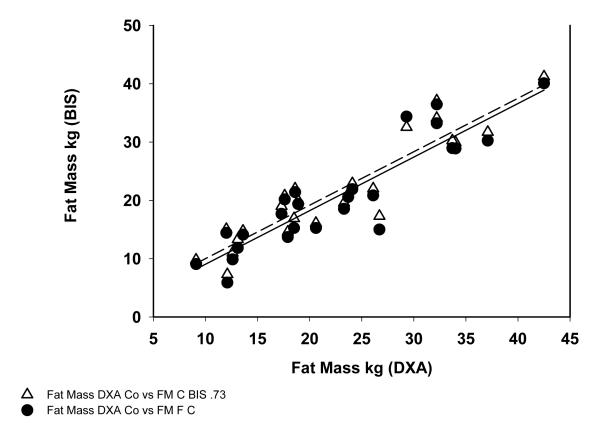
In HD patients the correlation coefficient between FM measured by DXA and BIS was r2=0.914 and FM by DXA vs the model was r2=0.90 (Figure 1). For control subjects the correlation between FM measured DXA and BIS was r2=0.85 and between DXA and the variable hydration model was r2=0.82 (Figure 2).
Fig 1.
Correlation between Fat Mass Measured in Hemodialysis patients by DXA, BIS and Variable Hydration Formula.
Fig 2.
Correlation between Fat Mass Measured in Control group by DXA, BIS and Variable Hydration Formula.
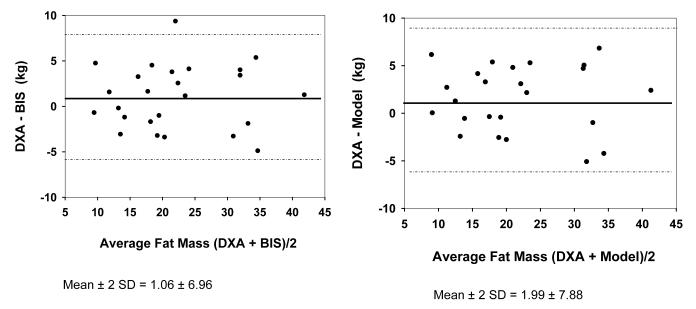
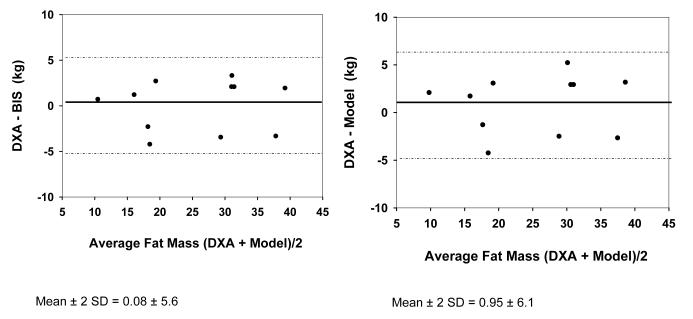
Bland-Altman plots did not regress in either group using either hydration of FFM as 0.73 or the model (r2=0.00 for all models in both Figures 3 and 4). For control subjects, FM was 1.06 ± 3.48 kg less than estimated by BIS assuming hydration of 0.73, and was 1.99 ± 3.94 kg less than with use of the model. These differences were not significant for the group. For dialysis subjects, FM was 0.079 ± 2.81 kg less with use of BIS assuming hydration of 0.73 and was 0.95 ± 3.07 kg less with use of the model. These differences were not statistically significant for the group.
Fig. 3.
Bland-Altman Plot for Fat Mass by DXA vs BIS (left side) and DXA vs Model (right side) in Control group.
Fig. 4.
Bland-Altman Plot for Fat Mass by DXA vs BIS (left side) and DXA vs Model (right side) in Hemodialysis patients.
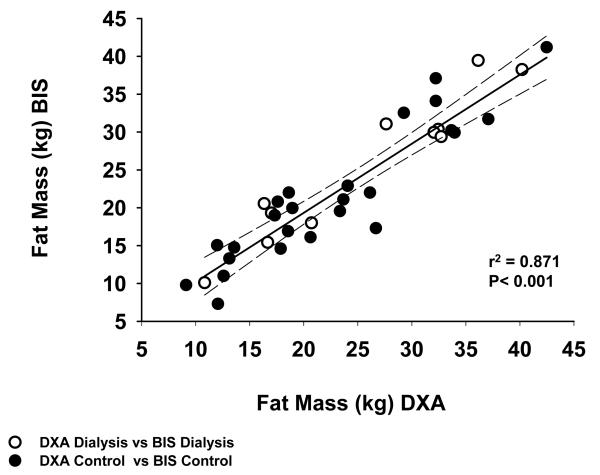
FM measured by DXA and BIS correlated with one another r2 = 0.87 for all subjects combined (Figure 5) when using the estimation of hydration of FFM of 0.73 for both HD and C. By contrast, the correlations between FM mass measured by any of the modalities and BMI, while significant, correlated less well (BMI vs FM by DXA r2 = 0.58 for all patient combined, BMI vs FM by BIS r2 = 0.52 for all patients combined, BMI vs FM by the variable hydration model, r2 = 0.50; data not shown).
Fig. 5.
Correlation between Fat Mass Measured by BIS and DXA in Control and Hemodialysis Patients.
Discussion
Body mass index (BMI), the formula which considers body weight divided by height squared, is one of the most used anthropometric parameter to evaluate nutritional status. The most relevant limitation of BMI, as a nutritional marker, is its inability to distinguish among the alterations of the human body’s composition and to distinguish FM from body cell mass as well as to estimate any pathologic contribution to body composition contributed by pathologic expansion of ECW as might occur in subjects with renal failure. Measurement of TBW provides a measure of hydration than can be used to calculate FM, as well as measurement of ICW providing further evaluation of body cell mass. Several studies highlighted the role FM depletion as a strong predictor of increased morbidity and mortality in HD patients (19, 20). Thus having the capacity to measure FM provides clinically important information beyond that derived from measurement of BMI alone.
Measurement of TBW, ICW and ECW directly, while outside the scope of clinical determinations, can be accomplished by isotope or chemical dilution, using D2O, total body potassium (TBK) and dilution of solutes that are confined to the extracellular space such as bromide (21). By contrast measurement of FM experimentally is more challenging. Direct measurement of FM (as opposed to adiposity) is carried out by tissue extraction of whole body homogenates of carcasses with organic solvents that are then dried to constant weight (22). In living humans FM is measured by the uptake of cyclopropane or radioactive 85Kr, both substances that are insoluble in water (23). FM includes cell membranes and non-adipose tissue that contain lipids, while adipose tissue is partially hydrated. Measures of FM and adiposity therefore, while generally correlated with one another are not equivalent.
DXA is the clinically relevant gold-standard to evaluate body composition in human subjects and has been used in HD patients especially for estimating FM (24, 25). However, DXA does not measure body fluid compartments and does not allow one to evaluate distribution of TBW between ECW and ICW so as to estimate body cell mass. In fact, the body fluid content could potentially have a significant impact on the measurement of FM and FFM by DXA (25). We find that the significant expansion of ECW demonstrated in HD patients here effected only a minimal and non-significant estimation of FM when compared to the assumption of a uniform hydration of FFM of 0.73. A possible explanation for this phenomenon may be related to the minimal influence of the expansion of ECW on the hydration of FFM, as demonstrated in dialysis patients (26). Furthermore the FM calculated by DXA and FM calculation by BIS using the unadjusted measurement of TBW correlated more closely with one another than did FM and BMI. Thus use of TBW output from multifrequency BIS for estimation of FM provides a more accurate measure of body composition and FM than does BMI, even in the presence of expansion of the essentially fat free ECW compartment.
However, the assumption of hydration of FFM of 0.73 yielded a measure of adiposity that was not significantly different than that obtained with DXA, and while use of the formula that allows ECW and ICW to vary independently produced a measure of FM that was somewhat less than that assuming hydration of FFM of 0.73, the differences between the estimates were small and not statistically significant, and without bias, suggesting that BIS is an appropriate tool for measuring adiposity both in normal subjects and in HD patients (9). In the case of control subjects both the assumption of hydration of FFM of 0.73 and the model yielded measures of FM that were slightly and not significantly less than DXA, with the lowest value yielded by the model. In the case of the dialysis patients, who were significantly volume expanded in comparison to the control subjects, the assumption of hydration of FFM of 0.73 yielded a value that was nearly identical to that provided by DXA, while the model accounting for variable hydration yielded a slightly lower measure of FM, similar to what was found for the control subjects. Although our interpretation of the results obtained in this study is in line with the existing literature, we acknowledge that our study has some limitations, including the small number of patients and controls enrolled, the lack of appropriate balance in gender in HD group and the difference in body weight at baseline between groups.
Conclusion
Our data show that the value for FM calculated both in healthy control subjects and, in particular, in HD patients were comparable to those obtained using DXA, despite significant variations in hydration between dialysis patients and normal subjects.
Acknowledgment
This research was supported by funds from Dialysis Clinics Incorporated and was supported by the UC Davis Clinical and Translational Science Center NIH grant # RR 0024146.
References
- 1).Muscaritoli M, Molfino A, Bollea MR, Rossi Fanelli F. Malnutrition and wasting in renal disease. Curr Opin Clin Nutr Metab Care. 2009;12:378–383. doi: 10.1097/MCO.0b013e32832c7ae1. [DOI] [PubMed] [Google Scholar]
- 2).Bossola M, Muscaritoli M, Tazza L, Giungi S, Tortorelli A, Rossi Fanelli F, Luciani G. Malnutrition in hemodialysis patients: what therapy? Am J Kidney Dis. 2005;46:371–386. doi: 10.1053/j.ajkd.2005.05.031. [DOI] [PubMed] [Google Scholar]
- 3).Garibotto G, Bonanni A, Verzola D. Effect of kidney failure and hemodialysis on protein and amino acid metabolism. Curr Opin Clin Nutr Metab Care. 2012;15:78–84. doi: 10.1097/MCO.0b013e32834d9df6. [DOI] [PubMed] [Google Scholar]
- 4).Shizgal HM. Nutritional assessment with body composition measurements by multiple isotope dilution. Infusionstherapie. 1990;17:9–17. doi: 10.1159/000222545. [DOI] [PubMed] [Google Scholar]
- 5).Sheng HP, Huggins RA. A review of body composition studies with emphasis on total body water and fat. Am J Clin Nutr. 1979;32:630–647. doi: 10.1093/ajcn/32.3.630. [DOI] [PubMed] [Google Scholar]
- 6).Schoeller DA. Hydrometry: Human body composition. In: Roche AF, Heymsfield SB, Lohman TG, editors. Human Kinetics. 1996. pp. 25–44. [Google Scholar]
- 7).Schmidt-Nielsen K. In: Why is Animal Size So Important? Scaling, editor. Cambridge Univ. Press; Cambridge, UK: 1984. [Google Scholar]
- 8).Ellis KJ. Reference man and woman more fully characterized; validations on the basis of body size, age, and race. Biol Trace Elem Res. 1990;26-27:385–400. doi: 10.1007/BF02992693. [DOI] [PubMed] [Google Scholar]
- 9).Wang Z, Deurenberg P, Wang W, Pietrobelli A, Baumgartner RN, Heymsfield SB. Hydration of fat-free body mass: new physiological modeling approach. Am J Physiol Endocrinol Metab. 1999;276:E995–E1003. doi: 10.1152/ajpendo.1999.276.6.E995. [DOI] [PubMed] [Google Scholar]
- 10).Houtkooper LB, Lohman TG, Going SB, Howell WH. Why bioelectrical impedance analysis should be used for estimating adiposity. Am J Clin Nutr. 1996;64:436–448. doi: 10.1093/ajcn/64.3.436S. [DOI] [PubMed] [Google Scholar]
- 11).Woodrow G, Oldroyd B, Turney JH, Day JME, Smith MA. Measurement of total body water by bioelectrical impedance in chronic renal failure. Eur J Clin Nutr. 1996;50:676–681. [PubMed] [Google Scholar]
- 12).Pastan S, Gassensmith C. Total body water measured by bioelectrical impedance in patients after hemodialysis: comparison with urea kinetics. ASAIO J. 1992;98:M186–189. doi: 10.1097/00002480-199207000-00016. [DOI] [PubMed] [Google Scholar]
- 13).Scanferla F, Landini S, Fracasso A, Morachiello P, Righetto F, Toffoletto PP, Bazzato C. On-line bioelectric impedance during hemodialysis: monitoring of body fluids and cell membrane status. Nephrol DialTransplant. 1990;(Supp.1):167–170. doi: 10.1093/ndt/5.suppl_1.167. [DOI] [PubMed] [Google Scholar]
- 14).Matthie J, Zarowitz B, De Lorenzo A, Andreoli A, Katzarski K, Pan G, Withers P. Analytic assessment of the various bioimpedance methods used to estimate body water. Appl Physiol. 1998;84:1801–1816. doi: 10.1152/jappl.1998.84.5.1801. [DOI] [PubMed] [Google Scholar]
- 15).Ellis KJ, Bell SJ, Chertow GM, Chumlea WC, Knox TA, Kotler DP, Lukaski HC, Schoeller DA. Bioelectrical impedance methods in clinical research: A follow-up to the NIH technology Assessment Conference. Nutrition. 1999;15:874–880. doi: 10.1016/s0899-9007(99)00147-1. [DOI] [PubMed] [Google Scholar]
- 16).Hannan WJ, Cowen SJ, Plester CE, Fearon KCH, DeBeau A. Comparision of bio-impedance spectroscopy and multi-frequency bio-impedance analysis for the assessment of extracellular and total body water in surgical patients. Clin Sci. 1995;89:651–658. doi: 10.1042/cs0890651. [DOI] [PubMed] [Google Scholar]
- 17).Dou Y, Liu L, Cheng X, Cao L, Zuo L. Comparison of bioimpedance methods for estimating total body water and intracellular water changes during hemodialysis. Nephrol Dial Transplant. 2011;26:3319–3324. doi: 10.1093/ndt/gfq854. [DOI] [PubMed] [Google Scholar]
- 18).Zhu F, Kuhlmann MK, Kaysen GA, Sarkar S, Kaitwatcharachai C, Khilnani R, Stevens L, Leonard EF, Wang J, Heymsfield S, Levin NW. Segment-specific resistivity improves body fluid volume estimates from bioimpedance spectroscopy in hemodialysis patients. J Appl Physiol. 2006;100:717–724. doi: 10.1152/japplphysiol.00669.2005. [DOI] [PubMed] [Google Scholar]
- 19).Kakiya R, Shoji T, Tsujimoto Y, Tatsumi N, Hatsuda S, Shinohara K, Kimoto E, Tahara H, Koyama H, Emoto M, Ishimura E, Miki T, Tabata T, Nishizawa Y. Body fat mass and lean mass as predictors of survival in hemodialysis patients. Kidney Int. 2006;70:549–556. doi: 10.1038/sj.ki.5000331. [DOI] [PubMed] [Google Scholar]
- 20).Huang CX, Tighiouart H, Beddhu S, Cheung AK, Dwyer JT, Eknoyan G, Beck GJ, Levey AS, Sarnak MJ. Both low muscle mass and low fat are associated with higher all-cause mortality in hemodialysis patients. Kidney Int. 2010;77:642–629. doi: 10.1038/ki.2009.524. [DOI] [PMC free article] [PubMed] [Google Scholar]
- 21).Silva AM, Heymsfield SB, Gallagher D, Albu J, Pi-Sunyer XF, Pierson RN, Wang J, Heshka S, Sardinha LB, Wang Z. Evaluation of between-methods agreement of extracellular water measurements in adults and children. Am J Clin Nutr. 2008;88:315–323. doi: 10.1093/ajcn/88.2.315. [DOI] [PMC free article] [PubMed] [Google Scholar]
- 22).Wang Z, Deurenberg P, Wang W, Pietrobelli A, Baumgartner RN, Heymsfield SB. Hydration of fat-free body mass: review and critique of a classic body-composition constant. Am J Clin Nutr. 1999;69:833–41. doi: 10.1093/ajcn/69.5.833. [DOI] [PubMed] [Google Scholar]
- 23).Lesser GT, Markofsky J. Body water compartments with human aging using fat-free mass as the reference standard. Am J Physiol. 1979;236:R215–R220. doi: 10.1152/ajpregu.1979.236.3.R215. [DOI] [PubMed] [Google Scholar]
- 24).Locatelli F, Fouque D, Heimburger O, Drüeke TB, Cannata-Andía JB, Hörl WH, Ritz E. Nutritional status in dialysis patients: a European consensus. Nephrol Dial Transplant. 2002;17:563–572. doi: 10.1093/ndt/17.4.563. [DOI] [PubMed] [Google Scholar]
- 25).Van den Ham ECH, Kooman JP, Christiaans MHL, Nieman FH, Van Kreel BK, Heidendal GA, Van Hooff JP. Body composition in renal transplant patients: bioimpendance analysis compared to isotope dilution, dual energy x-ray absorptiometry, and anthropometry. J Am Soc Nephrol. 1999;10:1067–1079. doi: 10.1681/ASN.V1051067. [DOI] [PubMed] [Google Scholar]
- 26).Woodrow G, Oldroyd B, Wright A, Coward WA, Turney JH, Brownjohn AM, Smith MA, Truscott JG. Abnormalities of body composition in peritoneal dialysis patients. Perit Dial Int. 2004;24:169–175. [PubMed] [Google Scholar]


