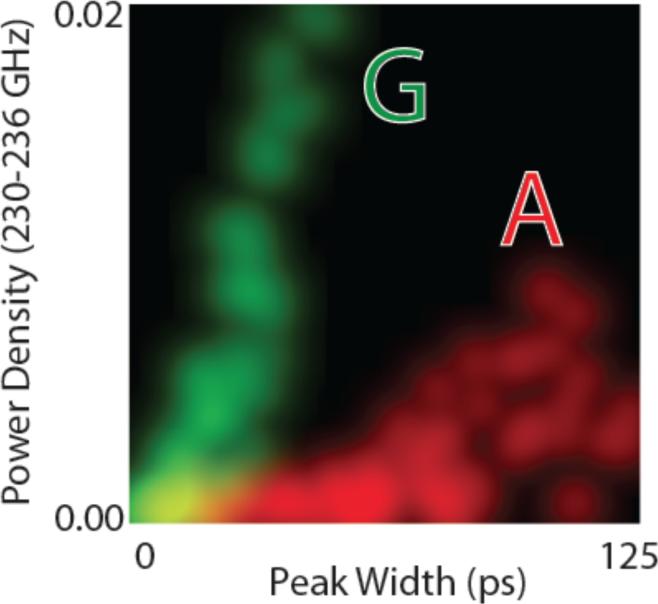
Figure 6.
Distribution of a power spectrum component for 230-236 GHz (intensity of points projected onto the vertical axis) against the distribution of peaks widths (intensity of points projected onto the horizontal axis) for Z-A interactions (red) and Z-G interactions (green). This is a color-mixed plot, so that overlapped data produces a yellow color (points are blurred to allow overlap). Note that if the distributions for A and G were plotted with only one parameter as a conventional (1D) histogram, most of the data points would be overlapped. Non-linear correlations between the two signal features result in enhanced separation in this 2D analysis.

