

Abstract
Purpose
This study aimed to determine the expression and clinical significance of proteins that are involved in lipid metabolism in human breast tumors.
Methods
Tumors from 476 breast cancer patients were used to construct tissue microarrays. Then, immunohistochemistry (IHC) for hormone-sensitive lipase (HSL), Perilipin 1 (PLIN1), fatty acid binding protein 4 (FABP4), carnitine palmitoyltransferase IA (CPT-1A), acyl-CoA oxidase 1 (ACOX-1), and fatty acid synthase (FASN) was performed on these microarrays.
Results
Breast tumors were classified into 4 subtypes: luminal A (n = 242; 50.8%), luminal B (n = 134; 28.2%), human epidermal growth factor receptor 2 (HER2) (n = 50; 10.5%), and triple negative breast cancer (TNBC) (n = 50; 10.5%). The expression of PLIN1 (p < 0.001), FABP4 (p = 0.029), CPT-1A (p = 0.001), ACOX-1 (p < 0.001), and FASN (p < 0.001) differed significantly among these tumor subtypes. Notably, PLIN1, CPT-1A, and FASN expression was highest in HER2 tumors and lowest in TNBC tumors. Similarly, the expression of FABP4 and ACOX-1 was highest in HER2 tumors and lowest in luminal A tumors. In addition, ACOX-1 positivity was associated with significantly shorter overall survival (p = 0.018). When tumor subtype was considered, FABP4 positivity was associated with significantly shorter disease-free survival (p = 0.005) and overall survival (p = 0.041) in TNBC.
Conclusion
Lipid metabolism-related proteins are differentially expressed in different IHC subtypes of breast cancer and some are associated with decreased survival rates.
Introduction
In oncology, the Warburg effect describes a significant metabolic change in energy production from oxidative phosphorylation in normal cells to aerobic glycolysis in cancer cells [1]. However, this definition is somewhat simplistic as tumors can use several different metabolic mechanisms to produce energy, depending on the type of tumor [2], which complicates targeted delivery of metabolic inhibitors to cancer cells. One such mechanism is lipid metabolism, which involves lipid synthesis, lipid degradation and catabolism, and fatty acid (FA) oxidation. Lipid synthesis includes FA and triacylglycerol (TAG) synthesis by fatty acid synthase (FASN) [3], and lipid degradation and catabolism include TAG, cholesterol ester, and phospholipid hydrolysis. A key enzyme in this process is hormone-sensitive lipase (HSL) [4–6]. FA oxidation involves catabolism of free fatty acids in the mitochondria to produce energy. Carnitine palmitoyltransferase IA (CPT-1A) and acyl-CoA oxidase 1 (ACOX-1) are two important enzymes in this process [5–7]. Aside from this process, lipid transport and uptake are indeed an important and under-appreciated aspect of lipid metabolism in cancer [8,9]. Two important proteins in this process are fatty acid binding protein 4 (FABP4), which transports free fatty acids, and Perilipin 1 (PLIN1), which helps to regulate triacylglycerol storage by suppressing its hydrolysis [10]. In addition, it is also becoming clear that lipid droplets are more than just passive storage components and are important in cancer as well, in particular for survival under stressful conditions [11,12], where lipid droplet proteins (HSL and PLIN1) play an important role.
Due to the clinical, histological, and molecular heterogeneity of breast tumors, many classification schemes have been proposed to group tumors with similar features. For example, gene profiling analyses of breast tumors have suggested 5 molecular subtypes, namely, luminal A, luminal B, HER2, normal breast-like, and basal-like) [13]. Since these subtypes differ in terms of their histology, clinical behavior, and therapeutic response, it is not surprising that they use metabolic pathways differentially. Indeed, previous studies have shown that proteins that are involved in glycolysis [14,15], glutaminolysis [16], and glycine or serine metabolism [17] are differentially expressed among different tumor subtypes. However, little is known about the differential expression of proteins that are involved in lipid metabolism in different breast cancer subtypes. As a result, this study aimed to determine the expression and clinical significance of proteins that are involved in lipolysis and mitochondrial β-oxidation in different breast cancer subtypes.
Methods
Cell culture and western blot
Five breast cancer cell lines, namely, MCF-7, MDA-MB-453, MDA-MB-435S, MDA-MB-231, and MDA-MB-468, were obtained from the American Type Culture Collection (ATCC). MDA-MB-435S, MDA-MB-231, and MDA-MB-468 cells were grown in Dulbecco’s modified Eagle’s medium (DMEM) supplemented with 10% fetal bovine serum (FBS) and 1% penicillin-streptomycin (Hyclone) in a humidified incubator with 5% CO2 at 37°C. MCF-7 cells were cultured in DMEM without phenol red (Gibco) supplemented with 10% FBS, 1% penicillin-streptomycin, and 10 mg/mL insulin. MDA-MB-453 cells were maintained in L-15 medium (ATCC) supplemented with 10% FBS.
Cells were harvested and lysed in RIPA buffer (50 mM Tris-HCl pH 7.4, 1% nonyl phenoxypolyethoxylethanol, 0.25% sodium deoxycholate, 150 mM NaCl, 1 mM ethylenediaminetetraacetic acid, and 0.1% sodium dodecyl sulfate [SDS]) containing protease inhibitors. Subsequently, lysates were centrifuged at 13,000 g for 15 min at 4°C. Protein concentrations were measured by using the bicinchoninic acid assay (Thermo-Scientific). An equal amount of protein from each sample was separated by SDS polyacrylamide gel electrophoresis and then blotted onto nitrocellulose membranes (Bio-Rad). The membranes were blocked with 7% nonfat dry milk in phosphate-buffered saline with Tween 20, and then incubated with primary antibodies against HSL, PLIN1, FABP4, CPT-1A, ACOX-1, and β-actin (Table 1) for 1 hour at room temperature. Then, the membranes were incubated with a horseradish peroxidase-conjugated secondary antibody for 1 hour at room temperature. Finally, the bound antibodies were visualized by using an enhanced chemiluminescent reagent (GE Healthcare Life Sciences). All antibodies were purchased from Abcam.
Table 1. Source, clone, and dilution of used antibodies.
| Antibody | Clone | Catalogue number | Antigen retrieval | Dilution | Company |
|---|---|---|---|---|---|
| Molecular subtype-related | |||||
| ER | SP1 | RM-9101-S | Citric acid / microwave | 1:100 | Thermo Scientific, CA, |
| USA | |||||
| PR | PgR 636 | M3569 | Citric acid / microwave | 1:50 | DAKO, Denmark |
| HER2 | Polyclonal | A0485 | Citric acid / microwave | 1:1500 | DAKO, Denmark |
| Ki-67 | MIB-1 | M7240 | Citric acid / microwave | 1:150 | DAKO, Denmark |
| Lipolysis-related | Citric acid / microwave | ||||
| HSL | Polyclonal | ab45422 | Citric acid / microwave | 1:100 | Abcam, Cambridge, UK |
| PLIN1 | Polyclonal | ab61682 | Citric acid / microwave | 1:100 | Abcam, Cambridge, UK |
| FABP4 | Polyclonal | ab13979 | Citric acid / microwave | 1:100 | Abcam, Cambridge, UK |
| CPT-1 | 8F6AE9 | ab128568 | Citric acid / microwave | 1:200 | Abcam, Cambridge, UK |
| Acyl-CoA oxidase 1 | Polyclonal | ab128549 | Citric acid / microwave | 1:50 | Abcam, Cambridge, UK |
| FASN | EPR7466 | ab128870 | Citric acid / microwave | 1:200 | Abcam, Cambridge, UK |
Patients selection
The study group consisted of 476 patients who were diagnosed with invasive breast cancer and underwent surgical excision at Yonsei University Severance Hospital (Seoul, Korea) between January 2002 and December 2006. Patients who received preoperative hormonal therapy or neoadjuvant chemotherapy were excluded from the study. This study was approved by the Institutional Review Board of Yonsei University Severance Hospital.
Hematoxylin and eosin (H&E)-stained tumor sections were retrospectively reviewed by a breast pathologist who graded the tumor using the Nottingham grading system [18]. For each patient, age at the time of initial diagnosis, lymph node metastasis, tumor recurrence, distant metastasis, and survival were recorded.
Construction of tissue microarrays
A representative area was selected from a H&E section and the corresponding area was marked on the surface of the paraffin-embedded tissue block. Then, a paraffin tissue punch was used to extract a 3 mm core sample from the selected area, which was placed into a 6 × 5 recipient block. Two tissue cores were extracted to reduce sampling bias. Each core was assigned a unique tissue microarray location number, which was linked to a database that contained other clinicopathological data.
Immunohistochemistry
All immunohistochemical staining was performed on formalin-fixed, paraffin-embedded tissue sections. Briefly, 5 μm-thick sections were cut with a microtome, transferred onto adhesive slides, and then dried at 62°C for 30 minutes. All slides were incubated with primary antibodies (Table 1). After applying primary antibodies, blocking time was 2 hours at 37°C. Subsequently, immunodetection was performed by using a commercial streptavidin-biotin kit according to the manufacturer’s instructions, which involved incubation with biotinylated anti-mouse or anti-rabbit immunoglobulin, followed by peroxidase-labeled streptavidin and 3,3′-diaminobenzidine chromogenic substrate. The primary antibody incubation step was omitted in the negative control. Finally, the slides were counterstained with Harris hematoxylin.
Interpretation of immunohistochemical staining
The status of all immunohistochemical markers was determined by using light microscopy to assess the fraction of stained cells. HSL, PLIN1, FABP4, CPT-1A, ACOX-1, and fatty acid synthase (FASN) immunostaining were scored as the product of the proportion of stained cells (0 = no staining, 1 = less than 30%, or 2 = more than 30%) and staining intensity (0 = no staining, 1 = weak, 2 = moderate, or 3 = strong). The scores for the proportion of stained cells and the staining were multiplied to provide a total score. A total score of 2–6 was considered positive, while a score of 0 or 1 was considered negative [19]. Similarly, Ki-67 immunostains were scored as the percentage of stained tumor cells, which was defined as the Ki-67 labeling index (LI). In addition, estrogen receptor (ER) and progesterone receptor (PR) positivity were defined as one percent or more cells having positively stained nuclei [20].
HER2 immunohistochemistry (IHC) results were classified according to American Society of Clinical Oncology/College of American Pathologists (ASCO/CAP) guidelines, which includes the following categories: 0 = no immunostaining; 1+ = weak/incomplete membrane staining in less than 10% of tumor cells; 2+ = complete membrane staining that is either uniform or weak in at least 10% of all tumor cells; and 3+ = uniform, intense membrane staining in at least 30% of tumor cells. HER2 positivity was defined as IHC 3+, while IHC 0 or 1+ were considered to be HER2 negative [21]. However, IHC 2+ is an equivocal classification, so in these cases, HER2 expression was further evaluated with fluorescence in situ hybridization (FISH).
Fluorescence in situ hybridization (FISH) analysis
FISH was performed by using a PathVysion HER2 DNA Probe Kit (Vysis, Downers Grove, IL, USA) according to the manufacturer’s instructions. Then, the HER2 gene copy number was quantified by using an epifluorescence microscope (Olympus, Tokyo, Japan). At least 60 tumor cell nuclei from three separate regions were used to measure signals from DNA probes specific for HER2 and the centromeric region of chromosome 17 (CEP17). HER2 gene amplification was determined according to ASCO/CAP guidelines [21]. Specifically, HER2 negativity was defined as a dual-probe HER2/CEP17 signal ratio less than 1.8 with an absolute HER2 gene copy number of less than 4 signals per cell. On the other hand, a HER2/CEP17 ratio greater than 2.2 with an absolute HER2 gene copy number of greater than 6 signals per cell was considered to be HER2 positive. HER2/CEP17 ratios between 1.8 and 2.2 or absolute HER2 copy numbers between 4 and 6 were considered to be HER2 equivocal.
Classification of tumor phenotypes
Breast tumor phenotypes were classified into four subtypes according to their IHC results for ER, PR, and Ki-67 and IHC/FISH results for HER2 as follows: (1) luminal A = ER+ and/or PR+, HER2-, and Ki-67 LI <14%; (2) luminal B = ER+ and/or PR+, HER2-, and Ki-67 LI ≥14%; or ER+ and/or PR+ and HER2+; (3) HER2 = ER-, PR-, and HER2+; and (4) triple negative breast cancer (TNBC) = ER-, PR-, and HER2− [22].
Statistical analyses
Student’s t test and Fisher’s exact test were used to detect statistically significant differences (p < 0.05) in continuous and categorical variables, respectively. Kaplan-Meier survival curves and log-rank statistics were also used to estimate disease-free survival (DFS) and overall survival (OS) rates. Multivariate regression analysis was performed with the Cox proportional hazards model. All statistical analyses were calculated with SPSS for Windows, version 12.0 (SPSS Inc., Chicago, IL, USA).
Results
Patient characteristics
The clinicopathological characteristics of the 476 female patients in this study are shown in Table 2. The distribution of tumor subtypes was as follows: 242 luminal A (50.8%), 134 luminal B (28.2%), 50 HER2 (10.5%), and 50 TNBC (10.5%). When comparing clinicopathologic factors among molecular subtypes, TNBC tumors tended to have a higher histologic grade (p < 0.001) and higher Ki-67 LI (p < 0.001) than other subtypes.
Table 2. Clinicopathologic characteristics of patients according to breast cancer phenotype.
| Parameter | Total | Luminal A | Luminal B | HER2 | TNBC | P-value* |
|---|---|---|---|---|---|---|
| (n = 476) | (n = 242) | (n = 134) | (n = 50) | (n = 50) | ||
| (100%) | (50.8%) | (28.2%) | (10.5%) | (10.5%) | ||
| Age (Years, mean ±SD) | 50.5±10.3 | 51.0±10.3 | 47.9±9.7 | 53.3±9.6 | 51.9±11.8 | 0.003 |
| Histologic grade | <0.001 | |||||
| I/II | 352 (73.9) | 220 (90.9) | 87 (64.9) | 29 (58.0) | 16 (32.0) | |
| III | 124 (26.1) | 22 (9.1) | 47 (35.1) | 21 (42.0) | 34 (68.0) | |
| Tumor stage | 0.577 | |||||
| T1 | 274 (57.6) | 145 (59.9) | 77 (57.5) | 27 (54.0) | 25 (50.0) | |
| T2/T3 | 202 (42.4) | 97 (40.1) | 57 (42.5) | 23 (46.0) | 25 (50.0) | |
| Nodal metastasis | 0.288 | |||||
| Absent | 283 (59.5) | 139 (57.4) | 78 (58.2) | 30 (60.0) | 36 (72.0) | |
| Present | 193 (40.5) | 103 (42.6) | 56 (41.8) | 20 (40.0) | 14 (28.0) | |
| Estrogen receptor status | <0.001 | |||||
| Negative | 110 (23.1) | 5 (2.1) | 5 (3.7) | 50 (100.0) | 50 (100.0) | |
| Positive | 366 (76.9) | 237 (97.9) | 129 (96.3) | 0 (0.0) | 0 (0.0) | |
| Progesterone receptor status | <0.001 | |||||
| Negative | 162 (34.0) | 34 (14.0) | 28 (20.9) | 50 (100.0) | 50 (100.0) | |
| Positive | 314 (66.0) | 208 (86.0) | 106 (79.1) | 0 (0.0) | 0 (0.0) | |
| HER2 status | <0.001 | |||||
| Negative | 349 (73.3) | 242 (100.0) | 57 (42.5) | 0 (0.0) | 50 (100.0) | |
| Positive | 127 (26.7) | 0 (0.0) | 77 (57.5) | 50 (100.0) | 0 (0.0) | |
| Ki-67 LI (%) | <0.001 | |||||
| ≤14 | 305 (64.1) | 242 (100.0) | 41 (30.6) | 16 (32.0) | 6 (12.0) | |
| >14 | 171 (35.9) | 0 (0.0) | 93 (69.4) | 34 (68.0) | 44 (88.0) | |
| Tumor recurrence | 22 (4.6) | 8 (3.3) | 5 (3.7) | 5 (10.0) | 4 (8.0) | 0.124 |
| No. of patient deaths | 26 (5.5) | 9 (3.7) | 5 (3.7) | 5 (10.0) | 7 (14.0) | 0.010 |
| Duration of clinical follow- | 58.5±15.3 | 60.1±14.1 | 58.8±15.7 | 52.9±20.0 | 55.5±13.1 | 0.074 |
| up (months, mean ± SD) | ||||||
| TNBC, triple negative breast cancer. | ||||||
* P-value was calculated by Fisher’s exact test.
Differential expression of lipid metabolism-related proteins in in vitro cell lines
Western blotting revealed differential expression of lipid metabolism-related proteins among different breast cancer cell lines. Specifically, HSL and ACOX-1 were highly expressed in MDA-MB-453 cells (HER2 subtype). The expression of FABP4 and CPT-1A in MCF-7 cells (luminal subtype) and MDA-MB-453 cells was higher than in MDA-MB-435S, MDA-MB-231, and MDA-MB-468 cells (TNBC subtypes) (Fig. 1).
Fig 1. Expression of lipolysis-related proteins in five subtypes of breast cancer cells.

MCF-7 (luminal-like), MDA-MB-453 (HER2), MDA-MB-435S (TNBC), MDA-MB-231 (TNBC), and MDA-MB-468 (TNBC) cells were lysed with RIPA buffer, and then cell lysates were subjected to SDS-PAGE and blotted with the indicated antibodies. Blots are representative of three independent experiments. TNBC, triple-negative breast cancer; HSL, hormone sensitive lipase; FABP4, fatty-acid binding protein 4; CPT-1A, carnitine palmitoyltransferase IA; ACOX1, Acyl-CoA oxidase 1; FASN, fatty acid synthase.
Differential expression of lipid metabolism-related proteins in different tumor subtypes
When comparing expressions of lipid metabolism—related proteins among molecular subtypes, the expression of PLIN1 (p < 0.001), FABP4 (p = 0.029), CPT-1A (p = 0.001), ACOX-1 (p < 0.001), and FASN (p < 0.001) differed significantly among the different tumor subtypes. Specifically, PLIN1, CPT-1A, and FASN expression were highest in HER2 tumors and lowest in TNBC tumors. Similarly, FABP4 and ACOX-1 expression were highest in HER2 tumors and lowest in luminal A tumors (Table 3 and Fig. 2).
Table 3. Expression of metabolism-related proteins according to breast cancer subtype.
| Parameter | Total | Luminal A | Luminal B | HER2 | TNBC | P-value* |
|---|---|---|---|---|---|---|
| (n = 476) (%) | (n = 242) (%) | (n = 134) (%) | (n = 50) (%) | (n = 50) (%) | ||
| HSL | 0.082 | |||||
| Negative | 406 (85.3) | 199 (82.2) | 115 (85.8) | 44 (88.0) | 48 (96.0) | |
| Positive | 70 (14.7) | 43 (17.8) | 19 (14.2) | 6 (12.0) | 2 (4.0) | |
| PLIN1 | <0.001 | |||||
| Negative | 422 (88.7) | 222 (91.7) | 120 (89.6) | 34 (68.0) | 46 (92.0) | |
| Positive | 54 (11.3) | 20 (8.3) | 14 (10.4) | 16 (32.0) | 4 (8.0) | |
| FABP4 | 0.029 | |||||
| Negative | 468 (98.3) | 240 (99.2) | 133 (99.3) | 47 (94.0) | 48 (96.0) | |
| Positive | 8 (1.7) | 2 (0.8) | 1 (0.7) | 3 (6.0) | 2 (4.0) | |
| CPT-1A | 0.001 | |||||
| Negative | 406 (85.3) | 217 (89.7) | 107 (79.9) | 36 (72.0) | 46 (92.0) | |
| Positive | 70 (14.7) | 25 (10.3) | 27 (20.1) | 14 (28.0) | 4 (8.0) | |
| Acyl-CoA oxidase 1 | <0.001 | |||||
| Negative | 418 (87.8) | 234 (96.7) | 121 (90.3) | 22 (44.0) | 41 (82.0) | |
| Positive | 58 (12.2) | 8 (3.3) | 13 (9.7) | 28 (56.0) | 9 (18.0) | |
| FASN | <0.001 | |||||
| Negative | 312 (65.5) | 160 (66.1) | 88 (65.7) | 22 (44.0) | 42 (84.0) | |
| Positive | 164 (34.5) | 82 (33.9) | 46 (34.3) | 28 (56.0) | 8 (16.0) |
TNBC, triple negative breast cancer.
* P-value was calculated by Fisher’s exact test.
Fig 2. Expression of lipid metabolism related proteins according to the molecular subtypes of breast cancer.

PLIN1, CPT-1A, and FASN expression are highest in HER2 tumors and lowest in TNBC tumors. Similarly, FABP4 and ACOX-1 expression are highest in HER2 tumors and lowest in luminal A tumors.
Correlation between expression of lipid metabolism-related proteins and clinicopathological characteristics
As shown in Table 4, HER2 positivity was significantly associated with CPT-1A positivity (p < 0.001) and ACOX-1 positivity (p < 0.001). ACOX-1 positivity also tended to be associated with a higher histologic grade (p = 0.006), ER negativity (p < 0.001), PR negativity (p < 0.001), and a higher Ki-67 LI (p < 0.001). FABP4 positivity was significantly correlated with ER negativity (p = 0.018).
Table 4. Correlations between the expression of lipid metabolism—related proteins and clinicopathologic parameters.
| Parameters | HSL | PLIN1 | FABP4 | ||||||
|---|---|---|---|---|---|---|---|---|---|
| Negative | Positive | P-value* | Negative | Positive | P-value* | Negative | Positive | P-value* | |
| n = 406 (%) | n = 70 (%) | n = 422 (%) | n = 54 (%) | n = 468 (%) | n = 8 (%) | ||||
| Age (Years, mean ±SD) | 50.6±10.3 | 49.4±10.5 | 2.232 | 50.3±10.2 | 52.1±11.1 | 1.380 | 50.5±10.3 | 46.2±11.7 | 1.458 |
| Histologic grade | 3.060 | 0.186 | 0.186 | ||||||
| I/II | 298 (73.4) | 54 (77.1) | 319 (75.6) | 33 (61.1) | 349 (74.6) | 3 (37.5) | |||
| III | 108 (26.6) | 16 (22.9) | 103 (24.4) | 21 (38.9) | 119 (25.4) | 5 (62.5) | |||
| Tumor stage | 2.874 | 0.906 | 1.482 | ||||||
| T1 | 231 (56.9) | 43 (61.4) | 238 (56.4) | 36 (66.7) | 271 (57.9) | 3 (37.5) | |||
| T2/T3 | 175 (43.1) | 27 (38.6) | 184 (43.6) | 18 (33.3) | 197 (42.1) | 5 (62.5) | |||
| Nodal metastasis | 4.296 | 3.462 | 5.160 | ||||||
| Absent | 240 (59.1) | 43 (61.4) | 249 (59.0) | 34 (63.0) | 278 (59.4) | 5 (62.5) | |||
| Present | 166 (40.9) | 27 (38.6) | 173 (41.0) | 20 (37.0) | 190 (40.6) | 3 (37.5) | |||
| Estrogen receptor status | 0.168 | 0.060 | 0.018 | ||||||
| Negative | 101 (24.9) | 9 (12.9) | 90 (21.3) | 20 (37.0) | 104 (22.2) | 6 (75.0) | |||
| Positive | 305 (75.1) | 61 (87.1) | 332 (78.7) | 34 (63.0) | 364 (77.8) | 2 (25.0) | |||
| Progesterone receptor status | 0.096 | 0.018 | 0.126 | ||||||
| Negative | 147 (36.2) | 15 (21.4) | 134 (31.8) | 28 (51.9) | 156 (33.3) | 6 (75.0) | |||
| Positive | 259 (63.8) | 55 (78.6) | 288 (68.2) | 26 (48.1) | 312 (66.7) | 2 (25.0) | |||
| HER2 status | 2.604 | 0.078 | 1.308 | ||||||
| Negative | 295 (72.7) | 54 (77.1) | 317 (75.1) | 32 (59.3) | 345 (73.7) | 4 (50.0) | |||
| Positive | 111 (27.3) | 16 (22.9) | 105 (24.9) | 22 (40.7) | 123 (26.3) | 4 (50.0) | |||
| Ki-67 LI (%) | 0.168 | 0.132 | 0.858 | ||||||
| ≤14 | 252 (62.1) | 53 (75.7) | 278 (65.9) | 27 (50.0) | 302 (64.5) | 3 (37.5) | |||
| >14 | 154 (37.9) | 17 (24.3) | 144 (34.1) | 27 (50.0) | 166 (35.5) | 5 (62.5) | |||
| Tumor recurrence | 21 (5.2) | 1 (1.4) | 1.356 | 20 (4.7) | 2 (3.7) | 6.000 | 21 (4.5) | 1 (12.5) | 1.902 |
| Patient death | 24 (5.9) | 2 (2.9) | 2.412 | 24 (5.7) | 2 (3.7) | 4.530 | 25 (5.3) | 1 (12.5) | 2.184 |
* P-values are corrected for multiple testing using the Bonferroni correction.
Association of the expression of lipid metabolism—related proteins with prognosis
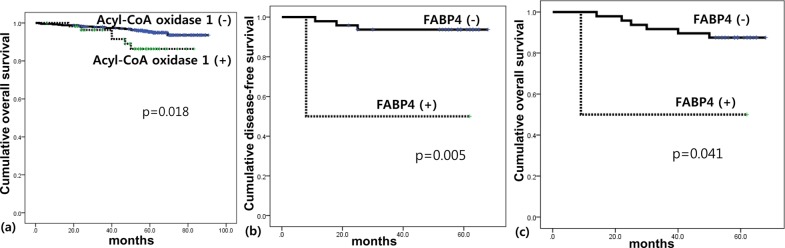
The only statistically significant relationship revealed by univariate analysis was an association between ACOX-1 positivity and shorter OS (p = 0.018; Table 5). However, when tumor subtype was considered, there were also significant associations between FABP4 positivity and shorter DFS (p = 0.005) and shorter OS (p = 0.041) in TNBC (Fig. 3).
Table 5. The impact of expression of lipid metabolism-related proteins on prognosis.
| Parameter | Number of patients/recurrence/death | Disease-free survival | Overall survival | ||
|---|---|---|---|---|---|
| Mean survival | P-value | Mean survival | P-value | ||
| (95% CI) months | (95% CI) months | ||||
| HSL | 0.176 | 0.315 | |||
| Negative | 406/21/24 | 87 (85–88) | 87 (85–88) | ||
| Positive | 70/1/2 | 84 (83–85) | 83 (81–85) | ||
| PLIN1 | 0.795 | 0.632 | |||
| Negative | 422/20/24 | 87 (86–89) | 87 (85–88) | ||
| Positive | 54/2/2 | 81 (78–84) | 81 (78–84) | ||
| FABP4 | 0.161 | 0.233 | |||
| Negative | 468/21/25 | 87 (86–89) | 87 (86–88) | ||
| Positive | 8/1/1 | 59 (43–74) | 59 (44–74) | ||
| CPT-1A | 0.608 | 0.069 | |||
| Negative | 406/18/19 | 87 (86–89) | 87 (86–89) | ||
| Positive | 70/4/7 | 85 (81–89) | 83 (79–87) | ||
| Acyl-CoA oxidase 1 | 0.184 | 0.018 | |||
| Negative | 418/18/20 | 87 (86–89) | 87 (86–89) | ||
| Positive | 58/4/6 | 78 (73–82) | 77 (72–81) | ||
| FASN | 0.111 | 0.106 | |||
| Negative | 312/18/21 | 86 (84–88) | 86 (84–88) | ||
| Positive | 164/4/5 | 87 (86–89) | 87 (85–88) | ||
Fig 3. Impact of the expression of lipid metabolism related proteins on patient prognosis in breast cancer (a) and triple negative breast cancer (b,c).
Multivariate Cox regression analysis revealed that higher T stage is an independent predictive factor for shorter DFS (hazard ratio: 3.801, 95% CI: 1.361–10.61, p = 0.011), but no other parameter had a statistically significant association with either DFS or OS (Table 6).
Table 6. Multivariate analysis of breast cancer survival.
| Included parameters | Disease-free survival | Overall survival | ||||
|---|---|---|---|---|---|---|
| Hazard ratio | 95% CI | P-value | Hazard ratio | 95% CI | P-value | |
| T stage | 0.011 | 0.107 | ||||
| T1 versus T2–3 | 3.801 | 1.361–10.61 | 2.021 | 0.859–4.752 | ||
| N stage | 0.183 | 0.911 | ||||
| N0 versus N1–3 | 1.848 | 0.748–4.565 | 0.953 | 0.413–2.202 | ||
| Age | 0.731 | 0.476 | ||||
| <50 versus ≥50 | 1.167 | 0.483–2.823 | 0.742 | 0.327–1.686 | ||
| Histologic grade | 0.463 | 0.946 | ||||
| I/II versus III | 1.467 | 0.527–4.083 | 1.035 | 0.383–2.797 | ||
| ER status | 0.272 | 0.304 | ||||
| Negative versus Positive | 1.974 | 0.587–6.641 | 1.857 | 0.571–6.043 | ||
| PR status | 0.234 | 0.146 | ||||
| Negative versus Positive | 1.989 | 0.641–6.170 | 2.240 | 0.756–6.641 | ||
| HER2 status | 0.979 | 0.459 | ||||
| Negative versus Positive | 1.014 | 0.360–2.858 | 0.688 | 0.256–1.849 | ||
| Ki-67 LI | 0.242 | 0.595 | ||||
| ≤14 versus >14 | 0.540 | 0.191–1.525 | 0.768 | 0.290–2.031 | ||
| HSL | 0.399 | 0.595 | ||||
| Negative versus Positive | 0.410 | 0.051–3.267 | 0.663 | 0.146–3.014 | ||
| PLIN1 | 0.930 | 0.672 | ||||
| Negative versus Positive | 1.072 | 0.227–5.071 | 0.716 | 0.152–3.367 | ||
| FABP4 | 0.319 | 0.276 | ||||
| Negative versus Positive | 2.970 | 0.349–25.29 | 3.270 | 0.387–27.61 | ||
| CPT1 | 0.846 | 0.072 | ||||
| Negative versus Positive | 1.125 | 0.343–3.686 | 2.406 | 0.924–6.262 | ||
| Acyl-CoA oxidase 1 | 0.647 | 0.161 | ||||
| Negative versus Positive | 1.342 | 0.381–4.730 | 2.180 | 0.733–6.481 | ||
| FASN | 0.164 | 0.076 | ||||
| Negative versus Positive | 0.438 | 0.137–1.402 | 0.371 | 0.124–1.109 | ||
The effect of the expression of lipid metabolism-related proteins on survival rates depending on ER, PR, and HER2 status of breast tumors is shown in Fig. 4. ACOX-1 positivity was associated with shorter OS in patients with ER positive tumors (p = 0.024) and HER2 positive tumors (p = 0.023). In addition, FASN negativity was associated with shorter DFS in patients with PR negative tumors (p = 0.046).
Fig 4. Impact of the expression of lipid metabolism related proteins on patient prognosis in ER positive group (a), PR negative group (b), HER2 positive group (c), and HER2 negative group (d, e).

Discussion
In this study, we observed differential expression of lipid metabolism-related proteins in 4 breast cancer subtypes. In particular, HER2 tumors showed the highest expression of PLIN1, CPT-1A, FASN, FABP4, and ACOX-1. This finding is consistent with two previous studies about HER2 and FASN. In one study, FASN expression was strongly correlated with HER2 status [23]. Another study showed that HER2 interacts with FASN and promotes FASN phosphorylation, which increases its activity and leads to cancer cell proliferation, and eventually, metastasis [24]. Our results suggest that lipid metabolism in breast tumors with the HER2 subtype is higher than that in other subtypes. Previous studies showed the difference of lipid metabolism genes according to breast cancer subtypes: products of de novo fatty acid synthesis, such as palmitate-containing phosphatidylcholine, were high in ER negative and grade 3 breast cancers [25], and acyl-CoA:cholesterol acyltransferase 1 (ACAT) activity was high in ER-negative basal-like breast cancer [26]. However, there was one report that the gene for secreted phospholipase A2 (sPLA2) is silenced in triple negative breast cancer cells [27]. Therefore, further study is required to evaluate the status of lipid metabolism genes according to breast cancer subtypes.
More generally, our results support the hypothesis that different breast cancer subtypes use different metabolic pathways, which has been previously suggested [2]. In this study, the expression of three lipid metabolism-related proteins (PLIN1, CPT-1A, and FASN) in TNBC cells was lower than that in other subtypes. Although a previous study demonstrated that the gene for secreted phospholipase A2 (sPLA2) is silenced in triple negative breast cancer cells [27], another report showed that sPLA2-induced lipid droplet formation plays an important role in TNBC cell proliferation and survival during starvation [12], indicating controversial results. Specifically, TNBC is often associated with a high histologic grade, accelerated mitosis, tumor necrosis, aggressive clinical behavior, and poor prognosis [28,29]. In addition, glycolysis-related proteins are highly expressed in TNBC and basal-like breast tumors, which imply high glycolytic activity [14,15], suggesting high metabolic activity in TNBC. Therefore, further study of lipid metabolism activity in TNBC is required.
The preference of different breast cancer subtypes for different metabolic pathways may have clinical implications. For example, ACOX-1 positivity was significantly correlated with shorter OS as well as clinicopathological characteristics, such as higher histologic grade (p = 0.006), ER negativity (p < 0.001), PR negativity (p < 0.001), and higher Ki-67 LI (p < 0.001), that are associated with poor prognosis in breast cancer patients. These results are in accordance with a previous study that showed that ACOX-1 expression increases with worsening histologic grade in brain glioma [30]. Similarly, FABP4 positivity was significantly associated with shorter DFS and OS in TNBC patients. These findings are supported by the observations that serum FABP levels are significantly higher in breast cancer patients than in healthy patients, and high serum levels of FABP are associated with adverse tumor characteristics, such as large tumor size and lymph node metastasis [31]. Similar correlations have also been found in bladder cancer [32] and prostate cancer [33].
These differences suggest that selective inhibition of lipid metabolism-related proteins may be a potential chemotherapeutic strategy for some breast cancer subtypes. This hypothesis is supported by the observation that inhibitors of glycolysis-related molecules, such as hypoxia-inducible factor 1α [34,35], glucose transporter 1 [36,37], carbonic anhydrase IX [38], and monocarboxylate transporter 4 [39], suppress tumor progression in several types of cancer, including breast cancer. In addition, several FASN inhibitors have been shown to decrease tumor cell growth or increase tumor cell death [24,40,41]. However, further studies are needed to determine the value of lipid metabolism-related proteins as therapeutic targets.
In conclusion, our results showed that lipid metabolism-related proteins are differentially expressed in different breast cancer subtypes, which may aid the development of novel chemotherapeutic agents.
Data Availability
All relevant data are within the paper.
Funding Statement
This study was supported by a grant from the National R&D Program for Cancer Control, Ministry of Health & Welfare, Republic of Korea (1420080). The funders had no role in study design, data collection and analysis, decision to publish, or preparation of the manuscript.
References
- 1. Warburg O (1956) On the origin of cancer cells. Science 123: 309–314. [DOI] [PubMed] [Google Scholar]
- 2. Moreno-Sanchez R, Rodriguez-Enriquez S, Marin-Hernandez A, Saavedra E (2007) Energy metabolism in tumor cells. FEBS J 274: 1393–1418. [DOI] [PubMed] [Google Scholar]
- 3. Menendez JA, Lupu R (2007) Fatty acid synthase and the lipogenic phenotype in cancer pathogenesis. Nat Rev Cancer 7: 763–777. [DOI] [PubMed] [Google Scholar]
- 4. Kraemer FB, Shen WJ (2002) Hormone-sensitive lipase: control of intracellular tri-(di-)acylglycerol and cholesteryl ester hydrolysis. J Lipid Res 43: 1585–1594. [DOI] [PubMed] [Google Scholar]
- 5. Carracedo A, Cantley LC, Pandolfi PP (2013) Cancer metabolism: fatty acid oxidation in the limelight. Nat Rev Cancer 13: 227–232. 10.1038/nrc3483 [DOI] [PMC free article] [PubMed] [Google Scholar]
- 6. Nomura DK, Long JZ, Niessen S, Hoover HS, Ng SW, et al. (2010) Monoacylglycerol lipase regulates a fatty acid network that promotes cancer pathogenesis. Cell 140: 49–61. 10.1016/j.cell.2009.11.027 [DOI] [PMC free article] [PubMed] [Google Scholar]
- 7. Jones C, Nonni AV, Fulford L, Merrett S, Chaggar R, et al. (2001) CGH analysis of ductal carcinoma of the breast with basaloid/myoepithelial cell differentiation. Br J Cancer 85: 422–427. [DOI] [PMC free article] [PubMed] [Google Scholar]
- 8.Brglez V, Lambeau G, Petan T (2014) Secreted phospholipases A in cancer: Diverse mechanisms of action. Biochimie. [DOI] [PubMed]
- 9. Nieman KM, Kenny HA, Penicka CV, Ladanyi A, Buell-Gutbrod R, et al. (2011) Adipocytes promote ovarian cancer metastasis and provide energy for rapid tumor growth. Nat Med 17: 1498–1503. 10.1038/nm.2492 [DOI] [PMC free article] [PubMed] [Google Scholar]
- 10. Greenberg AS, Egan JJ, Wek SA, Garty NB, Blanchette-Mackie EJ, et al. (1991) Perilipin, a major hormonally regulated adipocyte-specific phosphoprotein associated with the periphery of lipid storage droplets. J Biol Chem 266: 11341–11346. [PubMed] [Google Scholar]
- 11. Currie E, Schulze A, Zechner R, Walther TC, Farese RV Jr (2013) Cellular fatty acid metabolism and cancer. Cell Metab 18: 153–161. 10.1016/j.cmet.2013.05.017 [DOI] [PMC free article] [PubMed] [Google Scholar]
- 12. Pucer A, Brglez V, Payre C, Pungercar J, Lambeau G, et al. (2013) Group X secreted phospholipase A(2) induces lipid droplet formation and prolongs breast cancer cell survival. Mol Cancer 12: 111 10.1186/1476-4598-12-111 [DOI] [PMC free article] [PubMed] [Google Scholar]
- 13. Sorlie T, Perou CM, Tibshirani R, Aas T, Geisler S, et al. (2001) Gene expression patterns of breast carcinomas distinguish tumor subclasses with clinical implications. Proc Natl Acad Sci U S A 98: 10869–10874. [DOI] [PMC free article] [PubMed] [Google Scholar]
- 14. Pinheiro C, Sousa B, Albergaria A, Paredes J, Dufloth R, et al. (2011) GLUT1 and CAIX expression profiles in breast cancer correlate with adverse prognostic factors and MCT1 overexpression. Histol Histopathol 26: 1279–1286. [DOI] [PubMed] [Google Scholar]
- 15. Choi J, Jung WH, Koo JS (2013) Metabolism-related proteins are differentially expressed according to the molecular subtype of invasive breast cancer defined by surrogate immunohistochemistry. Pathobiology 80: 41–52. 10.1159/000339513 [DOI] [PubMed] [Google Scholar]
- 16. Kim S, Kim do H, Jung WH, Koo JS (2013) Expression of glutamine metabolism-related proteins according to molecular subtype of breast cancer. Endocr Relat Cancer 20: 339–348. 10.1530/ERC-12-0398 [DOI] [PubMed] [Google Scholar]
- 17. Kim SK, Jung WH, Koo JS (2014) Differential expression of enzymes associated with serine/glycine metabolism in different breast cancer subtypes. PLoS One 9: e101004 10.1371/journal.pone.0101004 [DOI] [PMC free article] [PubMed] [Google Scholar]
- 18. Elston CW, Ellis IO (1991) Pathological prognostic factors in breast cancer. I. The value of histological grade in breast cancer: experience from a large study with long-term follow-up. Histopathology 19: 403–410. [DOI] [PubMed] [Google Scholar]
- 19. Won KY, Kim GY, Kim YW, Song JY, Lim SJ (2010) Clinicopathologic correlation of beclin-1 and bcl-2 expression in human breast cancer. Hum Pathol 41: 107–112. 10.1016/j.humpath.2009.07.006 [DOI] [PubMed] [Google Scholar]
- 20. Hammond ME, Hayes DF, Dowsett M, Allred DC, Hagerty KL, et al. (2010) American Society of Clinical Oncology/College Of American Pathologists guideline recommendations for immunohistochemical testing of estrogen and progesterone receptors in breast cancer. J Clin Oncol 28: 2784–2795. 10.1200/JCO.2009.25.6529 [DOI] [PMC free article] [PubMed] [Google Scholar]
- 21. Wolff AC, Hammond ME, Schwartz JN, Hagerty KL, Allred DC, et al. (2007) American Society of Clinical Oncology/College of American Pathologists guideline recommendations for human epidermal growth factor receptor 2 testing in breast cancer. J Clin Oncol 25: 118–145. [DOI] [PubMed] [Google Scholar]
- 22. Goldhirsch A, Wood WC, Coates AS, Gelber RD, Thurlimann B, et al. (2011) Strategies for subtypes—dealing with the diversity of breast cancer: highlights of the St. Gallen International Expert Consensus on the Primary Therapy of Early Breast Cancer 2011. Ann Oncol 22: 1736–1747. 10.1093/annonc/mdr304 [DOI] [PMC free article] [PubMed] [Google Scholar]
- 23. Yang M, Xu SP, Ao QL (2013) [Expression of fatty acid synthase and its association with HER2 in invasive ductal carcinoma of breast]. Zhonghua Bing Li Xue Za Zhi 42: 257–261. 10.3760/cma.j.issn.0529-5807.2013.04.010 [DOI] [PubMed] [Google Scholar]
- 24. Jin Q, Yuan LX, Boulbes D, Baek JM, Wang YN, et al. (2010) Fatty acid synthase phosphorylation: a novel therapeutic target in HER2-overexpressing breast cancer cells. Breast Cancer Res 12: R96 10.1186/bcr2777 [DOI] [PMC free article] [PubMed] [Google Scholar]
- 25. Hilvo M, Denkert C, Lehtinen L, Muller B, Brockmoller S, et al. (2011) Novel theranostic opportunities offered by characterization of altered membrane lipid metabolism in breast cancer progression. Cancer Res 71: 3236–3245. 10.1158/0008-5472.CAN-10-3894 [DOI] [PubMed] [Google Scholar]
- 26. Antalis CJ, Arnold T, Rasool T, Lee B, Buhman KK, et al. (2010) High ACAT1 expression in estrogen receptor negative basal-like breast cancer cells is associated with LDL-induced proliferation. Breast Cancer Res Treat 122: 661–670. 10.1007/s10549-009-0594-8 [DOI] [PubMed] [Google Scholar]
- 27. Brglez V, Pucer A, Pungercar J, Lambeau G, Petan T (2014) Secreted phospholipases A2 are differentially expressed and epigenetically silenced in human breast cancer cells. Biochem Biophys Res Commun 445: 230–235. 10.1016/j.bbrc.2014.01.182 [DOI] [PubMed] [Google Scholar]
- 28. Carey LA, Dees EC, Sawyer L, Gatti L, Moore DT, et al. (2007) The triple negative paradox: primary tumor chemosensitivity of breast cancer subtypes. Clin Cancer Res 13: 2329–2334. [DOI] [PubMed] [Google Scholar]
- 29. Reis-Filho JS, Tutt AN (2008) Triple negative tumours: a critical review. Histopathology 52: 108–118. 10.1111/j.1365-2559.2007.02889.x [DOI] [PubMed] [Google Scholar]
- 30. Bieche I, Parfait B, Tozlu S, Lidereau R, Vidaud M (2001) Quantitation of androgen receptor gene expression in sporadic breast tumors by real-time RT-PCR: evidence that MYC is an AR-regulated gene. Carcinogenesis 22: 1521–1526. [DOI] [PubMed] [Google Scholar]
- 31. Hancke K, Grubeck D, Hauser N, Kreienberg R, Weiss JM (2010) Adipocyte fatty acid-binding protein as a novel prognostic factor in obese breast cancer patients. Breast Cancer Res Treat 119: 367–367. 10.1007/s10549-009-0577-9 [DOI] [PubMed] [Google Scholar]
- 32. Isola JJ (1993) Immunohistochemical demonstration of androgen receptor in breast cancer and its relationship to other prognostic factors. J Pathol 170: 31–35. [DOI] [PubMed] [Google Scholar]
- 33. Uehara H, Takahashi T, Oha M, Ogawa H, Izumi K (2014) Exogenous fatty acid binding protein 4 promotes human prostate cancer cell progression. Int J Cancer. [DOI] [PubMed] [Google Scholar]
- 34. Chang H, Shyu KG, Lee CC, Tsai SC, Wang BW, et al. (2003) GL331 inhibits HIF-1alpha expression in a lung cancer model. Biochem Biophys Res Commun 302: 95–100. [DOI] [PubMed] [Google Scholar]
- 35. Yeo EJ, Chun YS, Cho YS, Kim J, Lee JC, et al. (2003) YC-1: a potential anticancer drug targeting hypoxia-inducible factor 1. J Natl Cancer Inst 95: 516–525. [DOI] [PubMed] [Google Scholar]
- 36. Mohanti BK, Rath GK, Anantha N, Kannan V, Das BS, et al. (1996) Improving cancer radiotherapy with 2-deoxy-D-glucose: phase I/II clinical trials on human cerebral gliomas. Int J Radiat Oncol Biol Phys 35: 103–111. [DOI] [PubMed] [Google Scholar]
- 37. Aft RL, Zhang FW, Gius D (2002) Evaluation of 2-deoxy-D-glucose as a chemotherapeutic agent: mechanism of cell death. Br J Cancer 87: 805–812. [DOI] [PMC free article] [PubMed] [Google Scholar]
- 38. Vullo D, Franchi M, Gallori E, Pastorek J, Scozzafava A, et al. (2003) Carbonic anhydrase inhibitors: inhibition of the tumor-associated isozyme IX with aromatic and heterocyclic sulfonamides. Bioorg Med Chem Lett 13: 1005–1009. [DOI] [PubMed] [Google Scholar]
- 39. Gallagher SM, Castorino JJ, Wang D, Philp NJ (2007) Monocarboxylate transporter 4 regulates maturation and trafficking of CD147 to the plasma membrane in the metastatic breast cancer cell line MDA-MB-231. Cancer Res 67: 4182–4189. [DOI] [PubMed] [Google Scholar]
- 40. Lee JS, Sul JY, Park JB, Lee MS, Cha EY, et al. (2013) Fatty acid synthase inhibition by amentoflavone suppresses HER2/neu (erbB2) oncogene in SKBR3 human breast cancer cells. Phytother Res 27: 713–720. 10.1002/ptr.4778 [DOI] [PubMed] [Google Scholar]
- 41. Puig T, Aguilar H, Cufi S, Oliveras G, Turrado C, et al. (2011) A novel inhibitor of fatty acid synthase shows activity against HER2+ breast cancer xenografts and is active in anti-HER2 drug-resistant cell lines. Breast Cancer Res 13: R131 10.1186/bcr3077 [DOI] [PMC free article] [PubMed] [Google Scholar]
Associated Data
This section collects any data citations, data availability statements, or supplementary materials included in this article.
Data Availability Statement
All relevant data are within the paper.