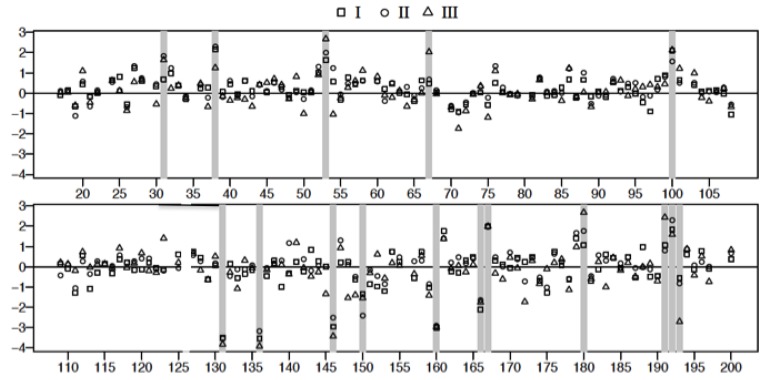
Figure 8.
Plot of the logarithm of geometric mean fold change relative to control, (() see text for details) for 2D gel spots associated with proteins above the nominal molecular weight of 50 kDa derived from the analysis of Classes I, II, and III plasma. Spot reference numbers are on the horizontal axis, and there is one value for each of the three classes. The spots marked with a grey bar represent spots associated with statistically significant changes (FDR) relative to control.

