

Abstract
Hemodiafiltration (HDF) with 20–22 L of substitution fluid is increasingly recognized as associated with significant benefits regarding patient outcome. However, some doubt exists as to whether these high volumes can be achieved in routine clinical practice. A total of 4176 sessions with 366 patients on postdilution HDF were analyzed in this 1-month observational cohort study with prospective data collection. All dialysis machines were equipped with AutoSub plus signal analysis software that automatically and continuously adapts the substitution fluid flow according to the blood flow, blood viscosity, and dialyzer characteristics. Percentages of sessions with different types of vascular access were compared regarding achievement of ≥21 L substitution fluid. Logistic regression analysis was conducted to study the independent relationship of selected variables with achievement of ≥21 L substitution volume. Patient- and dialysis-related variables that showed an association with the convection volume were entered in a multivariable model that included hematocrit up front. Respectively, 87%, 84%, and 33% of routine sessions conducted with fistulas, grafts, and catheters qualified as high-volume HDF. Serum albumin levels ≥4.2 g/dL were positively associated with the achievement of at least 21 L substitution volume. Positive associations were also observed for blood flows in the ranges 350–399 and ≥400 mL/min compared with the reference range (300–350 mL/min), for longer treatment time, for fistula versus catheter, for higher filtration fraction, and for dialysis conducted at the end of the week versus Monday. It can be concluded that implementation and sustainability of high-volume HDF is possible in routine clinical practice for almost all patients treated with fistulas and grafts.
Keywords: Hemodiafiltration, High-volume, Substitution fluid, Dialysis
Efficient removal of middle-molecular-weight uremic toxins is expected to improve patient outcomes in dialysis. Convective transport is the main driver for an enhanced clearance of such toxins 1. Consequently, hemodiafiltration (HDF), a dialysis procedure effectively combining diffusive and convective transport, has now become the standard dialysis technique in many countries. In order to clearly differentiate between hemodiafiltration and high-flux hemodialysis (HD), which also combines diffusive and convective transport to a certain extent, the European Dialysis Working Group (EUDIAL) 2 defined hemodiafiltration as a blood purification therapy combining diffusive and convective solute transport such that the latter is achieved by an effective convection volume of at least 20% of the total blood volume processed. Convection volume is the sum of the substitution fluid volume and the volume of fluid removed during a session (i.e., the difference between the postdialysis and predialysis weights). For a patient with a blood flow set at 300–400 mL/min for a standard 4-h session, the EUDIAL definition of hemodiafiltration translates into a minimum convection volume of 14.4–19.2 L/session.
The survival advantage associated with substitution fluid volumes in the range of 15–24.9 L reported by Canaud et al. in 2006 3 lends weight to the EUDIAL HDF definition. A number of studies confirmed the significance of this 15–24.9 L substitution volume range regarding patient survival, even if each individually indicated slightly different threshold volumes of substitution fluid above which a survival advantage was reported. In the randomized clinical trial of Ok et al. 4, the median of the time-average substitution volume administered was 17.4 L, with high-efficiency HDF being defined as HDF with substitution volumes above this value. In a post hoc analysis, substitution volumes above this 17.4 L were associated with better overall and cardiovascular survival. In the Contrast study 5, also a randomized clinical trial, the hazard ratio for all-cause mortality was found to be considerably lower in patients treated with convection volumes over 21.95 L (approximately equivalent to a 20-L substitution volume). An epidemiological study based on experience in the Balkan countries 6 reported that the median substitution volume administered in routine HDF in these countries was 20.4 L and that this constituted a threshold above which survival was improved. Finally, in the recent ESHOL randomized clinical trial 7, the median quarterly administered substitution volume ranged from 20.8 to 21.8 L (convection volume: 22.9 to 23.9 L) and was associated with a significant survival advantage over high-flux dialysis.
In summary, study after study, the initial estimated threshold for enhancing survival for substitution fluid per session of the DOPPS study (i.e., 15–24.9 L) has been refined to a quantity of about 20 to 22 L. The feasibility of achieving high substitution fluid volumes was addressed in a previous study, published in 2009 8. In that study, only 18% of the patients reached the predefined target of convection volume ≥6 L/h (i.e., 24-L convection volume or about 22-L substitution fluid volume). In the meantime, evidence for the benefits of HDF over HD has accumulated, and advances have been made in dialysis care and technology to the extent that this question should be readdressed. The aim of this study is to evaluate the feasibility of high-volume HDF with ≥21-L substitution fluid volume in the current dialysis population and to check the relevance of some key patient- and treatment-related determinants of high-volume postdilution hemodiafiltration.
Patients and Methods
As shown in Fig. 1, the data source comprised 398 patients treated in two Portuguese clinics between June 4 and July 2, 2013. Eighteen patients were excluded from the evaluation because they were on hemodialysis, one because of treatment with mixed pre–post hemodiafiltration, five because they did not undergo dialysis three times a week (four had dialysis four times a week, one twice a week), and eight because they were transient patients. In summary, a total of 366 patients on thrice-weekly postdilution online HDF were selected for the study, corresponding to a total of 4176 sessions.
Figure 1.
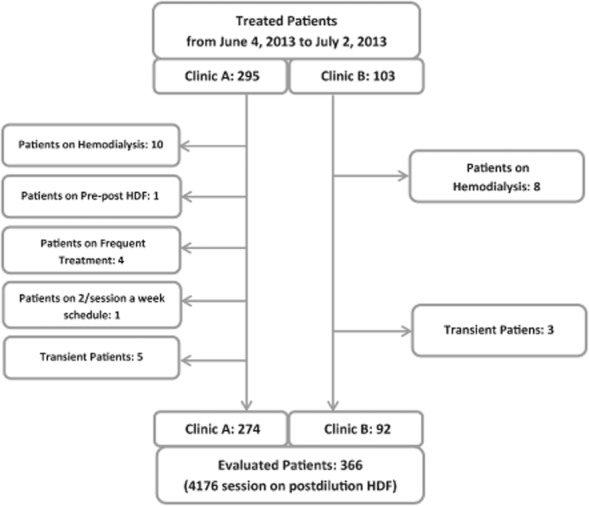
Flowchart representing the studied population.
Postdilution HDF was performed using the 5008 CorDiax HDF machine (Fresenius Medical Care, Bad Homburg, Germany) with the AutoSub plus function. Adequate dialysis dose was controlled monthly by Kt/V measurements made with an integrated online clearance tool (OCM, Fresenius Medical Care), based on ionic dialysance and taking V from whole-body bioimpedance measurements (Body Composition Monitor, Fresenius Medical Care) 9,10. Due to considerations concerning the local availability of assays to measure anti-factor Xa activity and its capability to antagonize the effect of low-molecular-weight heparin, unfractionated heparin was employed for anticoagulation. High-flux FX CorDiax 600 dialyzers (Fresenius Medical Care) were almost exclusively used for HDF treatments, and for most of the treatments the dialysis fluid/substitution fluid compositions were standardly: sodium 138 mEq/L, potassium 2 mEq/L, calcium 1.5 mmol/L, and bicarbonate 32 mEq/L. A central distribution system with two lines (e.g., for 1.25 or 1.5 mmol calcium) was used in both clinics. Albumin levels were measured with the bromocresol green assay. Treatment times were fixed at 240 min, to be effectively achieved. Sterile and nonpyrogenic substitution fluids were produced by ultrafiltration of the ultrapure dialysate. Ultrapure quality was defined as bacterial counts <0.1 CFU/mL and endotoxin levels <0.025 EU/mL.
All data considered in the study were automatically collected through the EuCliD database, already extensively described in previous publications 11,12. As prescribing physicians and nurses were not aware of any study intention, the data collected represent clinical reality as opposed to data collected in a controlled clinical trial. Treatment-related variables such as effective treatment time, total treated blood volume, substitution volume, pre- and postdialysis body weight, etc. were gained directly from the dialysis machine and the associated scale by the Therapy Data Management System (Fresenius Medical Care). The convection volume was calculated as the sum of the substitution volume per treatment and the ultrafiltration volume for weight loss. Mean convection flow rate was defined as the convection volume divided by the effective treatment time. Mean filtration fraction was defined as the mean convection flow rate divided by the mean blood flow rate. Strictly defined, the filtration fraction is the ratio of the ultrafiltration rate to the plasma water flow rate. However, the first definition above is usually used and is adopted in this work, although not totally appropriate, as it reflects clinical practicality and was considered acceptable by EUDIAL 2. High-volume HDF was defined by a total substitution volume ≥21 L per treatment.
Standard online HDF equipment available on the market up to the end of 2012 managed ultrafiltration by focusing on control of either ultrafiltration flow, prescribed by nephrologists, or transmembrane pressure, automatically decreasing ultrafiltration rates when the transmembrane pressure increased above a predefined threshold. Recently, a new approach has been implemented in more advanced online HDF equipment such as the 5008 CorDiax machines. The basic principle of this approach is to avoid excessive hemoconcentration within the dialyzer by continuously adapting the substitution flow according to changes in blood viscosity within the dialyzer, these changes being identified using signal analysis of the pressure pulses transmitted from the peristaltic blood pump (AutoSub plus, Fresenius Medical Care). Signal analysis is conducted several times per minute, and the substitution rate is automatically adapted based on pressure pulse attenuation and cross-membrane pressure assessment. The result of this loop-back control application is an automatic individualization and maximization of the substitution volume with respect to blood flow, whole-blood viscosity, and dialyzer characteristics.
This approach was introduced as routine practice into the two Portuguese clinics constituting the basis for this study. Data were reported as proportions or as means with standard deviation or standard error, where appropriate. Logistic regression analysis was used to study the independent relationship of each variable with substitution volume, whereby a 21-L substitution volume was considered the threshold for the outcome. Patient- and dialysis-related variables that showed an association with the convection volume were entered in a multivariable model. In addition, hematocrit (laboratory measurement) was entered into this multivariable model up front. Results were considered statistically significant for P < 0.05. SPSS software was used for all analyses (version 21; IBM, Armonk, NY, USA).
Results
Patient and treatment characteristics are summarized in Table 1: mean patient age was 65.8 ± 14.4 years; 58.2% were male; and average dialysis vintage was 6.5 years. Mean hematocrit was 33.8 ± 3.9%, and mean serum albumin was 4.04 ± 0.42 g/dL. The majority of patients had a fistula as vascular access (64%). Seventy-five percent of needles were 15G and 25% were 14G; no 16G needles were used. Mean blood flow was 401 ± 54 mL/min. Figure 2 shows the distributions of blood flow by vascular access type; as expected, blood flow tended to be lower with catheters compared with fistulas and grafts. The mean convection volume was 25.95 ± 3.33 L per treatment (median 26.4 L, IQR 24.1–28.0 L), and the mean filtration fraction was 26.9 ± 3.0% (median 26.5%, IQR 25.0–28.3%). In total, 79% of the sessions qualified as high-volume HDF, defined by substitution fluid volumes ≥21 L; this percentage was even higher when only fistulas or grafts were considered (86.9% and 83.8%, respectively) ( Fig. 3).
Table 1.
Patient and treatment characteristics of 366 chronic HDF patients
| Mean ± SD or % | ||
|---|---|---|
| Male (%) | 58.2 | |
| Age (years) | 65.8 ± 14.4 | |
| Dry body weight (kg) | 67.8 ± 14.8 | |
| Primary renal disease | Glomerulonephritis | 8.9 |
| Diabetic nephropathy | 14.7 | |
| Cystic kidney disease | 3.6 | |
| Chronic pyelonephritis | 6.6 | |
| Vascular disease/hypertension | 34.3 | |
| Unknown/other | 31.8 | |
| Comorbidities | Diabetes mellitus | 22.7 |
| Coronary artery disease | 4.2 | |
| Congestive heart failure | 13.9 | |
| Peripheral vascular disease | 13.6 | |
| Cerebrovascular disease | 13.9 | |
| Chronic pulmonary disease | 8.3 | |
| Tumor | 5.8 | |
| Time on renal replacement therapy (years) | 6.5 ± 6.1 | |
| Vascular access | Arteriovenous fistula | 63.7 |
| Graft | 21.9 | |
| Central venous catheter | 14.4 | |
| Hemoglobin (g/L) | 11.2 ± 1.3 | |
| Hematocrit (%) | 33.8 ± 3.9 | |
| Serum albumin (g/dL) | 4.04 ± 0.42 | |
| Effective treatment time delivered (min) | 243.4 ± 14.2 | |
| Mean blood flow rate delivered (mL/min) | 401.2 ± 53.7 | |
| Intradialytic weight loss (L/treatment) | 2.43 ± 0.70 | |
| Kt/V | 1.90 ± 0.41 | |
| Substitution volume (L/treatment) | 23.53 ± 3.37 | |
| Convection volume (L/treatment) | 25.95 ± 3.33 | |
| Convection flow rate (mL/min) | 106.6 ± 11.6 | |
| Filtration fraction (%) | 26.9 ± 3.0 | |
Figure 2.
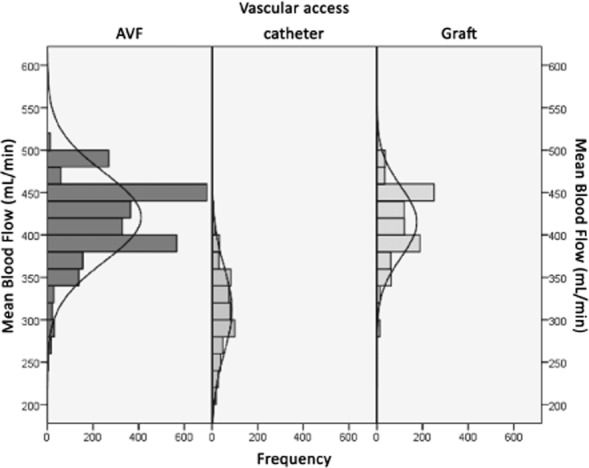
Distribution of blood flow rate by type of vascular access.
Figure 3.
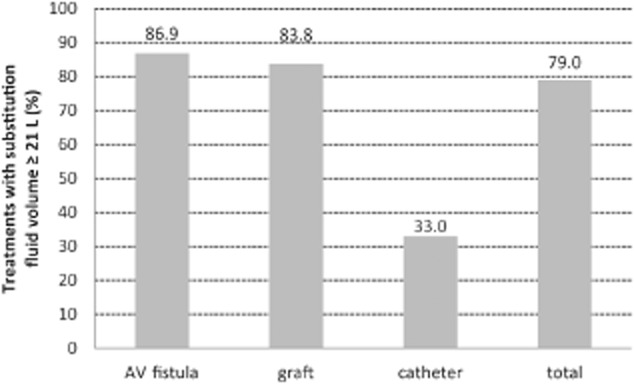
Proportion of treatments with substitution fluid volume ≥21 L by type of vascular access (catheter vs. arteriovenous [AV] fistula or graft: P < 0.001).
In Figs. 4 and 5, the relationships between substitution fluid volume and, respectively, serum albumin and hematocrit are depicted.
Figure 4.
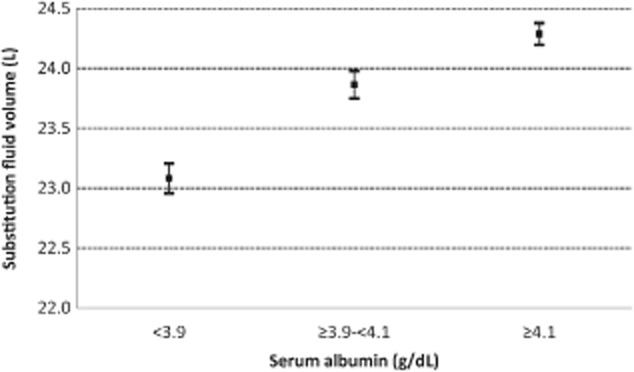
Relationship between serum albumin and substitution fluid volume. Bars represent standard errors (P < 0.01).
Figure 5.
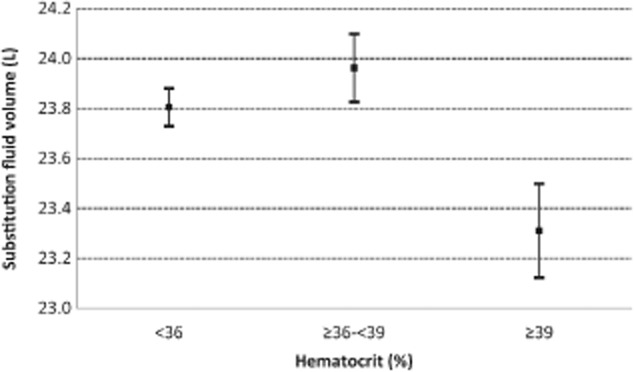
Relationship between hematocrit and substitution fluid volume. Bars represent standard errors. Third tertile (hematocrit ≥39%) versus second tertile: P < 0.01; third tertile versus first tertile: P < 0.01.
In the logistic regression analysis (Table 2), a serum albumin level ≥4.2 g/dL was positively related to the achievement of the target substitution volume. Male gender and hematocrit were not significant in the multivariable model. A blood flow below 300 mL/min was negatively associated with an odds ratio (OR) of 0.003 compared with the reference range of 300–350 mL/min (OR = 0.003, 95% CI 0.001–0.007, P < 0.001). Conversely, blood flows in the ranges 350–399 mL/min and ≥400 mL/min were positively associated with a large OR (OR = 56, 95% CI 32–99, P < 0.001; OR = 2142, 95% CI 986–4654, P < 0.001, respectively). Also, treatment time (OR = 1.16/min, 95% CI 1.07–1.14, P < 0.001) was positively related to the targeted substitution volume in the logistic regression model. The presence of a catheter as vascular access was associated with significantly lower OR (82% lower) for achieving the target substitution volume compared with sessions conducted with an arteriovenous fistula (OR = 0.184, 95% CI 0.111–0.304, P < 0.001), whereas the presence of a vascular graft was not significant in the logistic regression model. Filtration fraction was positively associated with the achievement of the target substitution volume (OR = 2.91 per percentage point, 95% CI 2.632–3.217, P < 0.001), and finally, dialysis sessions conducted at the end of the week were more likely to achieve the substitution volume target (e.g., for Saturdays compared with Mondays: OR = 2.75, 95% CI 1.139–4.540, P < 0.001).
Table 2.
Results of the logistic model having treatment with at least 21 L of postdilution substitution as outcome
| Odds ratio | P value | ||||
|---|---|---|---|---|---|
| Mean | 95% confidence interval | ||||
| Lower limit | Upper limit | ||||
| Age (per year) | 1.021 | 1.009 | 1.033 | <0.001 | |
| Gender (ref. female) | 0.846 | 0.613 | 1.169 | NS | |
| Primary renal disease (ref. glomerulonephritis) | Diabetic nephropathy | 0.564 | 0.263 | 1.214 | NS |
| Cystic kidney disease | 0.416 | 0.187 | 0.924 | 0.031 | |
| Chronic pyelonephritis | 0.744 | 0.353 | 1.567 | NS | |
| Vascular disease/hypertension | 1.228 | 0.705 | 2.139 | NS | |
| Miscellaneous | 0.397 | 0.182 | 0.866 | 0.020 | |
| Unknown | 0.827 | 0.455 | 1.501 | NS | |
| Comorbidities (ref. absent) | Diabetes mellitus | 0.691 | 0.405 | 1.178 | NS |
| Coronary artery disease | 0.949 | 0.462 | 1.952 | NS | |
| Congestive heart failure | 0.958 | 0.636 | 1.442 | NS | |
| Peripheral vascular disease | 1.470 | 0.952 | 2.271 | 0.082 | |
| Cerebrovascular disease | 0.970 | 0.620 | 1.520 | NS | |
| Chronic pulmonary disease | 0.895 | 0.523 | 1.530 | NS | |
| Tumor | 1.226 | 0.614 | 2.450 | NS | |
| Vascular access (ref. arteriovenous fistula) | Graft | 0.703 | 0.489 | 1.009 | NS |
| Central venous catheter | 0.184 | 0.111 | 0.304 | <0.001 | |
| Hematocrit (per %) | 1.012 | 0.977 | 1.049 | NS | |
| Serum albumin (ref. <3.9 g/dL) | 3.9–4.1 g/dL | 1.339 | 0.901 | 1.992 | NS |
| ≥4.2 g/dL | 1.581 | 1.066 | 2.344 | 0.023 | |
| Treatment time (per min) | 1.161 | 1.139 | 1.183 | <0.001 | |
| Mean blood flow (ref. 300–349 mL/min) | <300 mL/min | 0.003 | 0.001 | 0.007 | <0.001 |
| 350–399 mL/min | 56.130 | 31.662 | 99.504 | <0.001 | |
| ≥400 mL/min | 2142.128 | 985.954 | 4654.085 | <0.001 | |
| Day of the week (ref. Monday) | Tuesday | 1.807 | 1.147 | 2.848 | 0.011 |
| Wednesday | 1.505 | 0.933 | 2.427 | 0.093 | |
| Thursday | 2.311 | 1.409 | 3.790 | 0.001 | |
| Friday | 2.069 | 1.265 | 3.385 | 0.004 | |
| Saturday | 2.750 | 1.139 | 4.549 | <0.001 | |
| Filtration fraction (per %) | 2.910 | 2.632 | 3.217 | <0.001 | |
NS, not significant.
Discussion
This study showed that 79% of the sessions conducted in two clinics where 96% of the patients were routinely on HDF were conducted with a substitution fluid volume of at least 21 L. The type of vascular access influenced the achievement of high-volume substitution: 87%, 84%, and 33% of routine sessions conducted with fistulas, grafts, and catheters, respectively, qualified as high-volume HDF. Also, a positive association was observed for fistula versus catheter regarding the achievement of a high substitution fluid volume. The poorer results obtained with catheters are likely to be associated with the overall lower blood flow possible with this type of access. A blood flow below 300 mL/min was negatively associated with an OR of 0.003 in respect to the reference 300–350 mL/min (95% CI 0.001–0.007, P < 0.001). Positive associations were observed for blood flows in the ranges 350–399 and ≥400 mL/min compared with the reference 300–350 mL/min.
Positive associations were also observed for longer treatment time, for dialysis conducted at the end of the week versus Monday, and for higher filtration fraction. The result for the end-of-week sessions is probably linked to the lower requirement in terms of net ultrafiltration. Surprisingly, the OR for Tuesdays was significantly higher than for Mondays (OR 1.8, 95% CI 1.147–2.848, P = 0.011), despite the fact that before adjustment, the proportion of sessions achieving ≥21-L substitution fluid volume and the ultrafiltration volume normalized to weight were both comparable on Monday and Tuesday (76.9% and 75.3%, respectively, for sessions achieving target; 4.09% and 4.01%, respectively, for ultrafiltration/weight ratio). Only the percentage of diabetics treated was different, being higher on Tuesday (28.8% vs. 17.8%), but we cannot offer an explanation for the better performance on Tuesday after adjustment. Clearly a more specific study is required to elucidate this observation.
The current scientific discussion tends to focus on convection volume as opposed to substitution volume, possibly normalized to a body-size-related factor 2. While detoxification is related to convection volume, an increase in net ultrafiltration due to higher interdialytic weight gain is well recognized as negatively affecting survival 13. It should therefore be stressed that a high ultrafiltration due to a 6-kg increase in interdialytic weight cannot be considered in the same way as an additional 6 L of substitution fluid. Filtration fraction is a key variable regarding the convection volume achieved. For a session with a 4 h effective treatment time and with a blood flow of 340 mL/min, a total of 82 L of blood will be processed; the increase of the filtration fraction from 25% to 30% will result in an increase of convection volume from 20.5 to 24.6 L. Therefore, a substitution volume of ≥21 L will be ensured. However, total ultrafiltration in postdilution HDF is limited by the fraction of plasma water in the whole blood characterized by its determinants (e.g., hematocrit and total protein). Excessive and uncontrolled filtration leads to high transmembrane pressure, causing hemoconcentration and intradialytic protein leakage 14. A continuous adjustment of the total ultrafiltration is required to adequately control the membrane stress throughout the treatment.
This study also confirmed the positive impact of higher serum albumin on achieving high-volume HDF, as already showed by Penne et al. 8. Here, serum albumin levels ≥4.2 g/dL were positively associated with the achievement of at least 21-L substitution volume. Of note, the bromocresol green assay used here for albumin measurements generally provides higher albumin levels than the bromocresol purple method employed in many other centers, which further enhances the weight of this observation. The albumin effect is probably due to the associated higher colloid osmotic pressures and consequently higher refill rates, thus allowing a higher convective transport 15. Therefore, the supposed negative impact of a thicker protein layer on the membrane seems not to play a major role 16. Penne et al. 8 found an inverse relationship between the predialysis hematocrit level and convection volume. Joyeux et al. 17 reported a linear decrease in filtration fraction with an increase of mean hematocrit. We detected an association with substitution volume only in the univariate analysis and only at hematocrit levels above 39%. This relationship was not confirmed by the logistic regression. However, following concerns about excessive correction of anemia in ESRD patients, current average levels of hematocrit are now lower than in the past. In fact, levels of 36 ± 4.3% were reported in the CONTRAST study, which are higher than our average hematocrit of 33.8 ± 4.9%. As we did not evaluate postdialysis hematocrit, we cannot be more conclusive on the impact of viscosity on the achieved filtration fraction.
With AutoSub plus, dialyzer membrane stress is permanently assessed, combining high HDF filtration volumes with a trouble-free treatment. The relatively high serum albumin level of 4.04 ± 0.42 g/dL in the studied patients also presents indirect support for the safety of this modality with this technology. In this study, about 71% and 12% of the sessions were conducted by AutoSub plus with filtration fractions (i.e., with a ratio of convective flow rate to blood rate) ≥25% and ≥30%, respectively. It has to be stressed that no problems due to treatment interruptions were reported in the over 4000 sessions, and the number of alarms (arterial pressure, venous pressure, or TMP) and number of dialyzers and bloodlines needed did not increase compared with the time before AutoSub plus introduction. Other approaches have also yielded good results, including automatic–manual prescription of substitution fluid flow, taking hematocrit and total protein into consideration 18.
High blood flow can induce shear-stress-related problems, which occur when resistance to flow reaches a level that causes platelet damage and activation 19. Measures to reduce or even prevent shear stress were adopted as part of the routine clinical practice in the two centers; for example, use of large 14G or 15G needles, prevention of high negative arterial pressure alarms, and correct positioning of lines in the roller pumps 19. The surface area and treatment time are modifiers of convection volume. In this study, all patients were treated with a 1.6-m2 polysulfone dialyzer, and the effective treatment time was 4 h. Considering patients on suboptimal substitution volume, the two parameters can be modified within the constraints dictated by actual blood flow level. To increase substitution volume in such patients, we believe that first the dialyzer surface area should be increased, followed by gradually increasing treatment time above the minimum of 4 h. For catheter patients, it is likely that an increase of treatment time in the range of 15–30 min will be necessary, with a similar amount of time probably also needed to ensure adequate small molecule clearance. Comparisons of treatment practices and associated patient survival between the USA and Japan also support increasing time as a viable compensation for low blood flow 20. Unfortunately, in Portugal, clinical practice is suffering under the constraint of a strict capitation system which, while stipulating achievement of at least 12 h treatment per week, does not leave room for extending this time 21.
This study has limitations. The standard approach to treat all patients with 4 h of treatment and only one type of dialyzer does not allow us to check the discussed option to increase dialyzer surface area and/or treatment time prescription. Additionally, because of the observational nature of the study, causality cannot be assumed. Strengths of the study lie primarily in the prospective collection of data and the homogeneous practice exercised for all patients in both clinics. The level of homogeneity of dialysis practice in these clinics was high due to the clinics belonging to the same network and thus sharing a common set of medical and process targets, standard operating procedures, and identical dialysis equipment/disposables. This was verified by a quality control tool that detects deviations and benchmarks outcome 12,22.
Conclusions
This study shows that using continuous adjustment of the total ultrafiltration looped back by an automatic limitation of membrane stress, it is possible to achieve a high level of efficiency in terms of substitution volume in a large majority of patients treated on standard 4-h treatments. High-volume HDF with a substitution volume of ≥21 L is feasible in routine practice without additional workload and hemoconcentration-induced interruptions. Moreover, the risk of high protein leakage can be reduced. Even dialysis patients with low extracorporeal blood flows can benefit from the loop-back control to achieve higher filtration-flow to blood-flow.
Author contributions
D. M., C. S., and B. C. were responsible for the concept and design of the study. Data collection was performed by P. P., T. S., and B. P. Data analysis and interpretation was conducted by D. M., C. S., P. K., A. G., B. C. and P. P. Statistical analysis was handled by D. M. The article was drafted by D. M., C. S., A. G., and P. K. Critical revision of the article was carried out by D. M., C. S., P. P., P. K., A. G., and B. C. All authors approved the final article.
Acknowledgments
We gratefully acknowledge the work and dedication of the staff of the Portuguese clinics NephroCare Lumiar and NephroCare Guarda.
Conflict of Interest
All authors are employees of Fresenius Medical Care.
References
- Lornoy W, Becaus I, Billiouw JM, Sierens L, Van MP, D'Haenens P. On-line haemodiafiltration: remarkable removal of β2-microglobulin. Long-term clinical observations. Nephrol Dial Transplant. 2000;15(Suppl. 1):49–54. doi: 10.1093/oxfordjournals.ndt.a027964. [DOI] [PubMed] [Google Scholar]
- Tattersall JE, Ward RA. Online haemodiafiltration: definition, dose quantification and safety revisited. Nephrol Dial Transplant. 2013;28:542–550. doi: 10.1093/ndt/gfs530. [DOI] [PubMed] [Google Scholar]
- Canaud B, Bragg-Gresham JL, Marshall MR, et al. Mortality risk for patients receiving hemodiafiltration vs. hemodialysis: European results from the DOPPS. Kidney Int. 2006;69:2087–2093. doi: 10.1038/sj.ki.5000447. [DOI] [PubMed] [Google Scholar]
- Ok E, Asci G, Toz H, et al. Mortality and cardiovascular events in online haemodiafiltration (OL-HDF) compared with high-flux dialysis: results from the Turkish OL-HDF Study. Nephrol Dial Transplant. 2013;28:192–202. doi: 10.1093/ndt/gfs407. [DOI] [PubMed] [Google Scholar]
- Grooteman MP, van den Dorpel MA, Bots ML, et al. Effect of online hemodiafiltration on all-cause mortality and cardiovascular outcomes. J Am Soc Nephrol. 2012;23:1087–1096. doi: 10.1681/ASN.2011121140. [DOI] [PMC free article] [PubMed] [Google Scholar]
- Imamovic G, Hrvacevic R, Kapun S, et al. Survival of incident patients on high-volume online hemodiafiltration compared to low-volume online hemodiafiltration and high-flux hemodialysis. Int Urol Nephrol. 2014;46:1191–1200. doi: 10.1007/s11255-013-0526-8. [DOI] [PubMed] [Google Scholar]
- Maduell F, Moreso F, Pons M, et al. High-efficiency postdilution online hemodiafiltration reduces all-cause mortality in hemodialysis patients. J Am Soc Nephrol. 2013;24:487–497. doi: 10.1681/ASN.2012080875. [DOI] [PMC free article] [PubMed] [Google Scholar]
- Penne EL, van der Weerd NC, Bots ML, et al. Patient- and treatment-related determinants of convective volume in post-dilution haemodiafiltration in clinical practice. Nephrol Dial Transplant. 2009;24:3493–3499. doi: 10.1093/ndt/gfp265. [DOI] [PubMed] [Google Scholar]
- Goldau R, Kuhlmann U, Samadi N, et al. Ionic dialysance measurement is urea distribution volume dependent: a new approach to better results. Artif Organs. 2002;26:321–332. doi: 10.1046/j.1525-1594.2002.06817.x. [DOI] [PubMed] [Google Scholar]
- Wizemann V, Rode C, Wabel P. Whole-body spectroscopy (BCM) in the assessment of normovolemia in hemodialysis patients. Contrib Nephrol. 2008;161:115–118. doi: 10.1159/000130423. [DOI] [PubMed] [Google Scholar]
- Marcelli D, Kirchgessner J, Amato C, et al. EuCliD (European Clinical Database): a database comparing different realities. J Nephrol. 2001;14(Suppl. 4):S94–100. [PubMed] [Google Scholar]
- Stopper A, Amato C, Gioberge S, Giordana G, Marcelli D, Gatti E. Managing complexity at dialysis service centers across Europe. Blood Purif. 2007;25:77–89. doi: 10.1159/000096402. [DOI] [PubMed] [Google Scholar]
- Kalantar-Zadeh K, Regidor DL, Kovesdy CP, et al. Fluid retention is associated with cardiovascular mortality in patients undergoing long-term hemodialysis. Circulation. 2009;119:671–679. doi: 10.1161/CIRCULATIONAHA.108.807362. [DOI] [PMC free article] [PubMed] [Google Scholar]
- Kim ST, Yamamoto C, Taoka M, Takasugi M. Programmed filtration, a new method for removing large molecules and regulating albumin leakage during hemodiafiltration treatment. Am J Kidney Dis. 2001;38:S220–223. doi: 10.1053/ajkd.2001.27451. [DOI] [PubMed] [Google Scholar]
- Rodriguez M, Llach F, Pederson JA, Palma A. Changes in plasma oncotic pressure during isolated ultrafiltration. Kidney Int. 1982;21:519–523. doi: 10.1038/ki.1982.55. [DOI] [PubMed] [Google Scholar]
- Henderson L. Biophysics of ultrafiltration and hemofiltration. In: Jacobs C, Kjelistrand CM, Koch KM, Winchester JF, editors. Replacement of Renal Function by Dialysis. Dordrecht: Kluwer; 1996. pp. 114–145. [Google Scholar]
- Joyeux V, Sijpkens Y, Haddj-Elmrabet A, Bijvoet AJ, Nilsson LG. Optimized convective transport with automated pressure control in on-line postdilution hemodiafiltration. Int J Artif Organs. 2008;31:928–936. doi: 10.1177/039139880803101102. [DOI] [PubMed] [Google Scholar]
- Maduell F, Arias M, Garro J, et al. [Guidelines for automated manual infusion: a practical way of prescribing postdilution on-line hemodiafiltration] Nefrologia. 2010;30:349–353. doi: 10.3265/Nefrologia.pre2010.Apr.10411. In Spanish. [DOI] [PubMed] [Google Scholar]
- European best practice guidelines for haemodialysis (Part 1). III.5 Shear stress/haemolysis. Nephrol Dial Transplant. 2002;17:38–44. [Google Scholar]
- Saran R, Bragg-Gresham JL, Levin NW, et al. Longer treatment time and slower ultrafiltration in hemodialysis: associations with reduced mortality in the DOPPS. Kidney Int. 2006;69:1222–1228. doi: 10.1038/sj.ki.5000186. [DOI] [PubMed] [Google Scholar]
- Ponce P, Marcelli D, Guerreiro A, et al. Converting to a capitation system for dialysis payment—the Portuguese experience. Blood Purif. 2012;34:313–324. doi: 10.1159/000343128. [DOI] [PubMed] [Google Scholar]
- Richards N, Ayala JA, Cesare S, et al. Assessment of quality guidelines implementation using a continuous quality improvement programme. Blood Purif. 2007;25:221–228. doi: 10.1159/000101026. [DOI] [PubMed] [Google Scholar]