

Abstract
High-throughput sequence (HTS) analysis of combinatorial selection populations accelerates lead discovery and optimization and offers dynamic insight into selection processes. An underlying principle is that selection enriches high-fitness sequences as a fraction of the population, whereas low-fitness sequences are depleted. HTS analysis readily provides the requisite numerical information by tracking the evolutionary trajectory of individual sequences in response to selection pressures. Unlike genomic data, for which a number of software solutions exist, user-friendly tools are not readily available for the combinatorial selections field, leading many users to create custom software. FASTAptamer was designed to address the sequence-level analysis needs of the field. The open source FASTAptamer toolkit counts, normalizes and ranks read counts in a FASTQ file, compares populations for sequence distribution, generates clusters of sequence families, calculates fold-enrichment of sequences throughout the course of a selection and searches for degenerate sequence motifs. While originally designed for aptamer selections, FASTAptamer can be applied to any selection strategy that can utilize next-generation DNA sequencing, such as ribozyme or deoxyribozyme selections, in vivo mutagenesis and various surface display technologies (peptide, antibody fragment, mRNA, etc.). FASTAptamer software, sample data and a user's guide are available for download at http://burkelab.missouri.edu/fastaptamer.html.
Keywords: aptamer, bioinformatics, high-throughput sequence, next-generation sequencing, phage display, ribozyme, sequencing, SELEX, software
Introduction
Combinatorial selection technologies identify novel ligands, catalysts, and other functional biomolecules from large randomized libraries. The selected biomolecules find application as reagents for diagnostics1 and therapeutics,2 and as research tools to probe sequence-structure or sequence-function relationships,3 fitness landscapes,4,5,6 the origins of life,7 and other questions.8 Many technology platforms exist for carrying out combinatorial selections, such as in vitro evolution, various surface display techniques and biological selections, each of which samples diverse nucleic acid-encoded sequence space for desired phenotypes. The defining step in each strategy is to partition or preferentially amplify molecules of high-fitness from those of low-fitness. This evolutionary process is typically iterated for several rounds that include enzymatic or biological amplification of surviving molecules. Each iteration shifts genotypic and phenotypic frequencies within the population to favor those molecules that best survive the selection process, until a highly enriched library emerges.
Analysis typically begins by sequencing the functional nucleic acids (for aptamer or (deoxy)ribozyme selections) or the genes that encode the selected amino acid sequences (for phage display and in vivo selections). It is common to clone the output of the final selection round and to sequence a small number of plasmids using chain-terminating Sanger sequencing. This low-throughput sequencing method has identified functional biomolecules and provided a low-resolution snapshot of the selected populations at the end of the process. However, the steadily decreasing cost and increasing availability of next-generation HTS technologies provide opportunities to increase sampling depth dramatically and to extract high-resolution sequence information from multiple selection rounds, thereby making it possible to understand the dynamics of enrichment as they occured.9,10 Furthermore, monitoring the evolutionary trajectory of individual sequences throughout the course of a selection provides insight that can facilitate earlier discovery of candidate molecules and minimize the number of selection rounds performed,11,12 thereby limiting the loss of high-affinity molecules by preserving library diversity8,13 and reducing biases associated with biological amplification, nontarget binding, and cloning.14,15,16,17
Nevertheless, analysis of the data remains an obstacle to many practitioners of combinatorial selections. Although a few software tools have been published to analyze HTS data from combinatorial selections,18,19,20,21,22 these have not yet been widely adopted. Among workflows and tools that are shared, it is often the case that they are available only upon request, that they require a high level of computational expertise to implement, or that they are built around software primarily designed to answer specific experimental questions. For most other studies, informatics pipelines are unpublished custom scripts that lack the transparency and standardized workflow that has become essential in the era of Big Data. Taken together, these factors create an unnecessarily high barrier to the broad implementation of HTS and bioinformatic technologies by the combinatorial selections field.
To address these issues, we have developed the FASTAptamer toolkit as an open source collection of scripts that seamlessly perform many of the first-stage, sequence-level tasks that are common to all combinatorial selections, independent of the technology employed in the selection. The initial release of the toolkit (version 1.0) processes FASTQ formatted sequencing data, counts sequence frequency, ranks and sorts by abundance, calculates fold-enrichment (change in genotypic frequency across populations), clusters sequences based on a user-defined Levenshtein edit distance and enables searches for co-occurring nucleotide sequence motifs using degenerate nomenclature. Although the toolkit was initially designed for analysis of aptamer populations, the information it provides is equally applicable to the analysis of DNA-encoded sequence data from selection of nucleic acid and protein catalysts, surface display technologies (such as phage display) and selections for biological activity from mutant libraries. The software thereby fills a critical need for a stand-alone, readily-accessible, and easy-to-use informatics platform for HTS analysis of combinatorial selection outcomes,23 and it obviates the requirement for each lab to adapt or develop its own custom informatics pipeline to perform these tasks.
Results
Overview
FASTAptamer is a collection of modular Perl scripts written to be compatible across all UNIX-like systems (including Linux and Mac OS X, which both include Perl interpreters) and has no external dependencies. The software can also be used on Microsoft Windows platforms provided that a Perl interpreter is installed (see Materials and Methods). Each script is designed as a module to address one of several informatic tasks that are standard for the combinatorial selections field. The toolkit can be used by nonbioinformaticians for user-friendly, stand-alone analysis. For advanced users, the plug-and-play nature of the toolkit, open source licensing, and standard file formats preserve the option of integrating the output into customized workflows and existing sequence analysis pipelines as well as further development of the toolkit. FASTAptamer makes use of the widely supported FASTA format to ensure maximal interoperability with existing software. The algorithms of FASTAptamer exploit the format's description line (beginning with “>”) to identify each sequence uniquely with its corresponding data (such as rank within population, read number, and cluster information). The sequence line gives the actual entries using standard single-letter abbreviations for amino acid and nucleotide information. The analytical pipeline therefore begins with FASTAptamer-Count, which assigns unique identifying information to the description line of each sequence entry for downstream analysis. From FASTAptamer-Count, analysis can then continue within the toolkit to compare populations, to generate clusters of sequence families, to calculate fold-enrichment in one population relative to another, to search for sequence motifs (including degenerate or ambiguous motifs), or to proceed directly to other software tools.
The utility of the FASTAptamer toolkit was evaluated by analyzing two populations of RNA aptamers selected to bind HIV-1 Reverse Transcriptase (RT). The first population (70HRT14) was selected through 14 cycles of selection by nitrocellulose filter retention and native gel shift; this population has been described previously24,25,26 and thus served as a control for the analysis. The 70HRT14 population was subjected to one additional cycle of selection under slightly modified conditions to generate the second population (70HRT15) and both populations underwent HTS.
Raw FASTQ sequence files were preprocessed as described in Materials and Methods prior to use with the FASTAptamer toolkit. In general, the extent to which data files are processed after the sequencing run varies and often includes demulitplexing, merging paired-end reads, and filtering for high quality reads, all of which can be done with readily-available and widely-used software. For combinatorial selection libraries, these files are often additionally trimmed to remove fixed flanking regions prior to sequence analysis. An advantage of trimming before applying a quality filter is that it prevents unnecessary exclusion of sequences for which ambiguous base calls lie only within the constant regions. Phage display, protein mutagenesis selection, and other selections based on functional amino acid sequences can be analyzed by FASTAptamer either as nucleic acid sequence files or after translating to amino acid sequence (D. Salamango and M. Johnson, unpublished data). For the present study, a total of 2,160,216 sequences were obtained for 70HRT14 and 1,987,867 for 70HRT15 after pre-processing.
FASTAptamer-Count
The first steps in analyzing sequencing data from selections—whether by HTS or low-throughput sequencing—are the simple acts of counting the number of times each sequence is sampled from a population (alternately referred to as read count, sequence frequency, multiplicity, or copy number) and then ranking and sorting the sequences by abundance. Ordering in this manner allows for the downstream analysis of a subset of sequences based on multiplicity, rather than on a random capture of sequences by low-throughput sequencing methods.27,28,29 Normalizing the read count to the total number of reads in the population allows full data sets to be compared among multiple populations, even when the total numbers of reads varies between samples and sequencing runs.30
For the 70HRT14 and 70HRT15 populations, these tasks were accomplished using FASTAptamer-Count (command: fastaptamer_count), the module that serves as the entry point into the FASTAptamer toolkit. FASTAptamer-Count enumerates the abundance of each identical sequence within a population file and ranks the sequence entries by decreasing abundance. Each preprocessed, FASTQ formatted input file is nondestructively output as a FASTA formatted plain-text file in which the sequences are sorted as nonredundant entries. The FASTA identifier line that precedes each sequence entry in the output file contains the rank, reads and normalized reads per million (RPM) of the respective sequence separated by dashes, values that are later used throughout the toolkit. Thus, for the 70HRT14 population, the most abundant sequence (Rank = 1) was sampled 417,696 times, which corresponds to 193,358 RPM (Figure 1).
Figure 1.
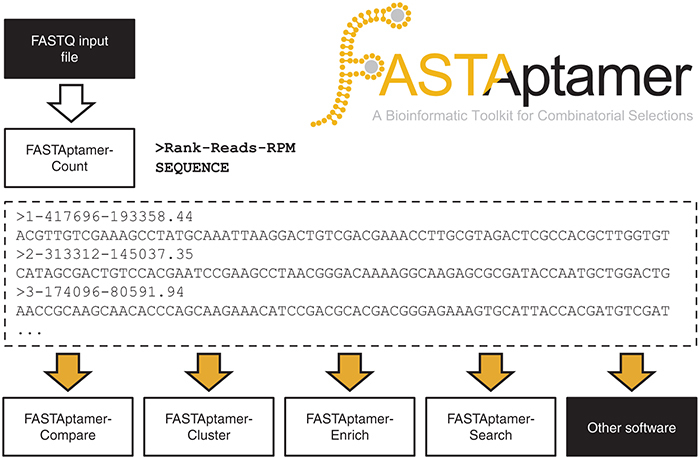
FASTAptamer-Count generates a nonredundant FASTA-formatted output file that preserves sequence abundance metrics and remains compatible with downstream applications. A preprocessed FASTQ-formatted file serves as input into FASTAptamer-Count (top, left). Sequences are counted for abundance, normalized to total number of reads per million (RPM) and ranked according to decreasing abundance. Output from FASTAptamer-Count is a FASTA-formatted, plain-text file in which the identifier line is used to preserve sequence rank, reads and RPM information separated by dashes (middle). Output from FASTAptamer-Count serves as the input (yellow arrows) for downstream FASTAptamer modules or for other software capable of manipulating FASTA input (bottom).
FASTAptamer-Count generates additional output in the form of a displayed summary report that includes the number of unique sequences and the total number of sequences, which can be used to determine library complexity and enrichment,30,31 as well as input and output file names and execution time. The FASTA formatted output of FASTAptamer-Count can be applied as input into downstream applications, including other FASTAptamer scripts or any software that accepts FASTA-formatted files as input. For highly-oversampled libraries (such as highly-enriched libraries from later selection cycles or libraries derived from low-complexity initial libraries), FASTAptamer-Count has the additional benefit of shrinking large file sizes to more manageable sizes for sharing and archiving. In the case of the 70HRT14 population, FASTAptamer-Count reduced the trimmed and filtered, 808.8 MB input FASTQ data file to a mere 6.2 MB output file in a matter of seconds using a standard laptop computer.
FASTAptamer-Compare
Pairwise comparison of sequence distributions between two populations provides a snapshot of reproducibility between replicate selections6 or replicate sampling of selection, and it reveals changes in genotypic frequencies that result from cycle-to-cycle enrichment,3,9,31 from application of a subtractive or negative selection step, or from otherwise changing the selection conditions.25,32 FASTAptamer-Compare populates a single, tab-delimited, plain-text file listing each sequence that is present in both populations along with the corresponding RPM values from each population in adjacent columns (Figure 2a). From this output, generation of XY scatter plots using standard spreadsheet software provides a visual snapshot of how genotypic frequencies in one population compare with those in another. When the two replicate datasets for sequencing of the 70HRT14 population were processed through FASTAptamer Compare (command: fastaptamer_compare) and plotted against each other, the vast majority of the sequences clustered very closely to the diagonal (Figure 2b), as expected from unbiased replicate sampling of the same population. In contrast, plotting RPM values for the two sequential cycles of selection shows a large group of sequences that are much more loosely clustered around the diagonal and a second group that is shifted notably upward (Figure 2c), as expected from a population that continues to evolve.
Figure 2.
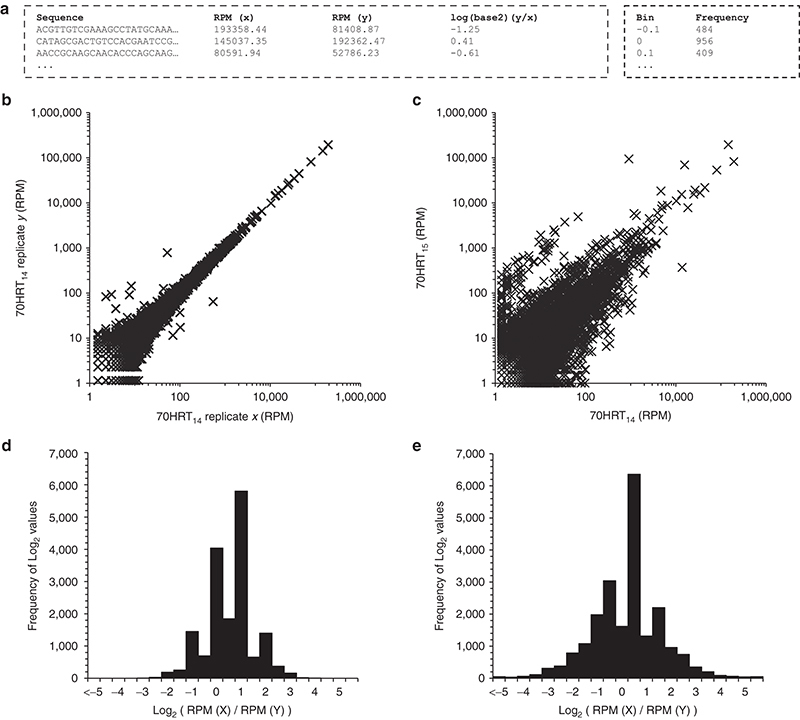
FASTAptamer-Compare output facilitates visualization of sequence distribution from replicate high-throughput sequence (HTS) sampling of 70HRT14 and after a single round of selection (70HRT14 and 70HRT15). (a) Output from black and white is intentional here FASTAptamer-Compare is provided as a tab-separated, plain-text file. (b) Scatter plot comparing replicate HTS sampling of the same population shows a close y = x relationship. (c) In contrast, two populations separated by a single round of selection show enrichment and depletion of sequences, as evident by a broadened distribution. (d) Histogram of sequence distribution of replicate HTS sampling from a single population shows a standard distribution. (e) In contrast, two populations separated by a single round of selection show a broader distribution as sequences have enriched or depleted as a function of the selection.
Aggregate changes in genotypic distributions are often represented as histograms of log2 values of the ratio of normalized reads: log2 (RPMy/RPMx). These values were calculated for the two 70HRT14 replicates and between the 70HRT14 and 70HRT15 populations using FASTAptamer-Compare. The script creates 100 bins spanning log2 values from −5 to +5 in intervals of 0.1 and populates each bin based on the number of calculated log2 values that fall within each bin interval. Values that fall outside of this range populate two additional bins on either end of the distribution (< −5 or > 5). The relatively high number of bins allows users the flexibility of reducing the number of bins easily without having to recalculate all values and facilitates the generation of a sequence distribution histogram, useful for comparing the distribution of sequences in two populations. As expected for a single population sequenced in replicate, the majority of sequence log2 values fall within −2 to +2 (Figure 2d), whereas the distribution was wider for a population that has undergone one additional round of selection as sequences were enriched or depleted (Figure 2e).
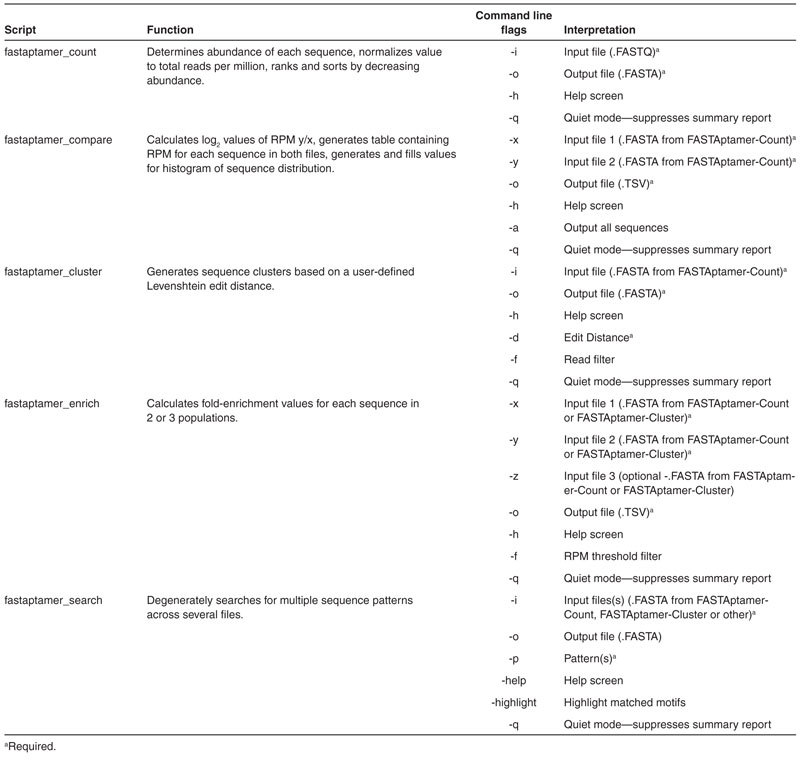
The default of FASTAptamer-Compare is to output information only for sequences that are present in both populations; however, users can invoke a command line option to include data for sequences that are present in only one population (Table 1). If this option is invoked, log2 values will not be calculated for those sequences to avoid divide-by-zero errors, and those sequences will be sent to output along with their corresponding nonzero RPM values. A summary report, including the input and output files and execution time, is displayed on screen upon completion of FASTAptamer-Compare.
Table 1. Summary of FASTAptamer scripts and command line flags.
FASTAptamer-Cluster
Populations from combinatorial selections usually contain clusters of closely-related sequences. For selections in which the randomized regions are small relative to the library size, all possible variants can be sampled in the initial library (e.g., 1015 strands, each with 20 randomized nucleotides, yielding 420 ≈ 1012 possible sequences, or 1,000 copies of each on average). In such cases, the clusters reflect convergent mapping of sequence space onto the fitness landscape.6,31 For long random regions and for small starting libraries, the probability becomes vanishingly small that two closely-related sequences would be independently sampled in the initial library. In such cases, clusters of closely-related sequences represent divergence from the initial seed sequences as the result of errors during polymerase chain reaction or other amplification steps.22 The accumulation of point mutants allows for the local exploration of sequence space by generating variants that were likely not present in the initial library,5,13 especially when intentional mutagenesis strategies are employed, such as doped-resynthesis of a seed sequence or low-fidelity amplification.4 In all of these cases, evolutionary trajectories within individual clusters and the aggregate trajectories of whole clusters are both informative.25,31
FASTAptamer-Cluster (command: fastaptamer_cluster) was used to parse the 70HRT14 and 70HRT15 populations (separately) into clusters of closely-related sequences, using the corresponding FASTAptamer-Count output files for each population. The script accomplishes this by considering Levenshtein edit distance (L), which is the total number of insertions, deletions, or substitutions required to transform one character string into another.25,31 In contrast to Hamming edit distance, which is utilized by SEWAL18 and AptaCluster22 and requires strings of equal length, Levenshtein edit distance can be calculated for sequences of unequal length that arise due to nucleotide insertions or deletions (“indels”). In the 70HRT14 and 70HRT15 libraries indels accounted for more than 36% of all unique sequences (40,898/113,441), representing an important source of information otherwise missed by alternative software. FASTAptamer-Cluster begins with the most abundant sequence in a population, referred to as the “seed sequence,” and clusters with it every sequence in the file within an edit distance less than or equal to the user defined distance (Cluster #1). The next most abundant unclustered sequence then serves as the seed sequence for assembling the second cluster from the remaining sequences (Cluster #2), followed by the next most abundant unclustered sequence (Cluster #3), and so on. This process is iterated until every sequence is clustered.
Output from FASTAptamer-Cluster is a FASTA formatted file that appends new information to the identifier line for each sequence. In addition to rank, RPM and total reads information originally generated by FASTAptamer-Count, each sequence in the FASTAptamer-Cluster output file is additionally and uniquely identified by its cluster number, rank within that cluster and the Levenshtein edit distance required to transform it into the seed sequence. As with FASTAptamer-Count, values are separated by dashes. For example, the most abundant sequence in the 70HRT14 population is also a member of the first cluster to be populated (Cluster #1); it is the most abundant sequence within that cluster (rank within cluster = 1); and 0 edits are required to transform it into itself (L = 0). The second and third most abundant sequences in this cluster each lie at an edit distance of L = 1 from the seed sequence, and they are the fifth and seventh most abundant sequences within the population as a whole (Figure 3a). Part of the power of FASTAptamer is that analytics such as these are immediately accessible for any sequence within its identifier line, and they can serve to prioritize a given sequence or cluster for further analysis.
Figure 3.
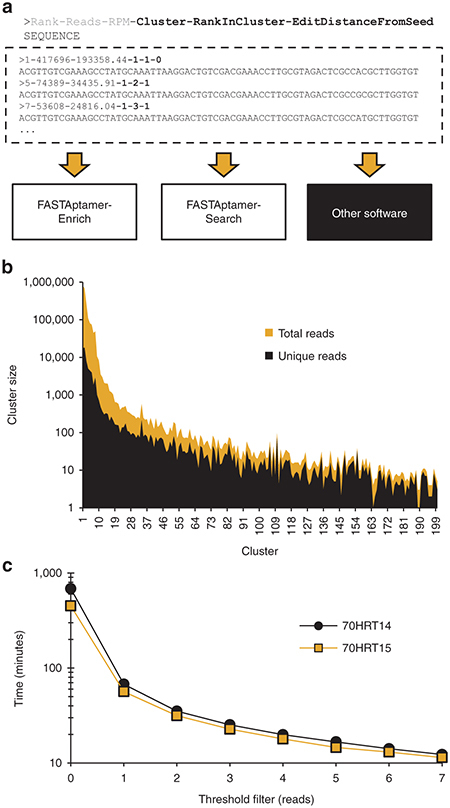
FASTAptamer-Cluster supplements information from FASTAptamer-Count with cluster identity calculated from a user-defined Levenshtein edit distance. (a) Using input from FASTAptamer-Count, FASTAptamer-Cluster generates sequence clusters, or families, of closely-related sequences. Output remains as a FASTA formatted file and contains additional information (in bold) separated by dashes on the cluster identity, the abundance rank of a particular sequence within that cluster and the number of edits (insertions, substitutions, or deletions) necessary to transform the string into the sequence that served as the cluster seed sequence. (b) Additional output from FASTAptamer-Cluster includes a list of each cluster and the number of sequences (unique and total) within the cluster, data that can be used to visualize and compare cluster sizes. (c) A threshold filter to cluster only those sequences with a read count greater than the filter setting significantly increases the speed of FASTAptamer-Cluster.
FASTAptamer-Cluster also generates a summary report listing each cluster generated and the number of unique sequences belonging to that cluster in terms of total reads and RPM. Plotting those values for the 70HRT14 population reveals the large number of closely-related sequence variants present within each of the top hundred or so clusters (Figure 3b). An elimination filter, similar to the “true-selected sequence” criteria employed by Thiel et al.,31 can be invoked at the command line to prevent the clustering of sequences below a user-defined read(s) threshold (Table 1). This both improves execution time and reduces the size of the dataset by excluding singletons and low-copy reads that, in aggregate, dominate highly diverse libraries. Invoking this filter reduced clustering time for the 70HRT14 and 70HRT15 populations to minutes, rather than hours, on a standard desktop computer (Figure 3c).
For the 70HRT14 and 70HRT15 libraries, both of which carry 70 initially-random nucleotides, we found that a user-defined edit distance of seven, entered on the command line prior to program execution, captured essentially all members of each cluster, as there were very few members of any cluster separated from the seed sequence by an edit distance of more than five.25 This value also prevented independent clusters from overlapping, given the near-zero probability of two sequences matching at 63 of 70 positions by chance. Although intentional mutagenesis will increase the likelihood that sequences accumulate >10% divergence from the parent, we have found that allowing too much variation for aptamer libraries increases the sampling of unrelated folds that are structurally unrelated to the seed sequence.33
FASTAptamer-Enrich
While sequence abundance alone can serve as useful criteria for identifying candidate molecules, the fold-enrichment ratio is an effective way to identify highly functional biomolecules and to eliminate false positives arising from selection biases that give rise to highly abundant sequences.9,25,31 FASTAptamer-Enrich (command: fastaptamer_enrich) accepts two or three input files from FASTAptamer-Count or FASTAptamer-Cluster and calculates fold-enrichment for each sequence present in more than one population by dividing the RPM of the sequence from one population by the RPM in another (e.g., RPMy/RPMx). Output is a single plain-text file with tab-separated values, which include the length of each sequence, the rank, reads, and RPM in each population and the fold-enrichment ratios in pairwise comparisons between the populations. Processing the 70HRT14 and 70HRT15 populations through FASTAptamer-Enrich and sorting for decreasing fold-enrichment revealed that a single round of selection was sufficient to enrich sequences by 200- to 500-fold, even when they were present only once or twice in the 70HRT14 population (Table 2).
Table 2. Sample tab-delimited output from FASTAptamer-Enrich, sorted to show the most highly enriched sequences from 70HRT15.
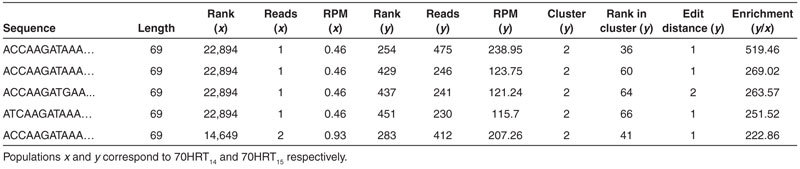
FASTAptamer-Enrich automatically detects whether each input file contains cluster information and adjusts output accordingly. The ability to view abundance, fold-enrichment and cluster information (where available) simultaneously for all the sequences across several populations is a key feature of the FASTAptamer toolkit. Output for FASTAptamer-Enrich can be restricted using an RPM filter invoked at the command line (Table 1). Filtering in this manner eliminates sequences with a total read count below a user-defined threshold (when RPM values are summed across all populations in which the sequence was present) and can focus subsequent analysis on sequences with stronger resampling statistics. A summary report containing the number of sequences in each population, along with file names and execution time, is displayed following execution of the script.
FASTAptamer-Search
A common post-selection task is to screen populations for the occurrence of known or newly-identified motifs. Command line utilities such as Grep, Sed, or Awk can perform such text searches, but they require a higher level of command line proficiency and understanding of regular expression syntax than is typical among life scientists. Conversely, desktop spreadsheet and word processor software can be cumbersome for very large data files, making them unsuited for performing such searches. FASTAptamer-Search (command: fastaptamer_search) is designed to find matching motifs in large FASTA sequence files quickly and easily. A key feature of FASTAptamer-Search is the ability to search degenerately for motifs using IUPAC-IUBMB nucleotide nomenclature (see Materials and Methods). The script also offers the advantage of being able to search multiple input files and multiple patterns simultaneously, facilitating searches across several populations. Output files preserve FASTA formatting and list the entries that contain the motif(s), including analytical metrics in the identifier line (Figure 4a). The output of FASTAptamer-Search can therefore serve as input into downstream software capable of further analysis. Invoking the highlight option during execution places parentheses around each occurrence of each motif for ease of visual inspection (Table 1). Additionally, FASTAptamer-Search displays the number of matching entries, input and output file names, and the execution time.
Figure 4.
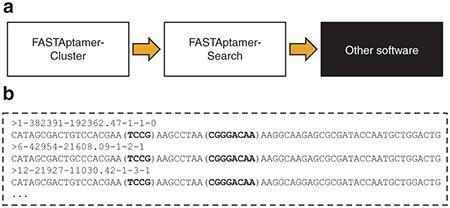
FASTAptamer-Search allows for degenerate motif searching. (a) Output from FASTAptamer-Cluster was input into FASTAptamer-Search. The focused search output can then be used in downstream applications, such as multiple sequence alignment software or comparative sequence analysis tools for secondary structure prediction. (b) Searching the Round 15 population for the F1Pk sequence motif using the patterns “UCCG” and “CGGGANAA” returns a list of matching sequences, some of which are seen here. Matched patterns (in bold) are enclosed with parentheses using FASTAptamer-Search's highlight option for increased visibility.
To test FASTAptamer-Search, we evaluated the 70HRT15 population for the presence of the Family 1 Pseudoknot (F1Pk) motif, which has previously been shown to dominate the 70HRT14 library.25 Aptamers with this structural motif contain two conserved regions; a UCCG sequence and a CGGGANAA sequence.34 A clustered output file corresponding to the 70HRT15 population was searched degenerately for both motifs using ribonucleotide nomenclature (e.g., UCCG instead of TCCG) to further demonstrate the degenerate searching ability of the script. FASTAptamer-Search identified the presence of both motifs in 30,515 non-redundant entries in the 70HRT15 population, including the three most abundant members of cluster #1 (Figure 4b) and accounting for nearly 42% of the unique sequences sampled.
Discussion
The advent of next-generation sequencing technologies over the past decade has brought with it a number of opportunities and challenges for the combinatorial selections field. Since the first application of HTS to phage display35 and aptamer libraries,14 practitioners of combinatorial selections have been increasingly integrating HTS analysis post-selection. Nevertheless, software solutions to streamline this process have not yet been widely adopted by the field, resulting in the development of custom scripts, most of which are not published and are neither intended nor suitable for general use. In addition, external dependencies hard-coded into many of the programs prevent them from being immediately deployable by nonbioinformaticians. Of the few scripts that have been shared, most are not designed to be modular, or they depend upon the specific computing environment in which they were built to solve a particular problem. Although the web-based Galaxy36,37 platform offers a number of tools useful for preprocessing and manipulating HTS data, the vast majority are geared towards genomic data analysis. The act of counting, ranking, and sorting a single selection population through the main set of Galaxy tools requires several discrete text-manipulation steps rather than the single-step processing offered by each module of FASTAptamer. While no public Galaxy server currently exists specifically for the combinatorial selections field, local or private installations can make use of the FASTAptamer toolkit by installing the toolkit from the Galaxy ToolShed.38 The field will benefit from increased accessibility, decreased external dependencies and a universally compatible and open source software platform to build upon.39
FASTAptamer is designed for nonbioinformaticians with ease-of-use, accessibility and compatibility in mind, in line with accepted best practices and guidelines in developing bioinformatics software.40,41,42,43 The scripts that comprise the toolkit are capable of functioning independently, allowing for modular integration into existing pipelines or in structuring new workflows for more experienced users. In addition to universal platform compatibility (i.e., ready to use on virtually all UNIX-like systems, including Mac OS X), the output from FASTAptamer is designed to remain compatible with existing software by providing only tab-delimited, plain-text files or FASTA formatted files, for which numerous computational tools can be employed, such as multiple sequence alignment or structure prediction software. FASTAptamer-Count extracts the most vital information from a sequencing population file and exploits the FASTA format by utilizing the description line to tag and track each sequence through the pipeline. FASTAptamer-Compare offers basic analysis tools for comparing populations and facilitates the generation of XY-scatter plots and histograms of sequence distribution. FASTAptamer-Cluster groups closely-related sequences into sequence families and provides information on each sequence's rank within the cluster and its degree of relatedness to the seed sequence. FASTAptamer-Enrich simultaneously provide information on multiplicity, rank, clusters and enrichment, aiding informed decisions for candidate screening. Finally, FASTAptamer-Search provides basic functionality for sequence motif searching.
The FASTAptamer toolkit introduces a novel mechanism for generating clusters of closely-related sequences. In contrast to the fitness landscape constructed by Jimenez et al. to determine evolutionary pathways6 and the network analysis performed by Thiel et al. to establish the interconnectedness of all sequences in a population,31 FASTAptamer-Cluster utilizes edit distance to facilitate the candidate identification process for postselection screening. FASTAptamer-Cluster determines whether each sequence in a population is closely related to a highly-abundant “seed” sequence, rather than determining its relationship to the entire population. Therefore, each sequence in a population can only belong to a single cluster and candidate molecules can be identified either for being representative of a cluster, or for outperforming members of their cluster. FASTAptamer-Cluster is implemented using only core Perl modules and uses an exhaustive approach to clustering, rather than the heuristic, computationally-efficient algorithms used by SEWAL18 and AptaCluster.22 This tradeoff results in lengthier execution times but allows for consideration of indels. Larger and more diverse populations (such as those from early selection rounds) can require an impractical amount of time to cluster, as execution time is a function of the number of unique sequences in a population, overall diversity of sequences, length of random region and edit distance criteria. To address this limitation, FASTAptamer-Cluster allows users to implement a threshold filter based on a sequence's total reads to exclude those sequences not highly sampled. Future implementation in a lower-level language or utilizing nonstandard Perl modules offers the potential of quicker processing, although at the cost of universal compatibility.
The FASTAptamer toolkit is intended to provide practitioners of combinatorial selection a simple, easy-to-implement toolkit to facilitate operations that are essential to all classes of selections, such as counting, comparing, calculating fold-enrichment and searching. We encourage others to build upon the open source platform. Opportunities for future improvements include expanded statistical analysis within existing scripts and additional tools for analysis of amino acid sequences and for intracluster enrichment comparisons. Long-term goals for FASTAptamer include improvements to the algorithm and execution speed (particularly for FASTAptamer-Cluster) and a graphical user interface or Galaxy36,37 based web server to eliminate the requirement for command line operation. FASTAptamer is available to download at http://burkelab.missouri.edu/fastaptamer.html and is also available on GitHub and through the Galaxy ToolShed.38
Materials and methods
In vitro selection. A previously reported 70N RNA aptamer library,24 enriched through 14 rounds for aptamers that bind RT from HIV-1 strain BH10 (Group M: Subtype B), was subjected to an additional round of in vitro selection against RT from the closely-related HXB2 strain, with slight modifications. In short, 200 pmol of the transcribed library was resuspended in 100 µl binding buffer (150 mmol/l KCl, 10 mmol/l MgCl2, 50 mmol/l Tris-HCl, pH 7.5), heated to 95 °C and cooled on ice. The RNA library was incubated with a thin strip of nitrocellulose (~3 × 20 mm) for several minutes and removed to subtract nonspecific binders. 40 pmol of RT was then added, and the mixture was incubated on ice for an additional 20 minutes. Separately, a nitrocellulose filter was prewet with 2 ml binding buffer. Immediately before application of incubated RNA:RT complex, the nitrocellulose filter was washed again with 1 ml of binding buffer. RNA:RT complex was then applied to filter under vacuum and washed with 1 ml of binding buffer. Suction continued for 10 minutes to allow the filter to dry. The filter was then removed and incubated in extraction buffer (10 mmol/l EDTA, 50 mmol/l NaCl, 8 mol/l urea). RNA was recovered by phenol/chloroform extraction and ethanol precipitation. Recovered RNA was reverse transcribed using ImProm-II Reverse Transcriptase (Promega, Madison, WI) and polymerase chain reaction amplified for HTS.
High-throughput sequencing and data preprocessing pipeline. Libraries were prepared for sequencing as previously described using a series of polymerase chain reaction steps to add Illumina adapters and sequencing indices for multiplexing.25 Sequencing was performed on an Illumina HiSeq2000 (University of Missouri DNA Core Facility). Data preprocessing was performed using cutadapt44 to trim 5′ and 3′ constant regions from sequences and to discard any uncut sequences or sequences not between 67 and 73 nucleotides long after trimming. Trimmed sequences were then filtered for high-quality reads by eliminating entire sequences if a single position had a Phred quality score less than 20 using FASTQ quality filter from a locally installed copy of the FASTX-Toolkit (http://hannonlab.cshl.edu/fastx_toolkit/). Both the 70HRT14 and 70HRT15 libraries were sequenced in duplicate and later merged using the UNIX program “cat.”
Implementation. The FASTAptamer toolkit is written in Perl 5 with no external dependencies and is designed to operate on any modern Unix-like system (including Linux and Mac OS X). The FASTAptamer toolkit has been tested using Mac OS X 10.5+, CentOS Linux 5.4 (Lewis Cluster—University of Missouri Bioinformatics Consortium) and Debian GNU/Linux 7.0. FASTAptamer can also run on a Microsoft Windows platform provided that a Perl interpreter has been installed, such as ActiveState Perl or Strawberry Perl. Installation and use of the FASTAptamer toolkit assumes only a basic working knowledge of command line operation. A tutorial using the sample data and with examples of properly formatted commands, including the use of command line options, is included in the user's guide that accompanies the software.
The scripts that comprise the toolkit make use of Perl regular expressions (pattern-matching strings) to identify FASTQ45/FASTA entries or sequence motifs (for FASTAptamer-Search) in input files. Many of the scripts function by creating a Perl variable for each population, known as a hash, which associates a unique key (the sequence) with a value. For FASTAptamer-Count, each unique sequence generates a corresponding key whose value is incremented with each occurrence of the sequence in the input file. The hash variables in FASTAptamer-Count are sorted into arrays by count values, in order of decreasing abundance, and then sent to output with a ranking. FASTAptamer-Count utilizes standard competition ranking, where tied values are given the same rank and leave a gap in the rankings (e.g., if two values are tied for the second-most abundance the rankings would be scored as 1, 2, 2, 4).
FASTAptamer-Compare and FASTAptamer-Enrich utilize the hash variable in a similar manner to FASTAptamer-Count, in that each sequence serves as a key, but for FASTAptamer-Compare and FASTAptamer-Enrich, the paired hash value stores a string of information (such as rank, reads, and RPM). An algorithm in both scripts iterates through the list of keys for the population z (for three input files in FASTAptamer-Enrich) and/or y hash and tests for the presence of the same key in the other hash variable(s). For sequences present in another population, the matching hash key and values are sent to output and removed from both hashes. In FASTAptamer-Compare, invoking the command to include all sequences results in the emptying of hashes to output for which no match in the sequence key was found.
FASTAptamer-Cluster utilizes a regular expression designed to match the two-line output generated by FASTAptamer-Count, where each pattern match creates a new entry in a Perl array variable. Several subroutines are included in the algorithm to iterate through all sequence entries, set up a distance matrix comparing two strings and calculate the Levenshtein edit distance. For each cluster, the first entry in the array (the “seed sequence”), which contains the entry of the most abundant sequence, is split into two parts containing the sequence metrics in the description line and the sequence itself. The next entry in the array is then similarly split, and both sequence strings are sent to a subroutine to calculate the degree of similarity. For sequences that have an edit distance equal to or less than the user-defined distance, the sequence entry is sent to output with cluster data appended to the description line. For sequences that require additional transformations to meet the threshold, the sequence is redirected to a separate array to be processed in the next cluster. This process is iterated until every sequence has been compared to the seed sequence and until all sequences have been clustered. Clustering performance was determined using a desktop computer running Debian GNU/Linux 7.0 and powered by an AMD Phenom X3 8750 processor with 4 GB of RAM.
FASTAptamer supports the International Union of Pure and Applied Chemistry and International Union of Biochemistry and Molecular Biology (IUPAC-IUBMB) sequence nomenclature for amino acid and nucleotide information.
Availability and license. The FASTAptamer toolkit, user's guide, and sample data can be downloaded from http://burkelab.missouri.edu/fastaptamer.html, and has been deposited on GitHub (http://github.com/FASTAptamer) for archival, version control, and open source development. Additionally, FASTAptamer is available in the Galaxy ToolShed38 under the “Combinatorial Selections” category. FASTAptamer is distributed under a GNU General Public License version 3.0.
Acknowledgments
Funding was provided by a graduate research assistantship through the University of Missouri Department of Biochemistry to K.K.A. and through grants provided to D.H.B. by the National Science Foundation Chemistry of Life Processes award CHE-1057506 and National Aeronautics and Space Administration Exobiology award NAG5-12360. Beta releases of the FASTAptamer toolkit were tested by Mark A. Ditzler (NASA Ames Research Center) and Milena Popovic (NASA Postdoctoral Program, Oak Ridge Associated Universities) for nucleotide sequence files, and by Marc C. Johnson (University of Missouri) and Daniel J. Salamango (University of Missouri) for translated sequence files. Adnan S. Hussaini (Saint Louis University School of Medicine) designed the FASTAptamer logo. The authors declare no conflict of interest.
References
- Wang AZ, Farokhzad OC. Current progress of aptamer-based molecular imaging. J Nucl Med. 2014;55:353–356. doi: 10.2967/jnumed.113.126144. [DOI] [PMC free article] [PubMed] [Google Scholar]
- Sundaram P, Kurniawan H, Byrne ME, Wower J. Therapeutic RNA aptamers in clinical trials. Eur J Pharm Sci. 2013;48:259–271. doi: 10.1016/j.ejps.2012.10.014. [DOI] [PubMed] [Google Scholar]
- Fowler DM, Araya CL, Fleishman SJ, Kellogg EH, Stephany JJ, Baker D, et al. High-resolution mapping of protein sequence-function relationships. Nat Methods. 2010;7:741–746. doi: 10.1038/nmeth.1492. [DOI] [PMC free article] [PubMed] [Google Scholar]
- Pitt JN, Ferré-D'Amaré AR. Rapid construction of empirical RNA fitness landscapes. Science. 2010;330:376–379. doi: 10.1126/science.1192001. [DOI] [PMC free article] [PubMed] [Google Scholar]
- Ameta S, Winz ML, Previti C, Jäschke A. Next-generation sequencing reveals how RNA catalysts evolve from random space. Nucleic Acids Res. 2014;42:1303–1310. doi: 10.1093/nar/gkt949. [DOI] [PMC free article] [PubMed] [Google Scholar]
- Jiménez JI, Xulvi-Brunet R, Campbell GW, Turk-MacLeod R, Chen IA. Comprehensive experimental fitness landscape and evolutionary network for small RNA. Proc Natl Acad Sci USA. 2013;110:14984–14989. doi: 10.1073/pnas.1307604110. [DOI] [PMC free article] [PubMed] [Google Scholar]
- Vaidya N, Manapat ML, Chen IA, Xulvi-Brunet R, Hayden EJ, Lehman N. Spontaneous network formation among cooperative RNA replicators. Nature. 2012;491:72–77. doi: 10.1038/nature11549. [DOI] [PubMed] [Google Scholar]
- Jolma A, Kivioja T, Toivonen J, Cheng L, Wei G, Enge M, et al. Multiplexed massively parallel SELEX for characterization of human transcription factor binding specificities. Genome Res. 2010;20:861–873. doi: 10.1101/gr.100552.109. [DOI] [PMC free article] [PubMed] [Google Scholar]
- Cho M, Xiao Y, Nie J, Stewart R, Csordas AT, Oh SS, et al. Quantitative selection of DNA aptamers through microfluidic selection and high-throughput sequencing. Proc Natl Acad Sci USA. 2010;107:15373–15378. doi: 10.1073/pnas.1009331107. [DOI] [PMC free article] [PubMed] [Google Scholar]
- Ravn U, Gueneau F, Baerlocher L, Osteras M, Desmurs M, Malinge P, et al. By-passing in vitro screening–next generation sequencing technologies applied to antibody display and in silico candidate selection. Nucleic Acids Res. 2010;38:e193. doi: 10.1093/nar/gkq789. [DOI] [PMC free article] [PubMed] [Google Scholar]
- Bayrac AT, Sefah K, Parekh P, Bayrac C, Gulbakan B, Oktem HA, et al. In vitro Selection of DNA Aptamers to Glioblastoma Multiforme. ACS Chem Neurosci. 2011;2:175–181. doi: 10.1021/cn100114k. [DOI] [PMC free article] [PubMed] [Google Scholar]
- Hoon S, Zhou B, Janda KD, Brenner S, Scolnick J. Aptamer selection by high-throughput sequencing and informatic analysis. Biotechniques. 2011;51:413–416. doi: 10.2144/000113786. [DOI] [PubMed] [Google Scholar]
- Berezhnoy A, Stewart CA, Mcnamara JO, 2nd, Thiel W, Giangrande P, Trinchieri G, et al. Isolation and optimization of murine IL-10 receptor blocking oligonucleotide aptamers using high-throughput sequencing. Mol Ther. 2012;20:1242–1250. doi: 10.1038/mt.2012.18. [DOI] [PMC free article] [PubMed] [Google Scholar]
- Zimmermann B, Gesell T, Chen D, Lorenz C, Schroeder R. Monitoring genomic sequences during SELEX using high-throughput sequencing: neutral SELEX. PLoS One. 2010;5:e9169. doi: 10.1371/journal.pone.0009169. [DOI] [PMC free article] [PubMed] [Google Scholar]
- Thiel WH, Bair T, Wyatt Thiel K, Dassie JP, Rockey WM, Howell CA, et al. Nucleotide bias observed with a short SELEX RNA aptamer library. Nucleic Acid Ther. 2011;21:253–263. doi: 10.1089/nat.2011.0288. [DOI] [PMC free article] [PubMed] [Google Scholar]
- Schütze T, Wilhelm B, Greiner N, Braun H, Peter F, Mörl M, et al. Probing the SELEX process with next-generation sequencing. PLoS One. 2011;6:e29604. doi: 10.1371/journal.pone.0029604. [DOI] [PMC free article] [PubMed] [Google Scholar]
- ‘t Hoen PA, Jirka SM, Ten Broeke BR, Schultes EA, Aguilera B, Pang KH, et al. Phage display screening without repetitious selection rounds. Anal Biochem. 2012;421:622–631. doi: 10.1016/j.ab.2011.11.005. [DOI] [PubMed] [Google Scholar]
- Pitt JN, Rajapakse I, Ferré-D'Amaré AR. SEWAL: an open-source platform for next-generation sequence analysis and visualization. Nucleic Acids Res. 2010;38:7908–7915. doi: 10.1093/nar/gkq661. [DOI] [PMC free article] [PubMed] [Google Scholar]
- Fowler DM, Araya CL, Gerard W, Fields S. Enrich: software for analysis of protein function by enrichment and depletion of variants. Bioinformatics. 2011;27:3430–3431. doi: 10.1093/bioinformatics/btr577. [DOI] [PMC free article] [PubMed] [Google Scholar]
- Hoinka J, Zotenko E, Friedman A, Sauna ZE, Przytycka TM. Identification of sequence-structure RNA binding motifs for SELEX-derived aptamers. Bioinformatics. 2012;28:i215–i223. doi: 10.1093/bioinformatics/bts210. [DOI] [PMC free article] [PubMed] [Google Scholar]
- Ravn U, Didelot G, Venet S, Ng KT, Gueneau F, Rousseau F, et al. Deep sequencing of phage display libraries to support antibody discovery. Methods. 2013;60:99–110. doi: 10.1016/j.ymeth.2013.03.001. [DOI] [PubMed] [Google Scholar]
- Hoinka J, Berezhnoy A, Sauna ZE, Gilboa E, Przytycka TM. AptaCluster - A Method to Cluster HT-SELEX Aptamer Pools and Lessons from its Application. Res Comput Mol Biol. 2014;8394:115–128. doi: 10.1007/978-3-319-05269-4_9. [DOI] [PMC free article] [PubMed] [Google Scholar]
- Ozer A, Pagano JM, Lis JT. New Technologies Provide Quantum Changes in the Scale, Speed, and Success of SELEX Methods and Aptamer Characterization. Mol Ther Nucleic Acids. 2014;3:e183. doi: 10.1038/mtna.2014.34. [DOI] [PMC free article] [PubMed] [Google Scholar]
- Burke DH, Scates L, Andrews K, Gold L. Bent pseudoknots and novel RNA inhibitors of type 1 human immunodeficiency virus (HIV-1) reverse transcriptase. J Mol Biol. 1996;264:650–666. doi: 10.1006/jmbi.1996.0667. [DOI] [PubMed] [Google Scholar]
- Ditzler MA, Lange MJ, Bose D, Bottoms CA, Virkler KF, Sawyer AW, et al. High-throughput sequence analysis reveals structural diversity and improved potency among RNA inhibitors of HIV reverse transcriptase. Nucleic Acids Res. 2013;41:1873–1884. doi: 10.1093/nar/gks1190. [DOI] [PMC free article] [PubMed] [Google Scholar]
- Whatley AS, Ditzler MA, Lange MJ, Biondi E, Sawyer AW, Chang JL, et al. Potent Inhibition of HIV-1 Reverse Transcriptase and Replication by Nonpseudoknot, “UCAA-motif” RNA Aptamers. Mol Ther Nucleic Acids. 2013;2:e71. doi: 10.1038/mtna.2012.62. [DOI] [PMC free article] [PubMed] [Google Scholar]
- Di Niro R, Sulic AM, Mignone F, D'Angelo S, Bordoni R, Iacono M, et al. Rapid interactome profiling by massive sequencing. Nucleic Acids Res. 2010;38:e110. doi: 10.1093/nar/gkq052. [DOI] [PMC free article] [PubMed] [Google Scholar]
- Kupakuwana GV, Crill JE, 2nd, McPike MP, Borer PN. Acyclic identification of aptamers for human alpha-thrombin using over-represented libraries and deep sequencing. PLoS One. 2011;6:e19395. doi: 10.1371/journal.pone.0019395. [DOI] [PMC free article] [PubMed] [Google Scholar]
- Cho M, Soo Oh S, Nie J, Stewart R, Eisenstein M, Chambers J, et al. Quantitative selection and parallel characterization of aptamers. Proc Natl Acad Sci USA. 2013;110:18460–18465. doi: 10.1073/pnas.1315866110. [DOI] [PMC free article] [PubMed] [Google Scholar]
- Thiel KW, Hernandez LI, Dassie JP, Thiel WH, Liu X, Stockdale KR, et al. Delivery of chemo-sensitizing siRNAs to HER2+-breast cancer cells using RNA aptamers. Nucleic Acids Res. 2012;40:6319–6337. doi: 10.1093/nar/gks294. [DOI] [PMC free article] [PubMed] [Google Scholar]
- Thiel WH, Bair T, Peek AS, Liu X, Dassie J, Stockdale KR, et al. Rapid identification of cell-specific, internalizing RNA aptamers with bioinformatics analyses of a cell-based aptamer selection. PLoS One. 2012;7:e43836. doi: 10.1371/journal.pone.0043836. [DOI] [PMC free article] [PubMed] [Google Scholar]
- Szeto K, Latulippe DR, Ozer A, Pagano JM, White BS, Shalloway D, et al. RAPID-SELEX for RNA aptamers. PLoS One. 2013;8:e82667. doi: 10.1371/journal.pone.0082667. [DOI] [PMC free article] [PubMed] [Google Scholar]
- Held DM, Greathouse ST, Agrawal A, Burke DH. Evolutionary landscapes for the acquisition of new ligand recognition by RNA aptamers. J Mol Evol. 2003;57:299–308. doi: 10.1007/s00239-003-2481-y. [DOI] [PubMed] [Google Scholar]
- Tuerk C, MacDougal S, Gold L. RNA pseudoknots that inhibit human immunodeficiency virus type 1 reverse transcriptase. Proc Natl Acad Sci USA. 1992;89:6988–6992. doi: 10.1073/pnas.89.15.6988. [DOI] [PMC free article] [PubMed] [Google Scholar]
- Dias-Neto E, Nunes DN, Giordano RJ, Sun J, Botz GH, Yang K, et al. Next-generation phage display: integrating and comparing available molecular tools to enable cost-effective high-throughput analysis. PLoS One. 2009;4:e8338. doi: 10.1371/journal.pone.0008338. [DOI] [PMC free article] [PubMed] [Google Scholar]
- Giardine B, Riemer C, Hardison RC, Burhans R, Elnitski L, Shah P, et al. Galaxy: a platform for interactive large-scale genome analysis. Genome Res. 2005;15:1451–1455. doi: 10.1101/gr.4086505. [DOI] [PMC free article] [PubMed] [Google Scholar]
- Goecks J, Nekrutenko A, Taylor J. Galaxy Team Galaxy: a comprehensive approach for supporting accessible, reproducible, and transparent computational research in the life sciences. Genome Biol. 2010;11:R86. doi: 10.1186/gb-2010-11-8-r86. [DOI] [PMC free article] [PubMed] [Google Scholar]
- Blankenberg D, Von Kuster G, Bouvier E, Baker D, Afgan E, Stoler N, et al. Galaxy Team Dissemination of scientific software with Galaxy ToolShed. Genome Biol. 2014;15:403. doi: 10.1186/gb4161. [DOI] [PMC free article] [PubMed] [Google Scholar]
- Code share. Nature. 2014;514:536. doi: 10.1038/514536a. [DOI] [PubMed] [Google Scholar]
- Prlić A, Procter JB. Ten simple rules for the open development of scientific software. PLoS Comput Biol. 2012;8:e1002802. doi: 10.1371/journal.pcbi.1002802. [DOI] [PMC free article] [PubMed] [Google Scholar]
- Seemann T. Ten recommendations for creating usable bioinformatics command line software. Gigascience. 2013;2:15. doi: 10.1186/2047-217X-2-15. [DOI] [PMC free article] [PubMed] [Google Scholar]
- Sandve GK, Nekrutenko A, Taylor J, Hovig E. Ten simple rules for reproducible computational research. PLoS Comput Biol. 2013;9:e1003285. doi: 10.1371/journal.pcbi.1003285. [DOI] [PMC free article] [PubMed] [Google Scholar]
- Leprevost Fda V, Barbosa VC, Francisco EL, Perez-Riverol Y, Carvalho PC. On best practices in the development of bioinformatics software. Front Genet. 2014;5:199. doi: 10.3389/fgene.2014.00199. [DOI] [PMC free article] [PubMed] [Google Scholar]
- Martin M. Cutadapt removes adapter sequences from high-throughput sequencing reads. EMBnet J. 2011;17:10–12. [Google Scholar]
- Cock PJ, Fields CJ, Goto N, Heuer ML, Rice PM. The Sanger FASTQ file format for sequences with quality scores, and the Solexa/Illumina FASTQ variants. Nucleic Acids Res. 2010;38:1767–1771. doi: 10.1093/nar/gkp1137. [DOI] [PMC free article] [PubMed] [Google Scholar]