

Abstract
Objective:
To compare the metabolite profiles of venous effluent from both kidneys of individuals with unilateral atherosclerotic renal artery stenosis (ARAS) in order to directly examine how impaired renal blood flow impacts small-molecule handling in humans.
Methods:
We applied liquid chromatography–mass spectrometry based metabolite profiling to venous plasma obtained from the stenotic (STK) and contralateral (CLK) kidneys of ARAS patients (n = 16), and both the kidneys of essential hypertensive controls (n = 11). Study samples were acquired during a 3-day protocol that included iothalamate clearance measurements, radiographic kidney phenotyping (Duplex ultrasound, multidetector computed tomography, and blood-oxygen-level-dependent MRI), and controlled sodium and caloric intake and antihypertensive treatment.
Results:
Partial least squares-discriminant analysis demonstrated clear separation of essential hypertensive kidney metabolite profiles versus STK and CLK metabolite profiles, but no separation between metabolite profiles of STK and CLK samples. All of the discriminating metabolites were similarly elevated in the STK and CLK samples, likely reflecting the lower glomerular filtration rate in the ARAS versus essential hypertensive individuals (mean 66.1 versus 89.2 ml/min per 1.73 m2). In a paired analysis within the ARAS group, no metabolite was significantly altered in STK compared with CLK samples; notably, creatinine was the same in STK and CLK samples (STK/CLK ratio = 1.0, P = 0.9). Results were unchanged in an examination of ARAS patients in the bottom half of renal tissue perfusion or oxygenation.
Conclusion:
Metabolite profiling does not differentiate venous effluent from STKs or CLKs in individuals with unilateral ARAS, despite the measurable loss of kidney volume and blood flow on the affected side. These findings are consistent with the kidney's ability to adapt to ARAS to maintain a range of metabolic functions.
Keywords: hypertension, metabolism, metabolomics, renal artery stenosis
INTRODUCTION
Among its many functions, the kidney participates in complex metabolic pathways responsible for amino acid and ammonium processing. Recently, we have used liquid chromatography–mass spectrometry (LC–MS) based metabolite profiling of plasma obtained from the aorta and renal vein of humans to broaden our view of renal small-molecule handling [1]. In addition to confirming the prior observations on the net renal uptake or release of select amino acids, our study identified several novel markers of renal metabolism and secretion [2–4]. This study, however, was limited in its ability to directly ascertain the effect of renal disease on renal metabolite handling because of the challenge in controlling for confounding variables in comparisons across individuals. For example, renal metabolite gradients could differ between individuals with different levels of kidney function based on the differences in diet, medications, or comorbidities.
Unilateral atherosclerotic renal artery stenosis (ARAS) constitutes a model in which the two kidneys of the same individual are subjected to different disease processes. Comparing the venous effluent from the stenotic (STK) and contralateral (CLK) kidneys of individuals with unilateral ARAS therefore provides an opportunity to compare potentially differential effects of ischemia and hypertension, within a similar systemic milieu, on renal metabolite handling. Our group has established a protocol to collect bilateral venous samples from humans with a range of unilateral ARAS severity, as well as essential hypertensive controls without ARAS, during controlled sodium and caloric intake and standardized antihypertensive drug treatment [5,6]. Individuals enrolled in this protocol undergo iothalamate clearance studies, as well as Duplex ultrasound examinations of their renal vessels, computed tomography (CT) examinations of kidney volume and perfusion, and blood-oxygen-level dependent (BOLD) MRI studies of tissue oxygenation. Using this cohort, we have previously shown the impact of ARAS on inflammation, and found that both the kidneys release several cell adhesion molecules and cytokines [7]. Furthermore, we observed that levels of some inflammatory mediators like soluble E-selectin and interferon-gamma were elevated in the STK compared with the CLK vein. These observations suggest that selective collection from individual renal veins can shed light on specific intrarenal processes. However, whether distinct metabolite signatures in ARAS lateralize to one of the kidneys remain unclear. Therefore, this study was designed to test the hypothesis that the application of LC-MS-based metabolite profiling would detect differential metabolic sequelae of a unilateral reduction in renal blood flow.
METHODS
Study cohort
Patients with unilateral ARAS (n = 16) or essential hypertension (n = 11) participated in a 3-day inpatient protocol in the clinical research unit of Saint Mary's Hospital (Rochester, Minnesota, USA) as previously described [5,6]. In brief, the presence of renal artery stenosis was defined by Doppler ultrasound measurements of more than 300 cm/s in the affected artery and quantitative CT angiographic measurements of more than 60% vessel occlusion. Individuals with diabetes were excluded, and all patients received either an angiotensin-converting enzyme inhibitor or angiotensin receptor blocker as part of their antihypertensive treatment during protocol studies. All participants were maintained on a 150 meq sodium, isocaloric diet prepared on site. Clinical phenotyping included measurements of glomerular filtration rate (GFR) by iothalamate clearance, blood pressure (BP), kidney volumes and perfusion by multidetector CT (MDCT), and tissue oxygenation BOLD magnetic resonance. BP was measured by automated oscillometric recordings, with three values taken three times daily (at 5, 7, and 9 min after a 5-min rest). For BOLD MRI studies, cortical and medullary deoxyhemoglobin content was measured as the relaxation coefficient (R2∗), as previously described, whereby higher R2∗ values denote higher deoxyhemoglobin content [8]. On the final day of the protocol, each individual underwent femoral vein cannulation using a 5F Cobra cathether, and plasma samples were obtained from both renal veins under fasting conditions. Written, informed consent was obtained for each study participant and studies adhered to the Declaration of Helsinki and were approved by the Mayo Clinic institutional review board.
Metabolite profiling
Renal venous plasma samples were profiled using three distinct LC-MS-based methods. Amino acids, amino acid derivatives, urea cycle intermediates, nucleotides, and other positively charged polar metabolites were profiled using 10 μl of plasma [9]. Organic acids, sugars, bile acids, and other negatively charged polar metabolites were profiled using 30 μl of plasma [10]. Lipids, including lysophosphatidylcholines, lysophosphatidylethanolamines, phosphatidylcholines, sphingomyelins, cholesteryl esters, diacylglycerols, and triacylglyerols, were profiled using 10 μl of plasma [11]. A table listing all of the metabolites measured for the current study is shown in Supplemental Digital Content 1. For each acylcarnitine and lipid analyte, the first number denotes the total number of carbons in the lipid acyl chain(s), and the second number (after the colon) denotes the total number of double bonds in the lipid acyl chain(s). All samples were run in a single LC-MS run. Metabolite peaks were manually reviewed for the quality of integration and, when feasible, compared against a known commercial standard to confirm the identity.
Statistical analyses
Metabolite data were ln-transformed because raw data were skewed. Two analytical approaches were used. First, we compared the renal venous metabolite levels across kidney groups, that is, venous plasma from the STKs (n = 16) and CLKs (n = 16) of individuals with ARAS, and from both the kidneys of essential hypertensive controls (n = 22). Given the number of metabolite variables, many with significant intercorrelations, we performed partial least squares-discriminant analysis (PLS-DA) to visualize the linear components that discriminate class membership, that is, STK versus CLK versus essential hypertension. PLS-DA analysis was performed on ln-transformed and standardized metabolite peak areas using MetaboAnalyst 2.0 [12,13]. This program performs PLS regression using the plsr function provided by the pls package in R, and classification and cross-validation using the corresponding wrapper function offered by the caret package. Variable Importance in Projection (VIP) scores generated by this program estimate the importance of each variable in the projection used in the PLS model. For the fifteen metabolites with the highest VIP scores, we compared the mean metabolite levels across the three groups using analysis of variance.
Second, we compared the venous metabolite profiles within individuals with ARAS (n = 16), comparing metabolite levels in the venous plasma from the STK versus the CLK. Mean metabolite levels were compared using paired t-tests. In exploratory analyses, we sorted individuals with ARAS on the basis of STK/CLK ratios for cortical perfusion (by MDCT), medullary perfusion (by MDCT), cortical R2∗ (by BOLD MRI), or medullary R2∗ (by BOLD MRI). In these four separate analyses, mean metabolite levels in STK and CLK samples were compared using paired t-tests for the subset of individuals in the bottom half (n = 8) of STK/CLK ratios for cortical and medullary perfusion (i.e. those with the greatest reduction in perfusion to the STKs relative to the CLKs) and the top half (n = 8) of STK/CLK ratios for cortical and medullary R2∗ (i.e., those with the greatest imbalance in oxygenation in STKs relative to CLKs). To account for 274 metabolites measured in our study, we set a Bonferroni-adjusted threshold of P less than 0.00018 (0.05/274). Across 16 paired samples, assuming equal variance, we had more than 99% power to detect a 10% difference between STK and CLK samples. Statistical tests were performed using SAS software, version 9.1.3 (SAS Institute, Cary, North Carolina, USA).
RESULTS
Clinical characteristics of the study sample are shown in Table 1. The age of study participants ranged from 29 to 79, with a mean of 61.4 in the essential hypertension and 64.8 in the ARAS group (P = 0.5). Relatively more women were included in the ARAS group, and GFR was lower in the ARAS compared with the essential hypertensive group (66.1 ± 30.9 ml/min per 1.73 m2 versus 89.2 ± 19.9 ml/min per 1.73 m2, P = 0.04). There were no significant differences in other measured cardiometabolic risk factors, including BMI, clinical lipid measures, or BP; by design, none of the study participants had diabetes and all participants received either an angiotensin-converting enzyme inhibitor or angiotensin receptor blocker as part of their antihypertensive treatment. The severity of stenosis in the ARAS group ranged between 52 and 89%, with a mean value of 74.9%, resulting in a mean Doppler peak systolic velocity of 360.3 ± 175.8 cm/s.
TABLE 1.
Clinical characteristics of individuals with essential hypertension and atherosclerotic renal artery stenosis
| Essential hypertension (n = 11) | ARAS (n = 16) | |
| Age | 61.4 ± 16.5 | 64.8 ± 8.7 |
| Sex (M/F) | 10 M/1 F | 8 M/8 F |
| Serum creatinine (mg/dl) | 1.1 ± 0.2 | 1.3 ± 0.5 |
| GFR (ml/min per 1.73 m2) | 89.2 ± 19.9 | 66.1 ± 30.9a |
| BMI (kg/m2) | 28.1 ± 5.0 | 26.6 ± 4.0 |
| Treatment by statins | 5 | 10 |
| Total cholesterol (mg/dl) | 177.8 ± 29.9 | 176.6 ± 27.5 |
| Triglycerides (mg/dl) | 128.4 ± 73.7 | 162.2 ± 99.7 |
| HDL cholesterol (mg/dl) | 47.4 ± 8.9 | 52.6 ± 20.3 |
| LDL cholesterol (mg/dl) | 104.8 ± 21.8 | 91.5 ± 31.4 |
| No. of antihypertensive drugs | 3.0 ± 1.4 | 3.3 ± 1.4 |
| SBP (mmHg) | 133.9 ± 17.5 | 134.6 ± 22.6 |
| DBP (mmHg) | 74.8 ± 12.7 | 69.3 ± 8.5 |
| Pulse pressure (mmHg) | 59.1 ± 12.4 | 65.3 ± 21.3 |
| Doppler peak systolic velocity (cm/s) | 360.3 ± 175.8 | |
| Degree of stenosis (%) | 74.9 ± 10.8 |
Data are mean ± SD. ARAS, atherosclerotic renal artery stenosis; GFR, glomerular filtration rate.
aP < 0.05 versus essential hypertension.
Kidney parameters, as determined by MDCT and BOLD MRI, are shown in Table 2. Consistent with the degree of arterial stenosis in the ARAS group, STKs were significantly shorter in length compared with CLKs (P = 0.02), and significantly smaller in volume compared with both CLKs (P = 0.006) and essential hypertensive kidneys (P < 0.001). Total renal blood flow to STKs was reduced relative to CLKs (P = 0.01) and essential hypertensive kidneys (P < 0.001); this was associated with a reduction in the cortical perfusion of STKs relative to essential hypertensive kidneys (P = 0.01), although medullary perfusion was not reduced relative to CLKs or essential hypertensive kidneys. No significant differences in tissue oxygenation as measured by BOLD MRI, and no difference in venous pO2, were identified across the kidney classes. Finally, there was a nonsignificant trend for increased plasma renin activity in venous plasma from STKs compared with CLKs and essential hypertensive kidneys.
TABLE 2.
Kidney parameters in individuals with essential hypertension and atherosclerotic renal artery stenosis
| Essential hypertension (n = 22) | CLK (n = 16) | STK (n = 16) | |
| Kidney size (CT, cm) | 10.9 ± 0.8 (9.3–12.1) | 11.2 ± 0.8 (9.9–12.7) | 10.3 ± 1.1a (9.8–10.4) |
| Total kidney volume (CT, ml) | 149.9 ± 23.3 (111.2–193.9) | 147.9 ± 37.7 (87.3–246.2) | 105.5 ± 42.4a,b (91.6–117.0) |
| Cortical volume (ml) | 95.9 ± 17.5 (69.3–134.0) | 95.3 ± 23.3 (62.3–152.2) | 67.9 ± 29.6a,b (46.2–68.9) |
| Medullary volume (ml) | 54.0 ± 10.3 (35.6–79.2) | 52.5 ± 23.3 (14.4–94.0) | 37.6 ± 19.9b (45.4–48.1) |
| Total renal blood flow (ml/min) | 385.3 ± 126.2 (214.6–724.2) | 342.7 ± 112.8 (99.0–564.6) | 229.4 ± 120.8a,b (110.6–212.9) |
| Cortical flow (ml/min) | 318.5 ± 113.7 (183.3–625.0) | 287.2 ± 94.1 (69.2–426.0) | 189.5 ± 105.8a,b (76.8–152.7) |
| Medullary flow (ml/min) | 66.8 ± 19.3 (28.2–108.2) | 55.5 ± 35.5 (5.5–138.5) | 39.9 ± 25.9b (33.8–60.2) |
| Renal tissue perfusion | |||
| Cortex (ml/min per ml of tissue) | 3.3 ± 0.8 (2.2–4.9) | 3.1 ± 0.8 (1.1–4.8) | 2.5 ± 0.9b (1.7–2.2) |
| Medulla (ml/min per ml of tissue) | 1.3 ± 0.4 (0.7–2.1) | 1.1 ± 0.3 (0.5–1.5) | 1.0 ± 0.3 (0.7–1.3) |
| Renal oxygenation (BOLD MRI) | |||
| Basal cortical R2* (/s) | 19.5 ± 2.6 (16.0–26.5) | 18.1 ± 3.4 (13.7–28.0) | 20.5 ± 5.4 (16.8–35.0) |
| Basal medullary R2* (/s) | 9.5 ± 6.6 (25.5–49.7) | 34.1 ± 9.8 (20.3–49.8) | 35.5 ± 7.6 (25.0–37.0) |
| Calculated GFR (ml/min per 1.73 m2) | 44.6 ± 10.3 (25.8–64.3) | 40.0 ± 16.4 (12.6–77.8) | 26.8 ± 16.0a,b (7.2–34.3) |
| pO2 (mmHg) | 59.4 ± 4.2 (50.0–65.0) | 64.6 ± 13.5 (51.0–108.0) | 66.1 ± 15.5 (62.0–64.0) |
| Renal vein PRA (ng/ml/h) | 11.4 ± 12.1 (0.1–38.6) | 13.8 ± 12.6 (0.2–46.3) | 16.9 ± 13.4 (20.1–21.6) |
Data are mean ± SD (range). ARAS, atherosclerotic renal artery stenosis; BOLD MRI, blood-oxygen-level-dependent MRI; CLK, contralateral kidney; CT, computed tomography; GFR, glomerular filtration rate; PRA, plasma renin activity; STK, stenotic kidney.
aP < 0.05 versus CLK.
bP < 0.05 versus essential hypertension.
As a result of the large number of metabolite variables, many with significant intercorrelations, we first performed PLS-DA to visualize and extract the metabolites that best separated individuals across the kidney groups. Results of PLS-DA, comparing the metabolite levels in renal venous plasma from essential hypertensive kidneys (n = 22), CLKs (n = 16), and STKs (n = 16), are shown in Fig. 1. STK and CLK samples were clearly distinct from essential hypertensive samples, but not from each other (Fig. 1a). VIP score provides a score for each metabolite, so that it is possible to rank the metabolites according to their predictive power in the PLS model; the fifteen metabolites with the highest VIP scores are shown in Fig. 1b, and their levels are listed in Table 3. For each metabolite, levels were lowest in the essential hypertensive samples, and elevated to a similar degree in the STK and CLK samples.
FIGURE 1.
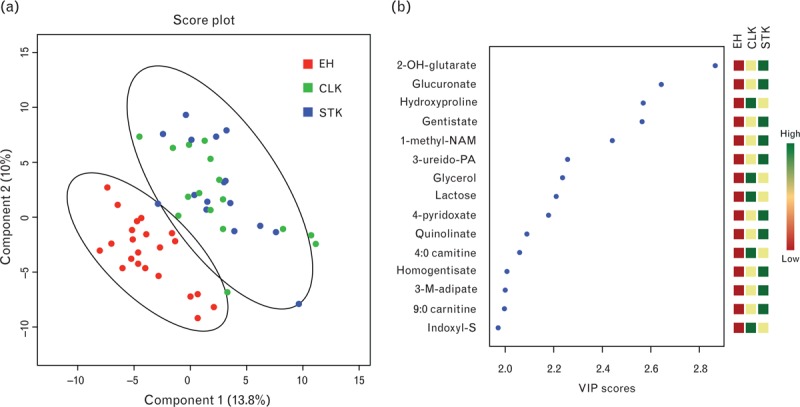
Comparison of metabolite levels in venous plasma from essential hypertensive kidneys, CLKs, and STKs. (a) PLS-DA plot of samples from essential hypertensive kidneys (red), CLKs (green), and STKs (blue). Oval outlines denote 95% confidence intervals. (b) VIP scores of top 15 metabolites, with direction of metabolite perturbation shown on right panel. CLK, contralateral kidney; 2-OH-glutarate, 2-hydroxyglutarate; indoxyl-S, indoxyl sulfate; 1-methyl-NAM, 1-methylnicotinamide; 3-M-adipate, 3-methyladipate; STK, stenotic kidney; 3-ureido-PA, 3-ureidopropionic acid.
TABLE 3.
Metabolites highlighted by the partial least squares-discriminant analysis of essential hypertensive kidney, contralateral kidney, and stenotic kidney samples
| Metabolite | Essential hypertension | CLK | STK | P |
| 2-Hydroxyglutarate | 117938 ± 10678 | 193460 ± 25206 | 181509 ± 12194 | <0.001 |
| Glucuronate | 544666 ± 36663 | 887695 ± 116551 | 923507 ± 121536 | 0.001 |
| Hydroxyproline | 84132 ± 3670 | 120348 ± 9205 | 115802 ± 8449 | 0.001 |
| Gentisate | 78773 ± 6189 | 181367 ± 52725 | 182817 ± 46689 | 0.002 |
| 1-Methylnicotinamide | 18825 ± 2694 | 124783 ± 67231 | 105437 ± 50784 | 0.006 |
| 3-Ureidopropionic acid | 10196 ± 721 | 14728 ± 1605 | 14153 ± 1257 | 0.005 |
| Glycerol | 695 ± 64 | 1090 ± 145 | 1095 ± 164 | 0.006 |
| Lactose | 194827 ± 21498 | 347056 ± 53232 | 331165 ± 46416 | 0.009 |
| 4-Pyridoxate | 182162 ± 29785 | 323118 ± 84979 | 350407 ± 106585 | 0.02 |
| Quinolinate | 246666 ± 27893 | 492398 ± 103882 | 462067 ± 79523 | 0.02 |
| 4 : 0 Carnitine | 463275 ± 40770 | 787314 ± 120598 | 769085 ± 115420 | 0.02 |
| Homogentisate | 211815 ± 4691 | 221946 ± 6568 | 230670 ± 5384 | 0.05 |
| 3-Methyladipate | 16681 ± 1381 | 23153 ± 3881 | 25009 ± 2804 | 0.06 |
| 9 : 0 Carnitine | 2832 ± 312 | 11637 ± 4865 | 7613 ± 2071 | 0.02 |
| Indoxyl sulfate | 5816597 ± 608790 | 10885042 ± 1821605 | 10991958 ± 2043225 | 0.03 |
Metabolite levels are peak areas, reported as mean ± SEM. CLK, contralateral kidney; PLS-DA, partial least squares-discriminant analysis; STK, stenotic kidney.
In addition to comparing the metabolite levels across groups (essential hypertensive kidneys, CLKs, and STKs), we examined STK versus CLK metabolite levels in each study participant with unilateral ARAS. These comparisons use each participant as his or her own control, enable paired statistical analyses, and facilitate the analysis of specific patient subsets. For each metabolite, Fig. 2 shows the mean STK/CLK ratio plotted against the corresponding P value. As shown, no metabolite level was significantly altered in the STK samples compared to CLK samples. Notably, creatinine levels as measured by the mass spectrometer were the same in STK and CLK samples, with a STK/CLK ratio of 1.0 (P = 0.9); we have previously shown that these LC-MS-derived creatinine measures are tightly and linearly correlated with the clinical laboratory measures of creatinine concentration (R2 ∼0.9) [1,14]. Results were largely unchanged in an examination of ARAS patients in the lower half of renal tissue perfusion (by MDCT) or oxygenation (BOLD MRI; Supplementary Digital Content 2). Finally, select STK/CLK ratios representative of nitric oxide biology, anaerobic metabolism (glycolysis), and aerobic metabolism (citric acid cycle intermediates and acylcarnitines) are shown in Fig. 3. No metabolites from these groups reached even nominal significance in the comparison between STK and CLK samples.
FIGURE 2.
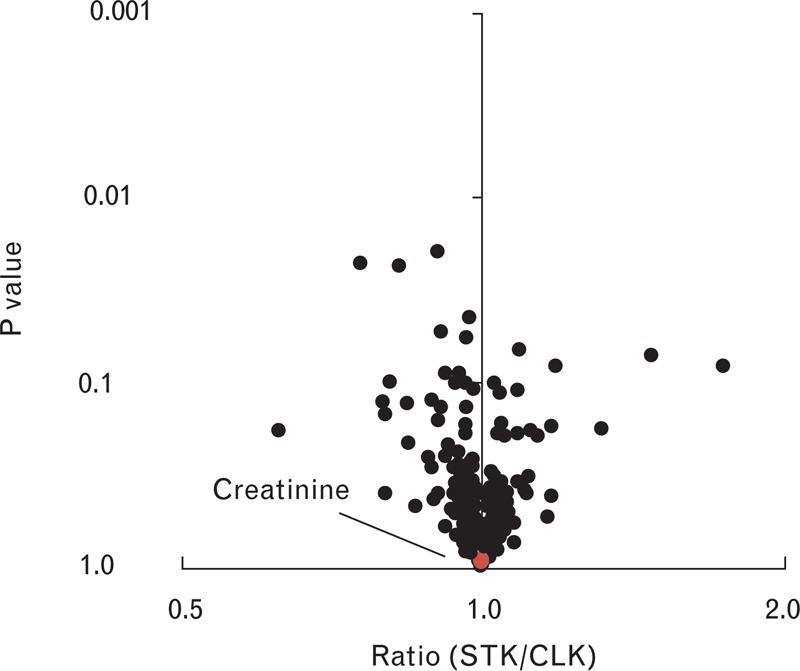
Comparison of metabolite levels in STK versus CLK samples from individuals with ARAS. Each data point represents a distinct metabolite. The geometric mean ratio of each metabolite for STK versus CLK samples is plotted on the x-axis, with corresponding P values plotted on the y-axis. Creatinine is highlighted in red. ARAS, atherosclerotic renal artery stenosis; CLK, contralateral kidney; STK, stenotic kidney.
FIGURE 3.
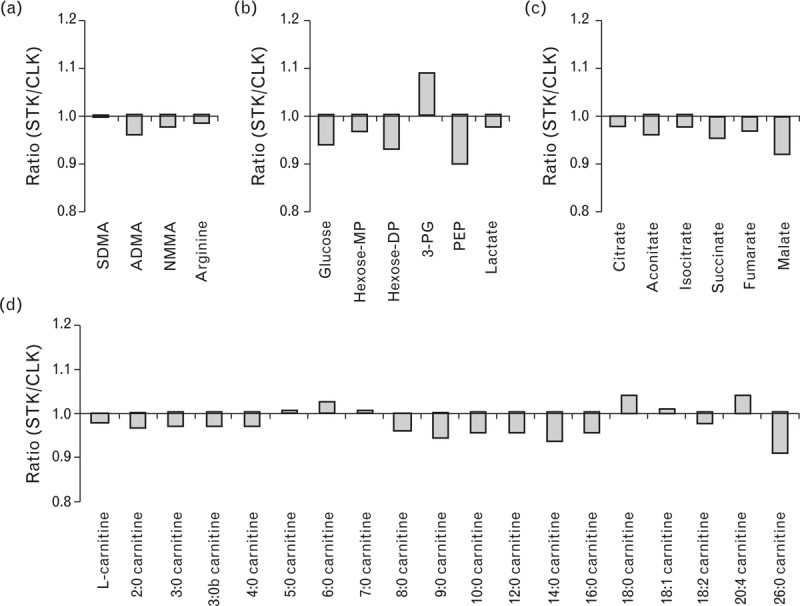
Select STK/CLK metabolite ratios related to (a) nitric oxide biology, (b) glycolysis, (c) the citric acid cycle, and (d) acylcarnitine metabolism. Data are geometric mean ratios, P greater than 0.05 for all metabolites. ADMA, asymmetric dimethylarginine; CLK, contralateral kidney; hexose-MP, hexose monophosphate; hexose-DP, hexose diphosphate; NMMA, NG-monomethylarginine; PEP, phosphoenolpyruvate; 3-PG, 3-phosphoglycerate; SDMA, symmetric dimethylarginine; STK, stenotic kidney.
DISCUSSION
Metabolomic approaches enable high-throughput, high-resolution metabolic phenotyping of human plasma. We performed LC-MS-based metabolite profiling of venous plasma obtained via catheterization of both kidneys from individuals with essential hypertension and ARAS, with the hypothesis that an imbalance in the renal arterial blood flow would manifest as different metabolite signatures in the venous effluent. Whereas the metabolomic profiles indeed differed between patients with essential hypertension and ARAS, few differences were detected between STK and CLK samples, despite adequate power to detect small changes. These results have implications for both the study of human renovascular disease as well as the burgeoning field of renal metabolomics.
ARAS is associated with a range of manifestations in the kidney, depending in part on the degree of arterial stenosis. Severe lesions can lead to progressive loss of renal function and interstitial fibrosis in some cases [15,16]. However, to what extent ARAS results in tissue hypoxia in general remains uncertain [17,18]. For example, venous erythropoietin levels are not elevated and venous oxygen saturation is not decreased in STK plasma relative to CLK plasma [19]. More recently, we have used BOLD MRI to show that renal tissue oxygenation is generally preserved in STKs compared with CLKs, although some relative hypoxia can be found in the subset of individuals with the most severe lesions [5,6]. Finally, large randomized controlled trials have found that restoring vessel patency usually fails to restore GFR or reverse inflammatory signaling when compared with medical therapy alone [20,21]. In the current study, we found similar changes in the renal venous effluent from both STKs and CLKs compared to essential hypertensive individuals in their disposition of more than 270 small molecules which span several axes of renal function, including filtration, metabolism, and tubular secretion [1]. Indeed, the mean STK/CLK ratio of creatinine was 1.0. Further, no pathway-specific metabolite patterns potentially related to tissue hypoxia, even at a nominal P value threshold, were noted. Taken together, these findings are consistent with the view that gradual, moderate reductions in kidney blood flow trigger compensatory mechanisms that preserve tissue oxygenation and maintain renal metabolic functions.
Whereas no metabolite differences were noted between STK and CLK samples, PLS-DA demonstrated a substantial separation of these two groups from essential hypertensive controls. Metabolites that differed between the ARAS kidneys versus the essential hypertensive group include hydroxyproline, a major component of collagen, as well as several related to energy metabolism (glucose derivatives, glycerol, and acylcarnitines). A likely explanation for these differences is the lower total GFR among individuals with ARAS compared with the essential hypertensive controls, as all 15 of the metabolites highlighted by PLS-DA were higher in the ARAS group; several of these metabolites, including 3-ureidopropionic acid, lactose, 4-pyridoxate, quinolinate, homogentisate, and indoxyl sulfate, are established uremic solutes in the literature; and we have previously shown that the majority of these metabolites are significantly cleared by the kidney [1,14,22]. Alternatively, unilateral ARAS, or the microvascular disease that exists in the atherogenic milieu of ARAS patients, might induce similar metabolic alterations in both kidneys and within the systemic circulation. Using this same study protocol, we have previously shown that a number of cell adhesion molecules, cytokines, and injury biomarkers such as neutrophil gelatinase-associated lipocalin are disturbed in both STKs and CLKs, consistent with a level of ‘cross-talk’ between the two sides [7]. Others have shown that both experimental and clinical unilateral ARAS results in increased fibrosis and inflammation in the CLK [23,24]. Further study will be required to determine whether the metabolites highlighted by our analysis reflect group differences in GFR or whether they report on the presence or absence of ARAS.
Recent studies have conducted metabolomic profiling of samples acquired from individuals with kidney dysfunction, with a particular emphasis on peripheral venous plasma and urine. These include cross-sectional studies of chronic kidney disease and end-stage renal disease [25–30], as well as longitudinal investigations of outcomes like chronic kidney disease progression and uremic cardiovascular risk [31–33]. Although these studies shed insight on the metabolic perturbations that arise with renal failure, they are unable to disentangle the relative contributions of diet, comorbidities, medications, and renal function. To that end, we have begun to perform physiologic profiling studies to directly ascertain the human kidney's impact on circulating metabolites, including an assessment of renal arteriovenous gradients made possible by invasive arterial and venous sampling under fluoroscopy [1]. The current study presents an intriguing physiologic model for studying renal small molecule handling, including the opportunity to use each individual as his or her own control as well as the potential to correlate metabolite levels with radiographic measures of kidney size, blood flow, perfusion, and oxygenation. Indeed, our results underscore the importance of selecting appropriate controls in metabolomic studies of renal function – a comparison of venous plasma from STKs alone versus essential hypertensive kidneys only would have been potentially misleading.
Several limitations warrant mention. First, the study size is modest. However, the paired STK versus CLK analyses in individuals with ARAS were well powered to detect small differences. We believe the likelihood of type II error is low, given the paucity of perturbations that reached even a nominal significance threshold. Second, despite the clear differences in renal blood flow between STKs and CLKs, there was no significant separation in perfusion or tissue oxygenation. It is conceivable that perturbed metabolism would accompany overt renal ischemia or hypoxia. Thus, differences between STK and CLK samples might have been identified had the study only included individuals with ARAS severe enough to result in tissue ischemia, although our exploratory subset analyses of individuals with low tissue perfusion and oxygenation did not detect trends for difference. Third, patients with ARAS spanned a broad range of age and changes in kidney size that developed over time; as the precise onset and duration of arterial occlusion is unknown, our study likely subsumes a distribution of renal responses and adaptation to decreased blood flow. Finally, there were relatively more men in the essential hypertensive group than the ARAS group. As sex impacts the circulating metabolite levels [34], the differences between the essential hypertensive and ARAS groups that we attribute to differences in estimated GFR may in part be because of sex differences; notably, this imbalance does not impact our analysis of STK versus CLK kidney among the ARAS patients.
ACKNOWLEDGEMENTS
The authors thank Beverly Tietje, John Woollard, Dr Hui Tang, Stephen S. Cha, and the Clinical Research Unit from St Mary's Hospital.
Financial support and sponsorship
This study was supported by the Extramural Grant Program by Satellite Healthcare, a not-for-profit renal care provider, and NIH grants K08-DK-090142, P01-HL-085307, RO1-DK100081, and UL1-RR-024150.
Conflicts of interest
There are no conflicts of interest.
Previous presentations of this work: None.
Supplementary Material
Footnotes
Abbreviations: ARAS, atherosclerotic renal artery stenosis; BP, blood pressure; BOLD MRI, blood-oxygen-level-dependent MRI; CLK, contralateral kidney; GFR, glomerular filtration rate; LC–MS, liquid chromatography–mass spectrometry; MDCT, multidetector computed tomography; PLS-DA, partial least squares-discriminant analysis; R2∗, relaxation coefficient; STK, stenotic kidney; VIP, Variable Importance in Projection
REFERENCES
- 1.Rhee EP, Clish CB, Ghorbani A, Larson MG, Elmariah S, McCabe E, et al. A combined epidemiologic and metabolomic approach improves CKD prediction. J Am Soc Nephrol 2013; 24:1330–1338. [DOI] [PMC free article] [PubMed] [Google Scholar]
- 2.Owen EE, Robinson RR. Amino acid extraction and ammonia metabolism by the human kidney during the prolonged administration of ammonium chloride. J Clin Invest 1963; 42:263–276. [DOI] [PMC free article] [PubMed] [Google Scholar]
- 3.Tizianello A, De Ferrari G, Garibotto G, Gurreri G, Robaudo C. Renal metabolism of amino acids and ammonia in subjects with normal renal function and in patients with chronic renal insufficiency. J Clin Invest 1980; 65:1162–1173. [DOI] [PMC free article] [PubMed] [Google Scholar]
- 4.Garibotto G, Valli A, Anderstam B, Eriksson M, Suliman ME, Balbi M, et al. The kidney is the major site of S-adenosylhomocysteine disposal in humans. Kidney Int 2009; 76:293–296. [DOI] [PubMed] [Google Scholar]
- 5.Gloviczki ML, Glockner JF, Crane JA, McKusick MA, Misra S, Grande JP, et al. Blood oxygen level-dependent magnetic resonance imaging identifies cortical hypoxia in severe renovascular disease. Hypertension 2011; 58:1066–1072. [DOI] [PMC free article] [PubMed] [Google Scholar]
- 6.Gloviczki ML, Glockner JF, Lerman LO, McKusick MA, Misra S, Grande JP, et al. Preserved oxygenation despite reduced blood flow in poststenotic kidneys in human atherosclerotic renal artery stenosis. Hypertension 2010; 55:961–966. [DOI] [PMC free article] [PubMed] [Google Scholar]
- 7.Eirin A, Gloviczki ML, Tang H, Gossl M, Jordan KL, Woollard JR, et al. Inflammatory and injury signals released from the poststenotic human kidney. Eur Heart J 2013; 34:540–548. [DOI] [PMC free article] [PubMed] [Google Scholar]
- 8.Gloviczki ML, Glockner J, Gomez SI, Romero JC, Lerman LO, McKusick M, et al. Comparison of 1.5 and 3 T BOLD MR to study oxygenation of kidney cortex and medulla in human renovascular disease. Invest Radiol 2009; 44:566–571. [DOI] [PMC free article] [PubMed] [Google Scholar]
- 9.Wang TJ, Larson MG, Vasan RS, Cheng S, Rhee EP, McCabe E, et al. Metabolite profiles and the risk of developing diabetes. Nat Med 2011; 17:448–453. [DOI] [PMC free article] [PubMed] [Google Scholar]
- 10.Rhee EP, Ho JE, Chen MH, Shen D, Cheng S, Larson MG, et al. A genome-wide association study of the human metabolome in a community-based cohort. Cell Metab 2013; 18:130–143. [DOI] [PMC free article] [PubMed] [Google Scholar]
- 11.Rhee EP, Cheng S, Larson MG, Walford GA, Lewis GD, McCabe E, et al. Lipid profiling identifies a triacylglycerol signature of insulin resistance and improves diabetes prediction in humans. J Clin Invest 2011; 121:1402–1411. [DOI] [PMC free article] [PubMed] [Google Scholar]
- 12.Xia J, Mandal R, Sinelnikov IV, Broadhurst D, Wishart DS. MetaboAnalyst 2.0 – a comprehensive server for metabolomic data analysis. Nucleic Acids Res 2012; 40:W127–W133. [DOI] [PMC free article] [PubMed] [Google Scholar]
- 13.Xia J, Psychogios N, Young N, Wishart DS. MetaboAnalyst: a web server for metabolomic data analysis and interpretation. Nucleic Acids Res 2009; 37:W652–W660. [DOI] [PMC free article] [PubMed] [Google Scholar]
- 14.Rhee EP, Souza A, Farrell L, Pollak MR, Lewis GD, Steele DJ, et al. Metabolite profiling identifies markers of uremia. J Am Soc Nephrol 2010; 21:1041–1051. [DOI] [PMC free article] [PubMed] [Google Scholar]
- 15.Safian RD, Textor SC. Renal-artery stenosis. N Engl J Med 2001; 344:431–442. [DOI] [PubMed] [Google Scholar]
- 16.Keddis MT, Garovic VD, Bailey KR, Wood CM, Raissian Y, Grande JP. Ischaemic nephropathy secondary to atherosclerotic renal artery stenosis: clinical and histopathological correlates. Nephrol Dial Transplant 2010; 25:3615–3622. [DOI] [PMC free article] [PubMed] [Google Scholar]
- 17.Textor SC, Wilcox CS. Renal artery stenosis: a common, treatable cause of renal failure? Annu Rev Med 2001; 52:421–442. [DOI] [PubMed] [Google Scholar]
- 18.Carey RM. Are kidneys not ischemic in human renal vascular disease? Hypertension 2010; 55:838–839. [DOI] [PubMed] [Google Scholar]
- 19.Nielsen K, Rehling M, Henriksen JH. Renal vein oxygen saturation in renal artery stenosis. Clin Physiol 1992; 12:179–184. [DOI] [PubMed] [Google Scholar]
- 20.Wheatley K, Ives N, Gray R, Kalra PA, Moss JG, Baigent C, et al. Revascularization versus medical therapy for renal-artery stenosis. N Engl J Med 2009; 361:1953–1962. [DOI] [PubMed] [Google Scholar]
- 21.Cooper CJ, Murphy TP, Cutlip DE, Jamerson K, Henrich W, Reid DM, et al. Stenting and medical therapy for atherosclerotic renal-artery stenosis. N Engl J Med 2014; 370:13–22. [DOI] [PMC free article] [PubMed] [Google Scholar]
- 22.Duranton F, Cohen G, De Smet R, Rodriguez M, Jankowski J, Vanholder R, et al. Normal and pathologic concentrations of uremic toxins. J Am Soc Nephrol 2012; 23:1258–1270. [DOI] [PMC free article] [PubMed] [Google Scholar]
- 23.Mai M, Geiger H, Hilgers KF, Veelken R, Mann JF, Dammrich J, et al. Early interstitial changes in hypertension-induced renal injury. Hypertension 1993; 22:754–765. [DOI] [PubMed] [Google Scholar]
- 24.Tullis MJ, Zierler RE, Caps MT, Bergelin RO, Cantwell-Gab K, Strandness DE., Jr Clinical evidence of contralateral renal parenchymal injury in patients with unilateral atherosclerotic renal artery stenosis. Ann Vasc Surg 1998; 12:122–127. [DOI] [PubMed] [Google Scholar]
- 25.Toyohara T, Akiyama Y, Suzuki T, Takeuchi Y, Mishima E, Tanemoto M, et al. Metabolomic profiling of uremic solutes in CKD patients. Hypertens Res 2010; 33:944–952. [DOI] [PubMed] [Google Scholar]
- 26.Sato E, Kohno M, Yamamoto M, Fujisawa T, Fujiwara K, Tanaka N. Metabolomic analysis of human plasma from haemodialysis patients. Eur J Clin Invest 2011; 41:241–255. [DOI] [PubMed] [Google Scholar]
- 27.Goek ON, Doring A, Gieger C, Heier M, Koenig W, Prehn C, et al. Serum metabolite concentrations and decreased GFR in the general population. Am J Kidney Dis 2012; 60:197–206. [DOI] [PubMed] [Google Scholar]
- 28.Shah VO, Townsend RR, Feldman HI, Pappan KL, Kensicki E, Vander Jagt DL. Plasma metabolomic profiles in different stages of CKD. Clin J Am Soc Nephrol 2013; 8:363–370. [DOI] [PMC free article] [PubMed] [Google Scholar]
- 29.Duranton F, Lundin U, Gayrard N, Mischak H, Aparicio M, Mourad G, et al. Plasma and urinary amino acid metabolomic profiling in patients with different levels of kidney function. Clin J Am Soc Nephrol 2014; 9:37–45. [DOI] [PMC free article] [PubMed] [Google Scholar]
- 30.Sharma K, Karl B, Mathew AV, Gangoiti JA, Wassel CL, Saito R, et al. Metabolomics reveals signature of mitochondrial dysfunction in diabetic kidney disease. J Am Soc Nephrol 2013; 24:1901–1912. [DOI] [PMC free article] [PubMed] [Google Scholar]
- 31.Goek ON, Prehn C, Sekula P, Romisch-Margl W, Doring A, Gieger C, et al. Metabolites associate with kidney function decline and incident chronic kidney disease in the general population. Nephrol Dial Transplant 2013; 28:2131–2138. [DOI] [PubMed] [Google Scholar]
- 32.Niewczas MA, Sirich TL, Mathew AV, Skupien J, Mohney RP, Warram JH, et al. Uremic solutes and risk of end-stage renal disease in type 2 diabetes: metabolomic study. Kidney Int 2014; 85:1214–1224. [DOI] [PMC free article] [PubMed] [Google Scholar]
- 33.Kalim S, Clish CB, Wenger J, Elmariah S, Yeh RW, Deferio JJ, et al. A plasma long-chain acylcarnitine predicts cardiovascular mortality in incident dialysis patients. J Am Heart Assoc 2013; 2:e000542. [DOI] [PMC free article] [PubMed] [Google Scholar]
- 34.Mittelstrass K, Ried JS, Yu Z, Krumsiek J, Gieger C, Prehn C, et al. Discovery of sexual dimorphisms in metabolic and genetic biomarkers. PLoS Genet 2011; 7:e1002215. [DOI] [PMC free article] [PubMed] [Google Scholar]
Associated Data
This section collects any data citations, data availability statements, or supplementary materials included in this article.