Abstract
The digital separation of diaminobenzidine (DAB)-stained tissues from hematoxylin background is an important pre-processing step to analyze immunostains. In most stain separation methods, specific color channels (for example: RGB, HSI, CMYK) or color deconvolution matrices are used to obtain different tissue contrasts between DAB- and hematoxylin-stained areas. However, these methods could produce incomplete separation or color changes because the color spectra of stains and co-localized stains overlap in histological images. Therefore, we proposed an automatic color-filtering to separate hematoxylin- and DAB-stained tissues. In implantation, the RGB images of DAB-labeled immunostains are first converted to 8-bit BN images by a mathematical translation to produce the largest contrast between brown DAB-stained tissues and blue hematoxylin-stained tissues. The first valley in the histogram revised by nonuniform quantization is set as the cut-off point to obtain a brown filter. DAB-stained tissues are accurately delineated from the background counterstain, resulting in DAB-only-image and De-DAB-image. Subsequently, a blue filter is designed in the CIE-Lab color space to further delineate the hematoxylin-stained tissues from the De-DAB-image. Finally, the average values of the remaining pixels of the De-DAB-image are set as the background color of the DAB-only-image to manage uneven dyeing and provide DAB-stained-image for adaptive immunohistochemistry quantitation. Extensive experimental results demonstrated that the proposed method has significant advantages compared with existing methods in terms of complete stain separation without changing the color in DAB-stained areas.
OCIS codes: (100.0100) Image processing; (100.3008) Image recognition, algorithms and filters; (170.0170) Medical optics and biotechnology; (170.1530) Cell analysis
1. Introduction
In immunohistochemistry (IHC), specifically marked antibodies are used to stain proteins in situ. Analyzing the intensity and distribution of immunostains at specific locations of interest targeted by receptors can provide clinically important information regarding cancer diagnosis, prognosis, or both [1,2]. The common practice in clinical pathology is visual scoring of immunostains (also termed manually) using a light microscope with medium-power magnification (using ×20 or ×40 objective lenses) [3]. A tumor is scored as 0/1+ (negative), 2+ (equivocal), or 3+ (positive) using commonly accepted scoring guidelines based on intensity or area of immunoreaction products [3,4]. However, visual scoring is time consuming and subjective. Computer-assisted immunostaining shortens analysis time and lessens inter-observer variation when staining levels are evaluated [4–6]. However, currently used methods often produce conflicting results because of differences in staining and analysis protocols.
Imaging analysis of immunostains is generally performed by differentiating staining components, including immunoreaction product (brown; diaminobenzidine, DAB) and hematoxylin counterstain (blue); DAB components are further segmented and quantitated [7–9]. Separating DAB-stained tissues from hematoxylin background is an important pre-processing step to analyze immunostains. Currently, many approaches have been proposed to automatically extract DAB-stained tissues. An automatic color separation in the RGB space is very difficult because of the correlation between the RGB values. Color classification methods convert the original image into other color space to eliminate the correlation between RGB values and thus associate each pixel of the image to a different stain based on thresholds. Common color spaces include the CMYK space [10], HSI space [11], and other translation space [12]. However, color classification methods present an incomplete separation effect caused by the overlap of the color spectrum of stains and the heterogeneity (in terms of intensity gradient and color) of the recognized regions.
Color deconvolution approach multiplies the RGB matrix of the input image by the inverse of the color spread matrix (namely, “color deconvolution matrix”) [13]; this method can yield better stain separation through colocalization or spectral superposition of dyes (for H-DAB-stained images) than the color classification method [11,14]. Color deconvolution can be applied to H-DAB images and to most commonly used dyes in histopathology (such as H-E, H AEC Azan-Mallory, Fast Red, Fast Blue, and DAB); thus, this approach is widely used to separate stain in histological images [4]. However, color deconvolution requires special and precise calibration and foreknowledge of pure dye color spectra, which could be impractical [15]. Moreover, color deconvolution is a chemical separation technique, in which each pixel is divided to pure DAB- and hematoxylin-stained components. Although this method effectively solves staining overlap, the RGB values of the obtained DAB-stained image differ from those of the original image. Thus, further segmentation is required to digitally separate the results for immunohistochemical quantitation.
“De-stain” method is based on selective re-distribution of color contrast from one color channel to two other channels to separate the stained areas of interest; this method is efficient in hematoxylin and eosin staining, DAB immunocytochemistry, and various tinctorial stains and does not require stain calibration and pre-definition [4]. However, “de-stain” method often changes the color of the target areas during separation; thus, this method could not directly used for stoichiometrical quantitation. To our best knowledge, studies have not yet reported automotive procedures to digitally separate DAB-stained areas without causing color changes.
In the present paper, we propose a color-filtering method to automatically separate hematoxylin and DAB tissues and obtain immunoreaction products using the digital images of DAB-labeled immunostains. In the implementation, we first design a BN translation formula: BN = Blue − α × Red − β × Green to solve the overlap of the stains’ color spectrum between brown DAB-stained tissues and blue hematoxylin-stained tissues and produce 8-bit BN images. A cut-off point is searched in the revised histogram of the BN image to obtain a brown filter and accurately delineate DAB-stained tissues from background counterstain without changing the color. Subsequently, a blue filter is designed in the CIE-Lab color space to further delineate hematoxylin-stained tissues. Finally, the average values of the remaining pixels are set as the background color of the DAB-stained and hematoxylin-stained images to prevent uneven dyeing. Extensive experimental results demonstrated that our proposed method provide significant results compared with currently used methods in terms of complete separation without changing the color to extract DAB-stained tissues.
The remaining sections of this paper are organized as follows. In Section Materials and methods, information regarding tissues, stains, microscopy, and imaging are described and the proposed “color-filtering” procedure for separating DAB-stained tissues is introduced. In Section Results and discussion, experimental results and discussion are reported, followed by Section Conclusion.
2. Materials and methods
2.1. Tissues and stains
Formalin-fixed and paraffin-embedded tissue sections were used in this study. Each section was 5 μm thick. Immunohistochemical staining was performed using a blue stain (hematoxylin) as background color and a brown stain (DAB) to reveal positively stained tissue areas. Datasets consisted of 151 cases of membrane activity, 78 cases of nuclear activity, and 30 cases of membrane/cytoplasm activity.
2.2. Microscopy and imaging
All of the sections were imaged using a standard diagnostic microscope attached with a colored digital still camera (Olympus® BX-51 from Olympus Corporation of Japan with JVC color video camera from Victor Company of Japan Limited and controlled by the Pathological Image Workstation of the NanFang Hospital in Guangzhou, China). The images were obtained using ×20 or ×40 objective lenses. Two images were acquired from a randomly selected location in each slide using a ×20 objective lens. Another two images were acquired in the same location using a ×40 objective lens. In microscopic imaging, the color of each pixel is a composite of three 8-bit monochromatic channels (red, green, and blue), resulting in a 24-bit color image.
The to-be-processed images are characterized by brown (DAB) and blue (hematoxylin) stains. The brown DAB stain highlights the specific portion of cancerous tissues that positively react at receptor activation. Figure 1 shows three examples of different IHC tissue images. These positive reactions to the receptors are localized in the nuclei, cellular membranes, or cytoplasms of cancerous cells [14]. However, a blue hematoxylin stain is used as a contrast color to highlight non-cancerous or cancerous portions that negatively react to the target receptors [5]. The background of the hematoxylin and DAB images is white in an ideal stain condition, indicating that light brown appearance is caused by the diffusing effect of the stain.
Fig. 1.

Examples of three types of IHC images wherein the brown areas are positive reactions stained by DAB. (A) a × 40 image with nuclear activity showing that the positive reactions are localized in the nuclei, called as positive nuclei. Blue areas contain negative nuclei and lymphocytes, etc.; (B) a × 40 image with membrane activity showing that positive reactions are localized in the cellular membranes; and (C) a × 40 image with cytoplasm activity showing that positive reactions are localized in the cytoplasm.
2.3. Overview of the proposed color-filtering method
Digital separation of DAB-stained tissues is important for immunostain quantitation. To overcome the effects of incomplete separation and color changes from the existing computer-based techniques, we proposed an automatic and flexible “color-filtering” method. This method can completely delineate DAB-stained tissues without changing the color. The proposed digital stain separation algorithm uses brown and blue filters to differentiate DAB-stained and hematoxylin-stained tissues through the optimal cut-off points in the histogram. For simplicity, this process is named as “color-filtering” in this paper. Figure 2 shows the flowchart of the present digital stain separation scheme, which contains five main phases presented in the following subsections.
Fig. 2.
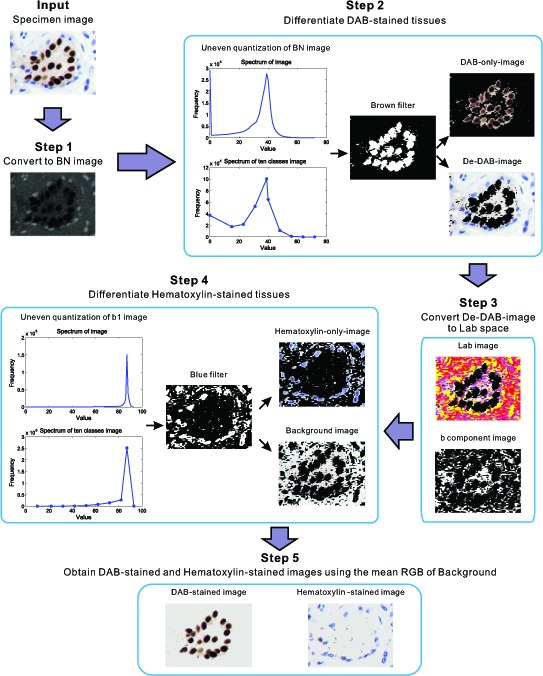
Flowchart of the present color-filtering method.
2.3.1. Convert to the revised BN space
The positive DAB-stained areas produced brown pigmentations. To solve the overlapping color spectrum of the stains, we first design a brown space for highlighting the brown pixels. The brown space is a mathematical translation that converts RGB images to 8-bit BN images using the following formula:
| (1) |
where {Red, Green, Blue} are the RGB values of the image and {α, β} < 1 are the factors that control the weighs of the Red and Green components.
Brown usually contains more Red and Green than Blue; thus, Red is the most superior, followed by Green and then Blue. In the measurement, the BNvalues in the DAB-stained, hematoxylin-stained, and background areas can be determined using the different values of {α, β}. Moreover, the BN values of Brown are smaller than those of the Blue and background. When the ratio of {α, β} is two, the BN images produce better contrast between the Brown DAB-stained and Blue hematoxylin-stained tissues. Hence, in this study, we set α = 0.5, β = 0.25 for all cases. Most of the DAB-stained pixels have negative BN values, which become more negative as the brown color becomes darker; thus, an 8-byte unsigned rounding process is performed to set these negative values as 0. As a result, the DAB-stained pixels obtain the minimum BN values, which are lower than those of the hematoxylin-stained and background pixels. Therefore, DAB-stained tissues can be separated from the background counterstaining in the Brown space.
2.3.2. Differentiate DAB-stained tissues with a brown filter
In the Brown space, we design a brown filter to differentiate DAB-stained tissues by searching a cut-off point in the histogram of the BN image as shown in Fig. 3. Figure 3(A) illustrates that the histograms of the BN image present two peaks; the first peak corresponds to the DAB-stained region; the second peak corresponds to the hematoxylin-stained and background regions. Therefore, the BN value (TBN) corresponding to the valley between these two peaks can be used as cut-off points to design a brown filter with the following formula:
| (2) |
where {i, j} are the coordinates of the pixels and {M, N} are the sizes of the images.
Fig. 3.
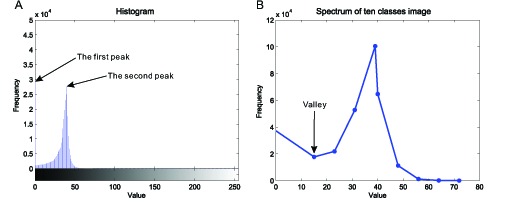
Cut-off point searching in the histogram of the BN image. (A) the histogram of BN image generated from the image shown in Fig. 6(A); (B) the spectrum displaying the curve of frequency distribution of ten classes image. The gray values of an 8-bit image range from 0 to 255, while some gray values dont exist in the image. The procedure of uneven quantization deletes the gray values with zero frequency and revises the spectrum by merging the gray values to 10 classes, which make valley searching easier. The valley in the revised spectrum is regarded as cut-off point to make a Brown-filter.
The pixel of the BN image is located before the valley in the histogram, thus the corresponding pixel of the brown filter is 1; otherwise, the corresponding pixel of the brown filter is 0. Hence, multiplying the brown filter and the original RGB image can produce a new image. This image contains the DAB-stained tissues with black background and designated as DAB-only-image. The brown filter has only {0, 1} values; thus, the colors of the DAB-stained tissues in the DAB-only-image are same as that of the original image whereas the remaining portion is De-DAB-image containing hematoxylin-stained tissues and background.
Conducting the searching algorithm of the valley in the histogram on all frequencies with an iterative scheme is time-consuming. Moreover, inhomogeneity exists in the hematoxylin and DAB images because of uneven dyeing and illumination, resulting in obtaining more than one valley. Therefore, we propose an uneven quantitation method with four main steps as follows:
-
1)
Divide the BN values into 10 equal intervals (Zj, j = 1, 2,...10).
-
2)
Obtain the maximum frequency in each interval and the corresponding BN value in the histogram and then designate as maxFj and max BNj, j = 1, 2, ···, 10, respectively.
-
3)Compare all the BN values (BNj,i) with the max BNj in each interval. If the BNj,i ≤ maxBNj, calculate the distance between BNj,i and max BNj in the current interval and the distance between BNj,i and max BNj−1 in the last adjacent interval using formula (3). Otherwise, calculate the distance between BNj,i and max BNj in the current interval, and distance between BNj,i and max BNj+1 in the next adjacent interval using formula (4).
(3) (4) -
4)
Classify all pixels of the whole image into different intervals according to the minimum distance between the current and adjacent intervals. The associative pixel values in each determined interval are set to be the maxBNj of that interval. The detailed calculation process is illustrated in Fig. 4.
Fig. 4.
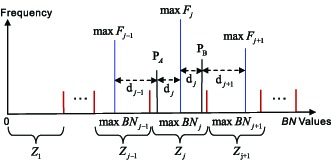
Illustration of the classification of pixels of whole image. For example, for the pixel PA, if dj−1 < dj, the pixel belongs to the interval Zj−1; otherwise, the pixel belongs to the interval Zj. For the pixel PB, if dj < dj+1, the pixel belongs to the interval Zj; otherwise, the pixel belongs to the interval Zj+1.
Figure 3(B) shows the revised histogram with lower than 10 different values. In practice, the BN value corresponding to the first valley of the revised histogram is used as a threshold (TBN) to classify the pixels of the brown filter as 0 or 1. Hence, the DAB-only-image (composed of DAB-stained pixels) and De-DAB-image (composed of hematoxylin-stained and background pixels) can be produced with the brown filter.
2.3.3. Convert to the lab space
The hematoxylin-stained areas contain negative nuclei, lymphocytes, blood vessels, stroma, and so on [6, 16]. In particular, the negative nuclei should be separated for IHC quantification and cell counting. In the De-DAB-image, the hematoxylin-stained areas are present as blue pigmentations whereas the background areas manifest white or very light brown appearance. CIE-Lab, a color system based on physiological characteristics, is used for blue cervical cells and skin lesion segmentation [17, 18]. In the CIE-Lab color space, the L component represents the brightness range from black to pure white with the value [0,100]. The a component represents the color range from red to green with the value [127, −128] and the b component represents the color range from yellow to blue with the value [127, −128]. The color is more similar to pure blue with larger negative b component value; thus, the b components of the blue hematoxylin-stained tissues have larger negative values than those of the background. Therefore, the b channel of the CIE-Lab space is suitable for separating the hematoxylin-stained pixels from the De-DAB-image.
In the implementation, we first map the RGB space of the De-DAB-image to the CIE -XYZ space [19].
| (5) |
where Y is the luminance, Z is quasi-equal to blue stimulation, and X is a mixture (a linear combination) of the cone response curves selected as non-negative. In the CIE-XYZ color space, the tri-stimulus values are regarded as “derived” parameters from the long-, medium-, and short-wavelength cones for human color vision [20]. Furthermore, we can map the XYZ color space to the Lab color space using the following formula [19]:
| (6) |
where L-a-b color space is the color-opponent space with dimension L for lightness, and a and b represent the color-opponent dimensions based on nonlinearly compressed CIE-XYZ color space coordinates. The other remaining variables are calculated as follows:
| (7) |
| (8) |
| (9) |
2.3.4. Differentiate hematoxylin-stained tissues with a blue filter
The b space of CIE -Lab can produce a noticeable contrast between the blue hematoxylin-stained tissues and the background. However, most of the hematoxylin-stained pixels have negative b values, which become more negative as the blue color becomes darker. Hence, we design a blue filter to differentiate the hematoxylin-stained tissues using a cut-off point in the histogram. The associative procedure is designed as follows:
-
1)
Produce a Lab image by converting the De-DAB-image from the RGB space to the Lab space.
-
2)
Split the Lab image into its b components and then calculate: b1 = b − min(b).
-
3)
Revise the histogram of b1 using the uneven quantization procedure as described in subsection Differentiate DAB-stained tissues with a brown filter.
-
4)Locate the peak in the histogram of b1 and set the point (P) before the peak as a cut-off point to obtain the blue filter with the following formula:
where {i, j} are the coordinates of the pixels and {M, N} are the sizes of the image.(10) -
5)
Use the blue filter on the De-DAB-image to yield hematoxylin-only-image and background-only-image.
Figure 5 shows an example of the cut-off point searching in the histogram of the b1 image. The background pixels form a narrow peak in the histogram (Fig. 5(A)) because more background pixels are present than hematoxylin-stained pixels. Furthermore, the b1 values of the hematoxylin-stained pixels range from 0 to 60 and are lower than those of the background pixels. Hence, the point of the revised histogram before the peak can be set as a cut-off point to obtain the blue filter for differentiating hematoxylin-stained tissues from the background region.
Fig. 5.

Cut-off point searching in the histogram of the b1 image. (A) the histogram of b1 image generated from the image shown in Fig. 6(A). The numbers and the b1 values of background pixels are more than the Hematoxylin-stained pixels, so the background pixels form a peak in the histogram. For the stains diffusing and heterogeneity, the Hematoxylin-stained pixels distribute in the low value zones; (B) the spectrum displaying the curve of frequency distribution of ten classes image. The b1 values of the Hematoxylin-stained pixels range from 0 to 60, so the point before the peak is set as a cut-off.
2.3.5. Obtain DAB-stained image and hematoxylin-stained image
The DAB-only-image contains no hematoxylin-stained pixels and the hematoxylin-only-image contains no DAB-stained pixels. However, inhomogeneous illumination and stain diffusion always exit in the IHC images, so the DAB-stained area or hematoxylin-stained area may be incomplete or mixed with some background pixels. The stain areas should be processed as following: filling the holes, repairing incomplete edges and eliminating the background pixels according to the background information. To address this problem and give a nice illustration, we calculated the mean RGB values of the background pixels (Ravg, Gavg, and Bavg) and assigned the black regions of the DAB-only-image and hematoxylin-only-image to the mean background values. Thus, the DAB-only-image and hematoxylin-only-image are recombined with the modified background to obtain the DAB-stained and hematoxylin-stained images. The associative images are adaptive for further tissues segmentation and would be helpful for visual scoring.
3. Results and discussion
3.1. Validation study of the proposed color-filtering method
Figure 6 shows an example of the proposed color-filtering method. Figure 6(A) is the representative image of a thyroid neoplasm section stained for CK. The brown areas are DAB-stained tissues, which highlight the cell membranes with positive reaction to the receptors. The blue areas, which highlight the nuclei, lymphocytes, and so on, are hematoxylin-stained tissues. Figure 6(B) shows the 8-bit BN image acquired from the mathematical translation of the RGB values. The brown pixels have low BN values represented by the dark areas in the BN image. The blue and background pixels have high BN values as shown by the bright areas in the BN image. Figure 6(C) shows the brown filter produced by searching the cut-off in the histogram of the BN image. Figure 6(D) shows the DAB-only-image, which is obtained from the De-DAB-image with the brown filter; the DAB-only-image contains DAB-stained pixels with black background. Figure 6(E) shows the De-DAB-image, which is the remaining component of the original image after DAB-stained tissues are eliminated. Figure 6(F) shows the hematoxylin-only-image, which is obtained from the De-DAB-image with the blue filter; the hematoxylin-only-image contains hematoxylin-stained pixels with black background. Figure 6(G) shows the background image representing the areas without any tissues. The average RGB values of the background image are assigned to the black areas of the DAB-only-image and hematoxylin-only-image to produce the DAB-stained-image (Fig. 6(H)) and hematoxylin-stained-image (Fig. 6(I)).
Fig. 6.
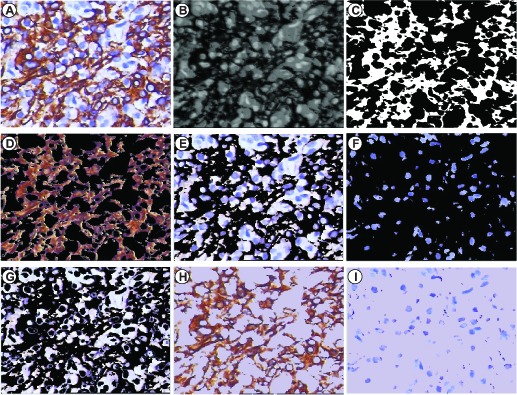
An experimental result from the present color-filtering method. (A) a representative IHC tissue image stained for CK; (B) the 8-bit BN image highlighting the contrast between DAB-stained tissues and hematoxylin background. The dark areas are the DAB-stained tissues, and the remaining areas are the Hematoxylin-stained tissues and background; (C) the brown-filter image with only two values: 0 or 1, multiplying by (A) to extract (D) a DAB-only-image containing brown DAB-stained tissues with black background and (E) a De-DAB-image; (F) the Hematoxylin -only-image containing blue Hematoxylin -stained tissues with black background; and (G) the Background image which is averaged to set as the back color of (D) and (F) to make (H) a DAB-stained-image and (I) a Hematoxylin -stained-image.
The negative DAB-stained IHC images with visual score of 0 may contain very few brown pixels. Thus, producing a brown filter to extract the brown pixels is unnecessary. In the implementation, we set the maximum BN value (BNmax) to identify the negative DAB-stained IHC image. If 99% of the pixel values are higher than BNmax, the associative image is classified as negative pigmentations. These negative images are directly converted to the CIE -Lab space to extract blue hematoxylin-stained tissues. In the present study, BNmax is set as 10 in all cases.
We tested the proposed method on 26 datasets of real IHC images from different cancer tissues, including low differentiated squamous cell lung carcinoma, breast infiltrative ductal carcinoma, and thyroid neoplasm. The experimental results were divided into three groups, namely, membrane activity, cytoplasm activity, and nuclear activity, according to the types of the IHC images. Figure 7 demonstrates that the proposed color-filtering method can automatically differentiate DAB-stained and hematoxylin-stained tissues.
Fig. 7.
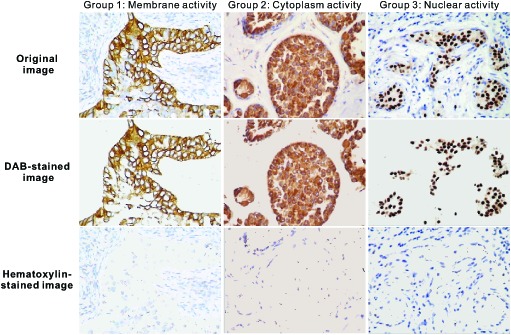
The separation effects of the present color-filtering method. The Group1 uses IHC images with membrane activity, so the positive reactions locate in the cellular membrane; The DAB-stained images show only the brown membrane whose area percentages and intensity are used for quantitation; The Group2 uses IHC image with cytoplasm activity, so the positive reactions locate in the cytoplasm. The DAB-stained images show only the brown cytoplasm; The Group3 uses IHC images with nuclear activity, so the positive reactions locate in the nuclei. The DAB-stained images show only the brown nuclei, called positive nuclei. Some nuclei do not react to the receptor, called negative nuclei. The Hematoxylin-stained image shows these blue negative nuclei.
The information carried by the DAB-stained images and the hematoxylin-stained images can be used for further segmentation of cell membranes, nuclei, and cytoplasm. In the IHC images with membrane activity, the whole cell membranes can be reconstructed based on segmentation of visible membranes in the DAB-stained areas and realistic simulation of invisible membranes using nuclei as a spatial reference in the hematoxylin-stained areas [21]. Inhomogeneous stains and the overlap of the nuclei result in irregularly shaped positive and negative nuclei, so more segmentation should be performed [2]. The cytoplasm can be segmented using the location of cell membranes and nuclear membranes. In next work, we will probe these further segmentation methods.
3.2. Positive color selection analysis compared with the color deconvolution method
To perform positive color selection analysis, we compared the results of color-filtering method with a more arbitrary method using color deconvolution (Fig. 8).
Fig. 8.
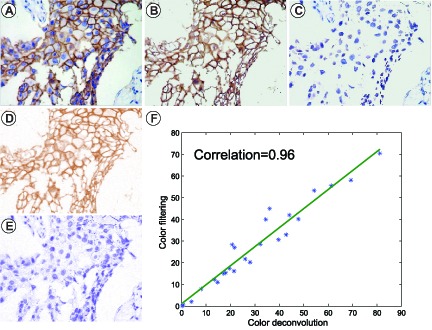
Positive color selection compared to color deconvolution analysis. (A) a representative immunohistochemical image stained for CK7; (B)(C) the DAB-stained-image and the Hematoxylin-stained-image obtained by color-filtering method showing the same values with original image, respectively; (D)(E) the DAB-stained-image and the Hematoxylin-stained-image obtained by color deconvolution method showing different RGB values with original image, respectively; and (F) Percentages of DAB-stained area display a strong association with results obtained from color deconvolution method.
The color deconvolution plugin (java and class files) for ImageJ can be downloaded from the website (http://www.mecourse.com/landinig/software/cdeconv/cdeconv.html). The consistency of separation was evaluated through color-filtering and color deconvolution using the percentages of the positive areas. The results of color-filtering are significantly associated with those of the color deconvolution (Fig. 8(F)). However, the color of DAB-stained areas and hematoxylin-stained areas separated by the color deconvolution method are inconsistent with the original color. The proposed color-filtering method maintains the original color of the stained areas.
In order to compare the color separation effects of the two methods, we performed nuclei counting experiments using the datasets of IHC images with nuclear activity. The nuclei can be automatically counted using the “regionprops” and “im2bw” functions provided by the image processing toolbox within Matlab R2014a. We measured the detection rate of nuclei for quantitative evaluation of the two methods. The Detection is calculated as the following formula:
| (11) |
where error is the false number of nuclei detected by the two computer-aided methods, and total is the number of nuclei counted by two pathologists. The detection rates of nuclei are listed in Table 1. Comparing to the manual counting, the two methods obtained good results on detecting positive nuclei, and color-filtering is slightly better than color deconvolution (p = 0.0763, independent two-sample t-test); while for the detection of negative nuclei, color-filtering has a significant improvement over color deconvolution (p < 0.0001, independent two-sample t-test), although the detection rate is less than that of positive nuclei. This reduction for detecting negative nuclei may result from the presence of few non-cancerous components in the hematoxylin-stained images, such as lymphocytes, blood vessels, stroma, and so on. To address this issue, some more morphological parameters should be introduced to remove these few non-cancerous components from hematoxylin-stained images in the further work.
Table 1.
A comparison of the running time and the accuracy of counting nuclei (X̄ ± S)
| Methods | t-test | p-value | |||
|---|---|---|---|---|---|
| CD | CF | ||||
| The running time (s) | 480×640 images | 5.68±0.07 | 1.73±0.05 | 110.38 | p <0.0001 |
| 576×768 images | 6.11±0.13 | 3.58±0.12 | 34.59 | p <0.0001 | |
| 1024×1360 images | 7.62±0.15 | 4.77±0.15 | 33.54 | p <0.0001 | |
| The detection rate (%) | Positive nuclei | 93.46±1.85 | 95.88±2.36 | −1.97 | 0.0763 |
| Negative nuclei | 35.88±4.93 | 82.37±3.57 | −18.70 | p <0.0001 | |
CD: the color deconvolution method; CF: the color-filtering method.
Moreover, we also listed the running time of the color-filtering and color deconvolution methods for IHC images with different resolutions in Table 1. The running time comparison shows that the proposed color-filtering method has less computational cost than the color deconvolution method for images with all resolutions. The gain is significant (p < 0.0001, independent two-sample t-test). And the low computational cost satisfies the demands of big data processing. The experiments have demonstrated that our color-filtering gains over the color deconvolution on the computation cost and the detection rate of nuclei.
3.3. Comparison with the pathological visual scoring
A tumor is scored as 0/1+ (negative), 2+ (equivocal), or 3+ (positive) based on the widely accepted visual scoring guidelines [1, 2]. Visual scoring is based on the percentage of the brown pixels (PR) or brown intensity. Percentage metric is as follows:
| (12) |
In our study, two pathologists visually scored the results. We evaluated the accuracy of the separation with the proposed color-filtering method using the percentages of the positive areas by comparing with the experts visual scoring. According to the percentages of the brown pixels extracted using the proposed color-filtering method, the images are scored as 0, 1+, 2+, and 3+ with Eq. (12). Thus, accuracy can be related to visual scores. The associative results are listed in Table 2. Furthermore, Fig. 9(A) shows the four representative images stained for Her2 with their visual scores ranging from 0 to 3; Fig. 9(B) shows a box and whisker graph that demonstrates the direct relationship with the percentages of the positive areas extracted using color-filtering and visual scoring. Interestingly, a high variability characterizes the middle of the scoring range (1 and 2) compared with the low and upper ends of the scoring categories. This result suggests that some cases at the middle of the scale are misclassified because of the effect of brown intensity. Other parameters should be investigated to test the brown intensity combined with the percentages of the brown pixels for quantitation. However, the majority of the cases from different scoring categories are grouped within the percentile of the positive area.
Table 2.
A comparison of image analysis methods
| Color-filtering | Visual Scoring | |||
|---|---|---|---|---|
| 0 | 1+ | 2+ | 3+ | |
| Accuracy (%) | 92% | 80% | 82% | 90% |
Fig. 9.
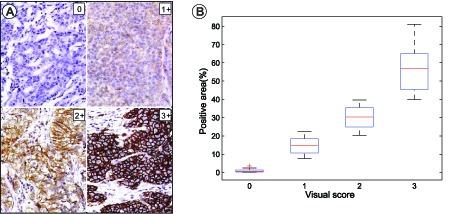
Comparison with the visual scoring. (A) four representative images stained for Her2 with visual scores ranging from 0–3; (B) a box and whiskers graph (median, 25% to 75% box range, min and max whiskers) representation of the percentile of the positive area shows a direct relationship with the categorical visual scores.
4. Conclusion
IHC has significant advantages for biomedical studies because this technique allows antigen-specific analysis during cancer treatment and disease progression. The quantitative analysis of IHC images via computer-aided methods is an emerging field. The quantitative information extracted from IHC images may be expressed in several ways, including percentages of positive stained area, intensity of brown stain in the positive areas, or either morphological characteristics. The digital separation of DAB-stained areas and hematoxylin-stained areas is a key step for IHC quantitation. In this paper, we presented an automatic color-filtering method to differentiate DAB-stained and hematoxylin-stained areas from the background staining levels. This research is essential to obtain a reliable and standardized method that can be used for further tissue segmentation and quantitative feature extracting. The proposed color-filtering method includes the use of brown and blue filters. The brown filter is used to extract DAB-stained tissues and the blue filter is used to extract hematoxylin-stained tissues. The experimental results have demonstrated that the proposed color-filtering method can automatically identify DAB-stained tissues without changing the color. In comparison to the color deconvolution method, the proposed color-filtering method costs less computation time and achieves more accurate detection ratio in terms of counting nuclei. The results also show that the percentages of the brown pixels obtained by color-filtering are directly related to the categorical visual scores (92% accuracy in 0 score, 80% accuracy in 1+ score, 82% accuracy in 2+ score, and 90% accuracy in 3+ score).
In conclusion, the proposed color-filtering method could significantly facilitate the quantitation of IHC with more robust pipeline and diagnostic tools. Our future work would focus on improving the computer scoring technique to quantitate and apply the proposed technique on different IHC slides.
Acknowledgments
This work was supported by the National Natural Science Foundation of China under grand (No. 61340006) and the Science and Technology Program of Guangdong Province of China under grant (No. 2013B040401008). The authors would like to thank Mr. Huang YE and his collaborators of NanFang Hospital of Guangzhou, Guangdong, China, for providing the images and as well as for the helpful discussion.
References and links
- 1.Taylor C. R., “Immunohistochemistry in surgical pathology: principles and practice,” Methods Mol. Biol. 1180, 81–109 (2014). 10.1007/978-1-4939-1050-2_5 [DOI] [PubMed] [Google Scholar]
- 2.Di Cataldo S., Ficarra E., Acquaviva A., Macii E., “Automated segmentation of tissue images for computerized IHC analysis,” Comput. Meth. Prog. Bio. 100, 1–15 (2010). 10.1016/j.cmpb.2010.02.002 [DOI] [PubMed] [Google Scholar]
- 3.Wolff A. C., Hammond M. E., Schwartz J. N., Hagerty K. L., Allred D. C., Cote R. J., Dowsett M., Fitzgibbons P. L., Hanna W. M., Langer A., McShane L. M., Paik S., Pegram M. D., Perez E. A., Press M. F., Rhodes A., Sturgeon C., Taube S. E., Tubbs R., Vance G. H., van de Vijver M., Wheeler T. M., Hayes D. F., “American Society of Clinical Oncology/College of American Pathologists guideline recommendations for human epidermal growth factor receptor 2 testing in breast cancer,” J. Clin. Oncol. 25, 118–145 (2007). 10.1200/JCO.2006.09.2775 [DOI] [PubMed] [Google Scholar]
- 4.Varghese F., Bukhari A. B., Malhotra R., De A., “IHC Profiler: an open source plugin for the quantitative evaluation and automated scoring of immunohistochemistry images of human tissue samples,” PLoS One 9, e96801 (2014). 10.1371/journal.pone.0096801 [DOI] [PMC free article] [PubMed] [Google Scholar]
- 5.Tuominen V. J., Tolonen T. T., Isola J., “ImmunoMembrane: a publicly available web application for digital image analysis of HER2 immunohistochemistry,” Histopathology 60, 758–767 (2012). 10.1111/j.1365-2559.2011.04142.x [DOI] [PubMed] [Google Scholar]
- 6.Reyes-Aldasoro C. C., Williams L. J., Akerman S., Kanthou C., Tozer G. M., “An automatic algorithm for the segmentation and morphological analysis of microvessels in immunostained histological tumour sections,” J. Microsc. 242, 262–278 (2011). 10.1111/j.1365-2818.2010.03464.x [DOI] [PubMed] [Google Scholar]
- 7.Slodkowska J., Filas V., Buszkiewicz E., Trzeciak P., Wojciechowski M., Koktysz R., Staniszewski W., Breborowicz J., Rojo M. G., “Study on breast carcinoma Her2/neu and hormonal receptors status assessed by automated images analysis systems: ACIS III (Dako) and ScanScope (Aperio),” Folia Histochem. Cyto. 48, 19–25 (2010). [DOI] [PubMed] [Google Scholar]
- 8.Wang C. W., Fennell D., Paul I., Savage K., Hamilton P., “Robust automated tumour segmentation on histological and immunohistochemical tissue images,” PLoS One 6, e15818 (2011). 10.1371/journal.pone.0015818 [DOI] [PMC free article] [PubMed] [Google Scholar]
- 9.Brügmann A., Eld M., Lelkaitis G., Nielsen S., Grunkin M., Hansen J. D., Foged N. T., Vyberg M., “Digital image analysis of membrane connectivity is a robust measure of HER2 immunostains,” Breast Cancer Res. Tr. 132, 41–49 (2012). 10.1007/s10549-011-1514-2 [DOI] [PubMed] [Google Scholar]
- 10.Pham N. A., Morrison A., Schwock J., Aviel-Ronen S., Iakovlev V., Tsao M. S., Ho J., Hedley D. W., “Quantitative image analysis of immunohistochemical stains using a CMYK color model,” Diagn. Pathol. 2, 8 (2007). 10.1186/1746-1596-2-8 [DOI] [PMC free article] [PubMed] [Google Scholar]
- 11.Ruifrok A. C., Katz R. L., Johnston D. A., “Comparison of quantification of histochemical staining by hue-saturation-intensity (HSI) transformation and color-deconvolution,” Appl. Immunohisto. M. M. 11, 85–91 (2003). 10.1097/00129039-200303000-00014 [DOI] [PubMed] [Google Scholar]
- 12.Brey E. M., Lalani Z., Johnston C., Wong M., McIntire L. V., Duke P. J., Patrick C. J., “Automated selection of DAB-labeled tissue for immunohistochemical quantification,” J. Histochem. Cytochem. 51, 575–584 (2003). 10.1177/002215540305100503 [DOI] [PubMed] [Google Scholar]
- 13.Ruifrok A. C., Johnston D. A., “Quantification of histochemical staining by color deconvolution,” Anal. Quant. Cytol. 23, 291–299 (2001). [PubMed] [Google Scholar]
- 14.Di Cataldo S., Ficarra E., Macii E., “Computer-aided techniques for chromogenic immunohistochemistry: status and directions,” Comput. Biol. Med. 42, 1012–1025 (2012). 10.1016/j.compbiomed.2012.08.004 [DOI] [PubMed] [Google Scholar]
- 15.Tadrous P. J., “Digital stain separation for histological images,” J. Microsc. 240, 164–172 (2010). 10.1111/j.1365-2818.2010.03390.x [DOI] [PubMed] [Google Scholar]
- 16.Oswal V., Belle A., Diegelmann R., Najarian K., “An entropy-based automated cell nuclei segmentation and quantification: application in analysis of wound healing process,” Comput. Math. Method. M. 2013, 592790 (2013). [DOI] [PMC free article] [PubMed] [Google Scholar]
- 17.Zhang L., Kong H., Chin C. T., Wang T., Chen S., “Cytoplasm segmentation on cervical cell images using graph cut-based approach,” Biomed. Mater. Eng. 24, 1125–1131 (2014). [DOI] [PubMed] [Google Scholar]
- 18.Ivanovici M., Stoica D., “Color diffusion model for active contours - an application to skin lesion segmentation,” in Proceeding of IEEE EMBS, 2012, pp. 5347–5350. [DOI] [PubMed] [Google Scholar]
- 19.CIE, Commission international de l’Eclairage proceedings. , Cambridge: Cambridge University Press; (1931). http://www.cie.co.at/cie/. [Google Scholar]
- 20.He X., Liu W., Li X., Li Q., Liu F., Rauh V. A., Yin D., Bansal R., Duan Y., Kangarlu A., Peterson B. S., Xu D., “Automated assessment of the quality of diffusion tensor imaging data using color cast of color-encoded fractional anisotropy images,” Magn. Reson. Imaging 32, 446–456 (2014). 10.1016/j.mri.2014.01.013 [DOI] [PMC free article] [PubMed] [Google Scholar]
- 21.Ficarra E., Di Cataldo S., Acquaviva A., Macii E., “Automated segmentation of cells with IHC membrane staining,” IEEE Trans. Biomed. Eng. 58, 1421–1429 (2011). 10.1109/TBME.2011.2106499 [DOI] [PubMed] [Google Scholar]


