Abstract
Osteoarthritis (OA) restricts the daily activities of patients and significantly decreases their quality of life. The development of non-invasive quantitative methods for properly diagnosing and evaluating the process of degeneration of articular cartilage due to OA is essential. Second harmonic generation (SHG) imaging enables the observation of collagen fibrils in live tissues or organs without staining. In the present study, we employed SHG imaging of the articular cartilage in OA model mice ex vivo. Consequently, three-dimensional SHG imaging with successive image processing and statistical analyses allowed us to successfully characterize histopathological changes in the articular cartilage consistently confirmed on histological analyses. The quantitative SHG imaging technique presented in this study constitutes a diagnostic application of this technology in the setting of OA.
OCIS codes: (170.3880) Medical and biological imaging, (190.0190) Nonlinear optics, (180.4315) Nonlinear microscopy, (100.6890) Three-dimensional image processing, (190.1900) Diagnostic applications of nonlinear optics, (170.6935) Tissue characterization, (170.4580) Optical diagnostics for medicine
1. Introduction
Osteoarthritis (OA) is defined as a group of mechanical abnormalities involving degradation of the articular cartilage and subchondral bone comprising the joints, the symptoms of which include joint pain and locomotive disability. OA is the most common form of arthritis and the leading cause of chronic disability [1–3]; hence, an increasing number of people are estimated to be affected by OA, especially in aged societies. This disorder potentially affects millions of individuals in some countries with older populations, including the United States and Japan, and the quality of life of these patients is significantly decreased. Pathophysiologically, with respect to the stages of OA progression, inapparent subtle biochemical changes in the cartilage matrix occur prior to gross cartilage loss, involving the disorganization and subsequent degeneration of Type II collagen fibers and loss of proteoglycan [4]. Commonly, the diagnosis of OA is made based on the patient’s history and findings of clinical examinations, X-rays and computed tomography (CT) and magnetic resonance imaging (MRI) scans. Typical features observed on X-ray and CT include joint space narrowing, morphological changes in the bone and ectopically formed calcified tissue. Although these imaging features provide useful diagnostic information, the detection of recognizable changes indicates a late stage of OA progression. While MRI can be used to detect degenerative changes in cartilage using enhancers [5], it is difficult to completely distinguish such cartilage from normal cartilage due to the lack of specificity of the enhancers. Therefore, it would be ideal to develop a non-invasive diagnostic method for detecting the initial symptom of OA, including degeneration of the cartilage matrix and pathological changes in other connective tissues.
Optical imaging techniques are promising tools for determining the clinical diagnosis of OA with minimal invasiveness. Recently, the application of second harmonic generation (SHG) imaging of the articular cartilage using multi-photon excited microscopy has been reported. Principally, SHG imaging makes it possible to observe noncentrosymmetric molecular assemblies, such as collagen fibers, in cartilage and bone tissues without staining. The acquired signal reflects the localization and amount of fibrous structures of the collagen molecule. Therefore, it is proposed that SHG imaging enables the clinician to detect both quantitative and qualitative changes in the cartilage matrix at a microscopic resolution [6–13]. Several animal OA models, including histopathological assessments of their osteoarthritic processes, are well established [14–17]. However, quantitative SHG imaging for the detection of histopathological changes due to OA is not well established.
In the present study, in order to establish a novel diagnostic tool for OA, we applied SHG and two-photon excited fluorescence (TPEF) imaging of the articular cartilage ex vivo in order to quantitatively evaluate degenerative changes in a mouse OA model. Successive three-dimensional image processing and statistical analyses successfully demonstrated critical changes in the collagen patterns in the affected joints that were concomitantly confirmed on histopathological observations.
2. Materials and methods
2.1 Animals and surgical induction of osteoarthritis (OA)
All experimental protocols were approved by the Ethics Committee for Animal Experiments of Ehime University (#05-RE-1-16). Male H2B-GFP mice, which ubiquitously express EGFP (enhanced green fluorescent protein) in the cell nucleus were provided by Dr. Toshihiko Fujimori (NIBB, Japan) [18] and employed to generate an OA model (n = 8, 8-10 weeks of age). For surgical induction of OA, the knee joints of the H2B-GFP line mice were carefully exposed under general anesthesia (Isoflurane, Escain, 871114, Mylan, Osaka, Japan). The patellar ligament, anterior/posterior cruciate ligaments and medial/lateral collateral ligaments were subsequently transected and the medial/lateral menisci were removed as previously described [19]. The skin incision was then closed (OA side), and the contralateral knee was exposed, after which the skin incision was closed (control side). The mice were sacrificed via cervical dislocation and the femurs were harvested at eight weeks after the surgery, followed by multi-photon excited microscopy and histological assessments. The male C57BL/6 mice were also examined for age-related changes in their articular cartilage (n = 6, 3 months of age; n = 6, 25 months of age). Finally, the mice were sacrificed via cervical dislocation. The femurs were harvested at 3 and 25 months of age and fixed in 10% formalin prior to the SHG imaging analysis.
2.2 Multi-photon excited microscopy
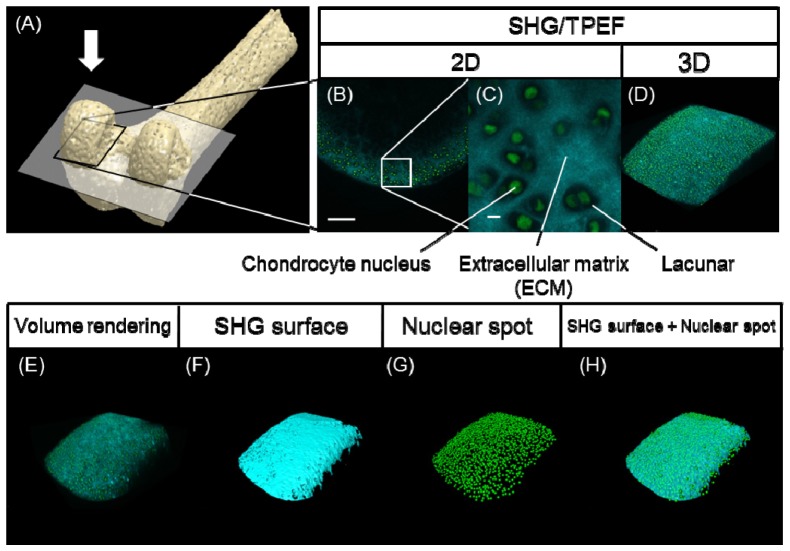
An upright multi-photon excited microscopy system (A1RMP, Nikon Corporation, Japan) was employed for image acquisition based on the detection of SHG and two-photon excited fluorescence signals from the articular cartilage. The detailed specifications of the microscope system are described elsewhere [20,21]. In brief, a multi-photon excited microscope equipped with a water-immersion objective lens (CFI75 Apo 25xW MP, numerical aperture: 1.1, Nikon) and Ti:Sapphire laser oscillator (wavelength: 680-950 nm; repetition rate: 80 MHz, pulse width: 70 fs; MaiTai eHP, Spectra-Physics, Inc. CA) was employed. The excised femurs were embedded in agarose gel and the medial condyle was exposed under the objective lens of the multi-photon excited microscopy system (Fig. 1(A) ). All image acquisition procedures were performed at an excitation wavelength of 900 nm. For observation of the H2B-GFP mice, a dichroic mirror at 458 nm and an emission filter at 440/40 nm (center wavelength/bandwidth) were applied to isolate the SHG signal and a bandpass filter at 525/50 nm was used to obtain the fluorescence signal of EGFP with an excitation wavelength of 900 nm. For observation of the C57BL/6 mice, the dichroic mirror at 458 nm and the emission filter at 440/40 nm (center wavelength/bandwidth) were employed to obtain the SHG signal with an excitation wavelength of 900 nm. The images were obtained from the surface of the cartilage tissue to the deep portion (around 100 µm in depth) and stored as z-stack image sequences (step size of 1 μm in the z-axis). The acquired image size was 512 x 512 pixels, and the pixel size was 0.99 μm/pixel. The image acquisition time was 1 frame/sec for each experiment. Simple image processing, i.e. merging color channels and three-dimensional (3D) rendering, was performed using the NIS-Elements ver. 4.0 software package (Nikon).
Fig. 1.
(A) Schematic illustration of the distal femur. The articular cartilage in the medial condyle framed by a black rectangle was observed on SHG/two-photon excited fluorescence (TPEF) imaging from the direction of the white arrow. (B) A snapshot (two-dimensional; 2D) image of the normal articular cartilage in a H2B-GFP mouse, scale bar: 100 μm. (C) A magnified view of the region of interest (ROI) framed by the white box in (B), scale bar: 10 μm. (D) Volume rendering (three-dimensional; 3D image) of the z-stack image sequence. The SHG image channel (cyan) and TPEF of the GFP image channel (green) were merged in (B)-(D). (E) Raw images obtained after volume rendering of the SHG and GFP signals. (F) SHG surface image constructed according to the SHG images. (G) Nuclear spot image constructed according to the TPEF image of GFP. (H) Merged image of (F) and (G).
2.3 Quantitative image analyses
The image analyses were carried out using IMARIS (IMARIS ver.6.3.0, Bitplane AG, Switzerland), a 3D/4D image processing software program. Surface rendering of the SHG images and spot detection of the cell nuclei on the GFP images were performed with arbitrarily selected threshold values. For the statistical analyses, the standard deviation (SD) and coefficient of variation (CV) of the SHG signal intensity within the rendered region of the SHG image were calculated. A hierarchical cluster analysis (HCA) was applied to the specimen data sets of the statistics. The analysis was performed using the MATLAB software program (MathWorks Inc. MA) with the “cluster” function.
2.4 Histological examination
Following image acquisition, the femurs were fixed with 10% formalin in phosphate-buffered saline (PBS, pH 7.4). The specimens were decalcified with 10% ethylenediaminetetraacetic acid (EDTA, pH 7.4) at room temperature for two weeks, and subsequently embedded in paraffin then cut into 4-μm coronal sections and subjected to Hematoxylin and Eosin (HE), Safranin-O-fast green (SO) and Elastica Masson-Goldner (EMG) stainings for the histological study. SHG images and differential interference contrast (DIC) images of the sections were captured using the multi-photon excited microscope and a wide-field upright fluorescence microscope (PlanApo 10x/NA: 0.45, ECLIPSE 80i, Nikon), respectively.
3. Results
In order to evaluate the process of degeneration of the articular cartilage in the mouse osteoarthritis (OA) model, we first surgically induced OA in the knee joints of the H2B-GFP mice and then performed combined ex vivo imaging with SHG and two-photon excited fluorescence (TPEF) of the cartilage tissues dissected from the mice using a multi-photon excited microscope. Figure 1 outlines the analytical procedure for imaging and successive image processing (Fig. 1(A)-1(D)).
Figures 1(B) to 1(D) show representative images of normal cartilage tissue. The two-dimensional (2D) images successfully visualized the histological structures of the articular cartilage, on which chondrocytic lacunae surrounded by the extracellular matrix and the nuclei of the chondrocytes were detected based on the SHG signals and GFP signals, respectively. Three-dimensional (3D) reconstitution (volume rendering) of the obtained images demonstrated the surface shape of the articular cartilage in addition to the distribution patterns of collagen fibers and chondrocytic nuclei (Fig. 1(D)). The reconstructed images were subjected to image processing analyses, including SHG signal-based surface rendering (SHG surface) and spot rendering of cellular nuclei, as illuminated by the GFP signals (nuclear spots) (Fig. 1(E)-1(H)).
We developed and analyzed a total of eight specimens for the H2B-GFP mouse OA model. The incidence of symptomatic knee osteoarthritis was confirmed prior to the microscopic observation using several types of conventional analyses. The passive range of motion in the operated (OA side) knees was decreased eight weeks after surgery in comparison with that observed in the contralateral (control side) knees, and several of the OA model mice exhibited osteophyte formation in the posterior region of the joints and sclerotic changes in the subchondral bone of the tibia plateau on X-ray images (data not shown). The femurs were subsequently harvested and the articular surface was observed macroscopically, although we did not observe any remarkable differences between the OA side and control side (data not shown) under bright-field microscopy.
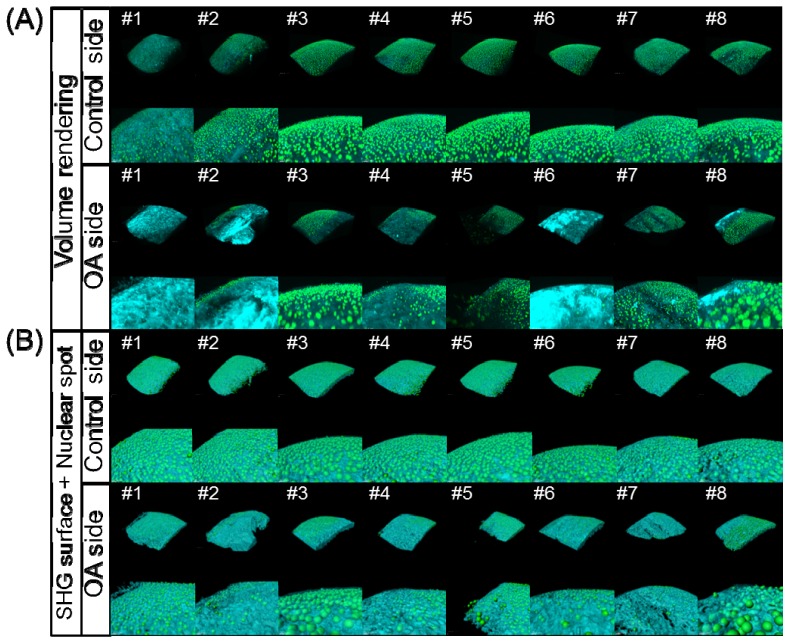
The excised femurs were then subjected to SHG and TPEF imaging analyses. Figure 2 shows the results of the image acquisition and processing of the articular cartilage in the OA model mice. On the control side, the surface features were largely smooth and the intensity distribution of the SHG signals was homogeneous. In contrast, on the OA side, the surface features and uniformity of signal intensity were obviously absent, and the number of nuclear spots was decreased compared to that seen on the control side. For example, on the volume rendering images for samples #1, #2, #6 and #8, the SHG signals were observed to be relatively strong in some parts on the OA side (Fig. 2(A)), whereas the surface of the OA articular cartilage was relatively rough on the SHG surface and nuclear spot images as a whole (Fig. 2(B)). Furthermore, in some specimens (see #3, #5 and #8), chondrocytes were exposed on the cartilaginous surface. These findings reflect typical features of cartilage degeneration.
Fig. 2.
Results of the 3D image processing of the acquired SHG/TPEF images in the medial condyle of the femur in the OA model mice. (A) Volume rendering images on the control side (upper two columns, overall view and magnified view) and OA side (lower two columns, overall view and magnified view). (B) Merged images of the SHG surface and nuclear spot images on the control side (upper two columns, overall view and magnified view) and OA side (lower two columns, overall view and magnified view).
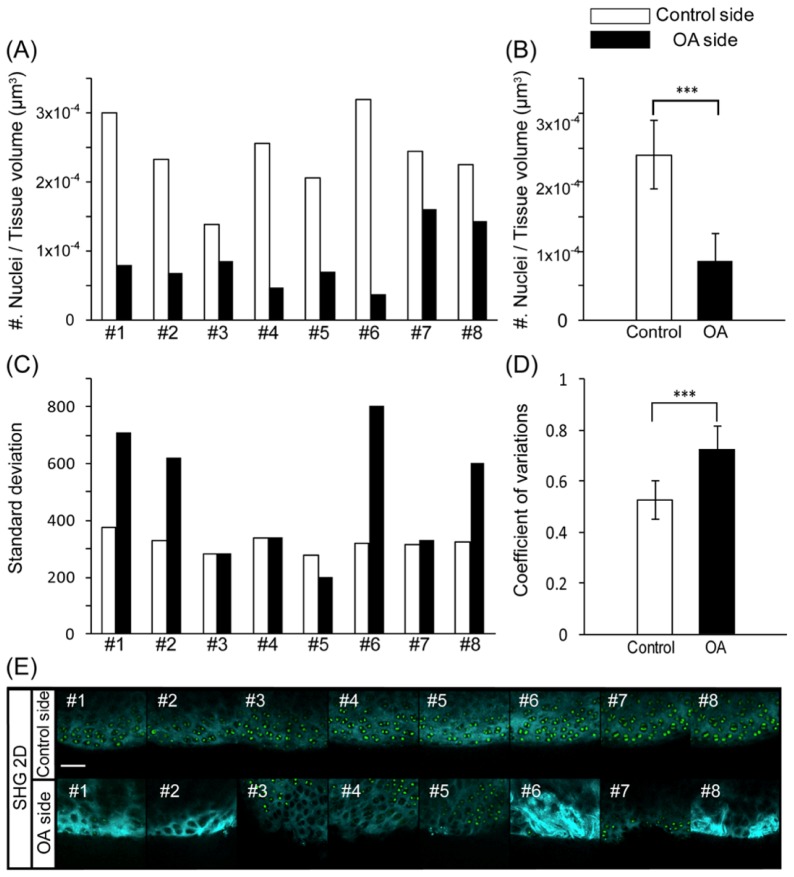
Since the apparent changes on the SHG and TPEF images in the OA model may be related to the effects of degenerative processes in the articular cartilage, we subsequently performed quantitative analyses of the SHG surface images and nuclear spot images for the individual data sets. In order to confirm whether the number of chondrocytes per unit volume differed between the control and OA sides, the total number of nuclear spots was counted and normalized according to the total tissue volume enclosed by the SHG surface within the same region of interest (ROI). Figure 3 (A) shows the number of nuclei per tissue volume for each sample in the control and OA groups. In all samples, the number of nuclei was lower on the OA side than on the control side (Fig. 3(A)). Based on the statistical analysis, the number of nuclei was significantly decreased on the OA side versus the control side (Fig. 3(B)). These findings were consistent with the features observed on the SHG and TPEF images (Fig. 3(E)). Next, in order to quantify the heterogeneity of the SHG surface features according to the 3D distribution of the SHG signal intensity, we calculated the standard deviation (SD) of the SHG signal intensity for each of the z-stack images and compared the values for the OA and control sides. In several specimens, including those for #1, #2, #6 and #8, the SD values were apparently larger on the OA side than on the control side (Fig. 3(C)). Comparing the scores with the snapshots of the corresponding SHG images for #1, #2, #6 and #8, the SHG signals on the OA side appeared to be highly heterogeneous, with locally intensified signals in some parts of the ROI (Fig. 3(C), 3(E)). Statistically, the coefficient of variation (CV) was significantly larger for the OA side than for the control side (Fig. 3(D)).
Fig. 3.
(A) Number of chondrocyte nuclei per tissue volume for each sample in the control and OA groups. (B) Average number of chondrocyte nuclei per tissue volume in the control and OA groups. ***p<0.001 according to Student’s t-test. (C) Standard deviation (SD) of the SHG signal intensity for each sample in the control and OA groups. (D) Average coefficient of variation (CV) for the SHG signal intensity. ***p<0.001 according to Student’s t-test. (E) Snapshot 2D SHG/TPEF images of the medial condyle of the femur on the control side (upper panel) and OA side (lower panel), scale bar: 50 μm.
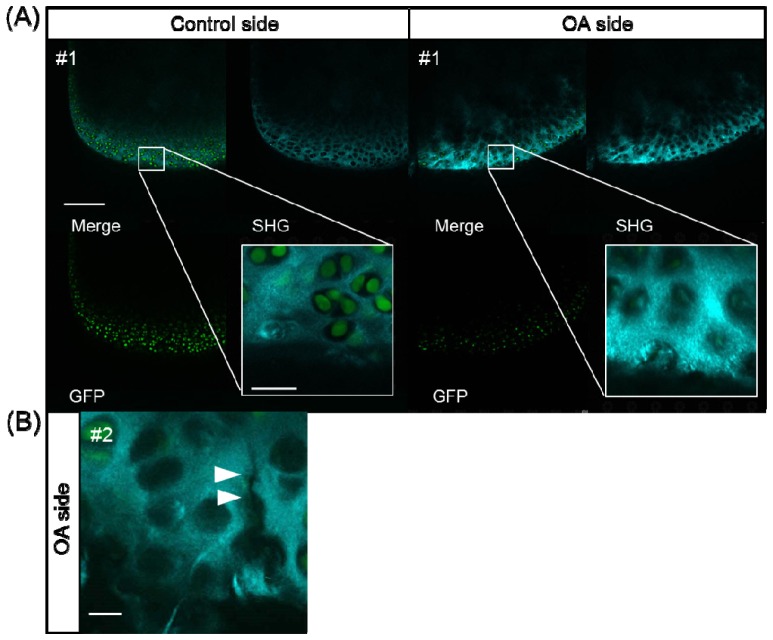
In addition to the results of the quantitative analyses conducted using 3D image processing described above, the use of a magnified view of single optical sections revealed characteristic features of degenerative changes in the cartilage in the OA model. In some of the OA mice, a fibrous pattern of the extracellular matrix was obvious (Fig. 4(A) ) and micro-cracks in the cartilage were occasionally recognizable (Fig. 4(B)).
Fig. 4.
SHG/TPEF images of the medial condyle of the femur in the control and OA groups. (A) SHG image (upper right), TPEF of GFP image (lower left), merged image (upper left) and magnified image (white box). On the OA side, a fibrous pattern and empty lacunae were observed, scale bar: 25 μm. (B) Micro-cracks in the ECM (white arrows), scale bar: 10 μm.
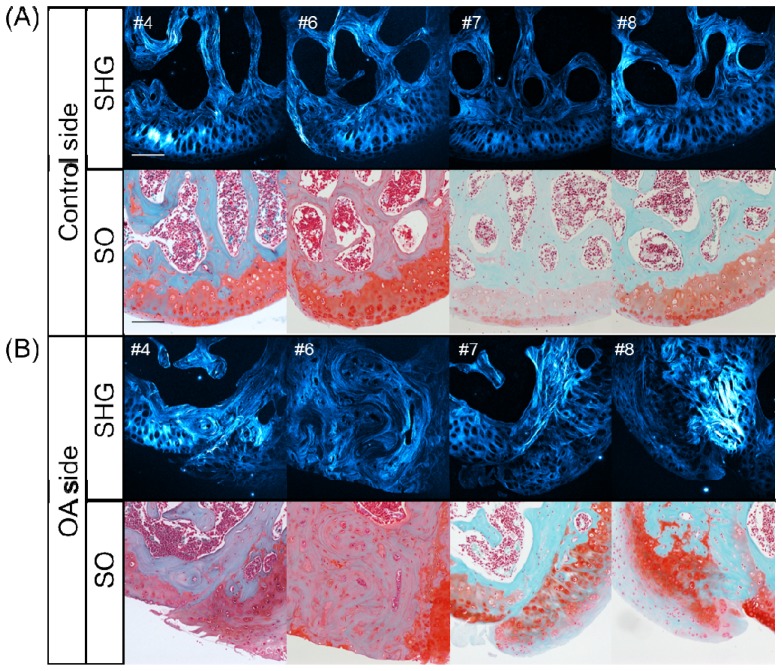
With the goal of associating the results of the SHG and TPEF imaging analyses described above with the histopathological changes noted in the OA model, histological sections were obtained for all specimens and their features were compared with the corresponding SHG patterns (Fig. 5 ). Figure 5 shows the results for Safranin-O-fast green (SO) staining and the SHG images of the tissue sections obtained from the representative OA model specimens (#4, #6, #7 and #8).
Fig. 5.
Histological examination of horizontal sections of the medial condyle in representative OA model mice. SHG images (upper column) and Safranin-O-fast green (SO) staining images (lower column), scale bar: 100 μm. (A) on the control side and (B) OA side in the #4, #6, #7 and #8 samples.
The comparison of SO staining and the SHG image features for the four sections on the control side showed a normal and intact tissue structure among the articular cartilage, indicating that the intense SHG signal was primarily due to the presence of a hypertrophic cartilaginous layer and subchondral bone (Fig. 5(A)). Meanwhile, a relatively low SHG signal was detected in the normal surface layer of the articular cartilage, and the bone marrow cavities and chondrocytic and osteocytic lacunae did not emit any SHG signals, thus presenting as dark holes.
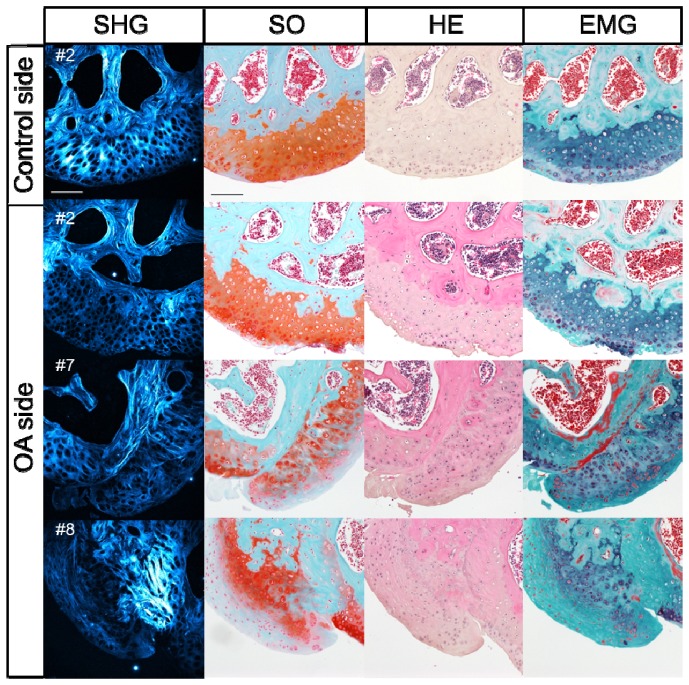
In contrast to the common features observed on the control side, the OA side exhibited various features with respect to the histological structure and related SHG patterns (Fig. 5 and Fig. 6 ). For example, on the #4 OA side, exposure of the hypertrophic layer and hyperplasia of amorphous hyaline cartilage were observed on SO staining and obviously visualized on the SHG images based on the detection of large lacunae (see left half of the ROI in Fig. 5 #4) and an amorphous collagenous pattern (see right half). The histological SO image for the #6 OA sample showed extensive exposure of the subchondral bone, as recognized according to the wavy pattern of the collagenous SHG signal, a typical feature of bone. In addition, the SO image for #7 demonstrated obvious degradation of the original cartilage and bone covered by hyperplastic tissue of mixed hyaline and fibrous cartilage. The fibrous cartilage was distinguishable as tissue with round-shaped chondrocytes encased in a matrix that was faintly stained on SO, thus exhibiting a blue color, while the hyaline cartilage was well stained in red on the SO images (Fig. 5(B) #7, lower panel). The characteristics of the fibrous cartilage were also defined and confirmed based on another histological assessment with Elastica Masson-Goldner (EMG) staining (Fig. 6). As was seen on the SO image for #7 OA, fibrous cartilage was also obviously recognizable as tissue with round-shaped lacunae surrounded by intense fibrous SHG signals and light blue staining by EMG. Accordingly, the images for #8 OA demonstrated degraded original hyaline cartilage and subchondral bone covered by hyperplastic fibrous cartilage.
Fig. 6.
Histological examination of the horizontal sections of the medial condyle in representative OA model mice. SHG images, Safranin-O-fast green (SO) staining images, Hematoxylin and Eosin (HE) staining images and Elastica Masson-Goldner (EMG) staining images on the control side for #2 and OA sides for the #2, #7 and #8 samples, respectively, scale bar: 100 μm.
Based on the results of the histological study described above, the degenerative changes in the articular cartilage observed in the surgically induced OA model were typically characterized by (1) hyperplasia of the hyaline cartilage, (2) hyperplasia of fibrous cartilage and (3) exposure of the subchondral bone (Fig. 5 and Fig. 6). The eight OA specimens were classified into three groups according to these histological features (Table 1 ). In order to examine possible correlations between the findings of the quantitative SHG imaging analysis and the histological classification, we conducted a cluster analysis of the SD of the SHG intensity (Fig. 7 ). Consequently, the statistical analyses classified eight specimens into two groups with relatively high (#1, #2, #6 and #8) and low (#3, #4, #5 and #7) SD values (Fig. 3(C)). The high-SD group was further subdivided into two groups (#1, #6 and #2, #8) (Fig. 7). It is noteworthy that these two subgroups matched completely with the histologically defined groups exhibiting (2) hyperplasia of fibrous cartilage and (3) exposure of the subchondral bone, respectively, while the low-SD group corresponded to the (1) hyperplasia of hyaline cartilage group (Fig. 7 and Table 1).
Table 1. Classification of degenerative changes in OA model based on quantitative SHG imaging.
| SD value | Hyperplasia of hyaline tissues | Hyperplasia of fibrous cartilage | Exposure of subchondral bone | Total |
|---|---|---|---|---|
| Low-SD group (#3,4,5,7) | 4 (#3,4,5,7) | 0 | 0 | 4 |
|
| ||||
| High-SD group (#1,2,6,8) | 0 | 2 (#2, 8) | 2 (#1, 6) | 4 |
Fig. 7.
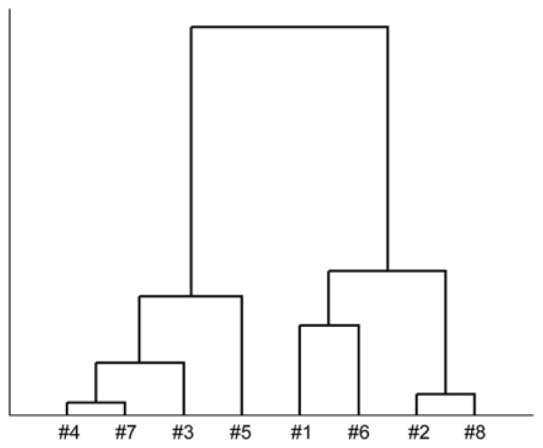
Hierarchical cluster analysis (HCA) of the SD on the OA side.
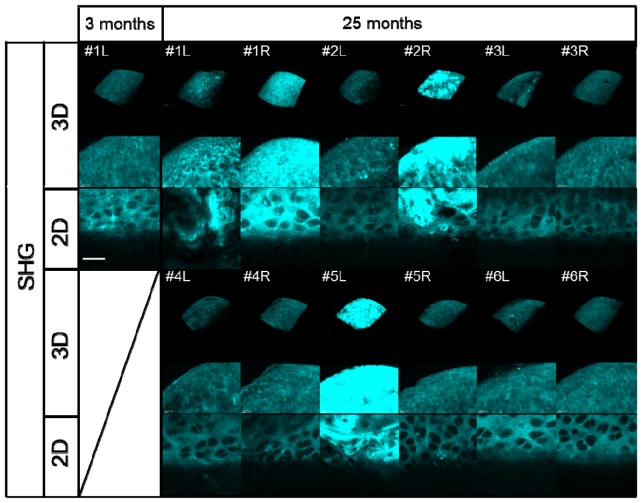
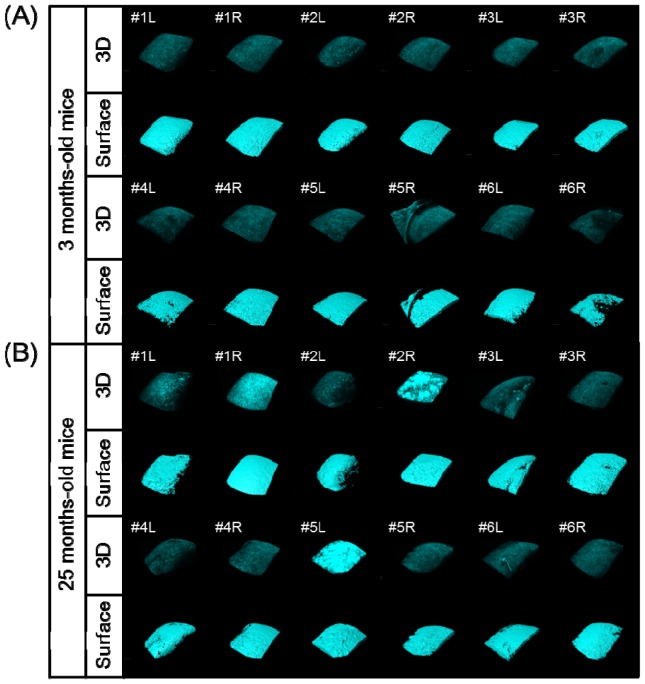
We next applied our quantitative SHG imaging protocol to the study of age-related changes in articular cartilage as a spontaneous OA model. Six elderly mice (25 months of age) and six young mice (3 months of age) were analyzed using 2D and 3D SHG imaging (Fig. 8 and Fig. 9 ). No obvious distinction between the young and aged knee joints was observed on bright-field microscopy (data not shown). In some cases, apparent irregular patterns on the SHG 3D surface images were noted in the aged specimens, such as those for #1L, #1R, #2R and #5L, compared to that seen in other specimens, including all of the young specimens, which appeared to be correlated with uniformity in the intensity of the SHG signal (Fig. 8 and Fig. 9).
Fig. 8.
Results of 3D/2D image processing of the acquired SHG images of the medial condyle of the femur in 3-month-old mice (left knee; L) and 25-month-old mice (left and right knee; L and R, respectively). The upper two panels show volume rendering (3D) SHG images and their magnification. The lower panels show snapshot (2D) SHG images, scale bar: 25 μm.
Fig. 9.
Results of 3D/2D image processing of the acquired SHG images and surface rendering of the medial condyle of the femur in the 3-month-old (A) and 25-month-old (B) mice (left and right knee; L and R, respectively).
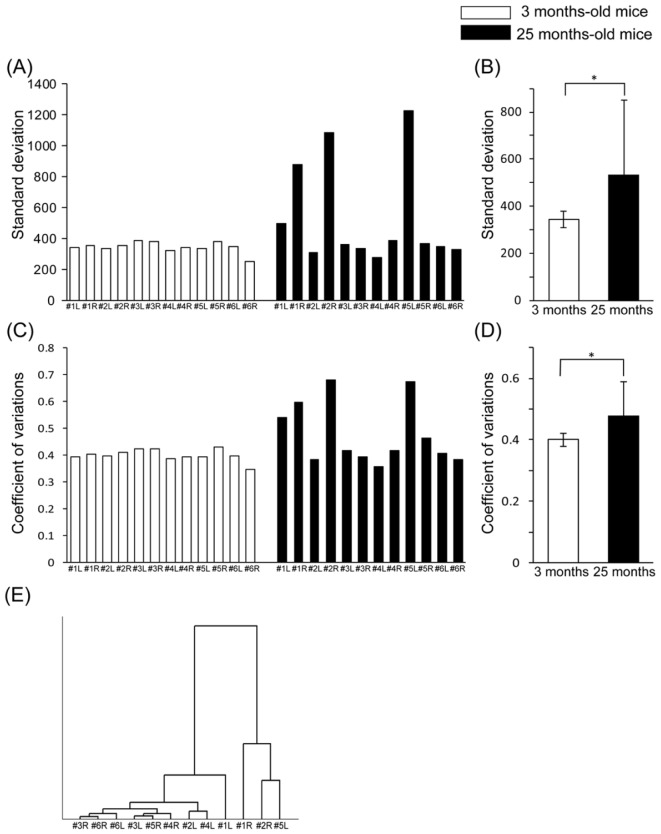
We then performed quantitative analyses of the obtained SHG images. The comparison of the SD values among the specimens showed distinctively higher scores for the #1L, #1R, #2R and #5L samples in the elderly mice (Fig. 10(A) ). Interestingly, these higher SD values were consistent with the abnormal appearance observed on the SHG images, as shown in Fig. 8. Statistically, the SD values were significantly different between the young and elderly mice (Fig. 10(B)). The CV values demonstrated a similar tendency to the SD values (Fig. 10(C), 10(D)).
Fig. 10.
(A) Standard deviation (SD) of the SHG signal intensity for each sample in the young (3 months of age) and elderly mice (25 months of age). (B) Average SD of the SHG signal intensity. *p<0.05 according to Student’s t-test. (C) Coefficient of variation (CV) for the SHG signal intensity in each sample in the young and elderly mice. (D) Average CV for the SHG signal intensity. *p<0.05 according to Student’s t-test. (E) Hierarchical cluster analysis (HCA) of the SD in the elderly mice.
4. Discussion
Taking advantage of SHG imaging, we applied 3D acquisition of the SHG signals originating from mouse articular cartilage ex vivo to successfully identify histopathological changes associated with degeneration in an osteoarthritis (OA) model. Moreover, according to assessments quantifying the SHG signal intensity as well as successive statistical analyses, statistical parameters, such as the standard deviation (SD) and coefficient of variation (CV), showed good correlation with the categorization of the histopathological features.
The most significant advantages of SHG imaging are its non-invasiveness, lack of need for staining and good tissue penetration, making this approach appropriate for assessing intact living tissues or organs. Because SHG signals are predominantly emitted from extracellular collagen fibrils [9], the features of acquired images of the SHG signal are postulated to directly reflect structural and compositional changes in the extracellular matrix [12]. In fact, our SHG observations of the knee joints described in this work successfully revealed findings of the tissue types of hyaline cartilage, fibrous cartilage and bone with an SHG texture pattern, lacunar shape and spatial distribution of lacunae that were consistently confirmed using well-established histological methods (Fig. 2 and Fig. 5). These findings suggest that the initial events of cartilage degeneration induced by OA [22–24] can be successfully characterized on SHG imaging (Fig. 2, 3(E) and Fig. 4).
The statistical analyses also demonstrated that the SD of the SHG signal intensity provides sufficient information regarding the heterogeneity of the signal distribution, which closely correlated with the histopathological changes observed in the OA model (Fig. 3(C), 3(D) and Table 1). Since the extracellular matrices of fibrous cartilage and bone primarily consist of type I collagen, which has a relatively strong SHG signal and thicker fibrous morphology than normal hyaline cartilage (Fig. 5 and Fig. 6) [8], the appearance of these fibrous tissues in imaged areas likely contributes to a heterogenic distribution of the signal intensity, thus resulting in relatively higher SD values. More interestingly, the results of the cluster analysis were also used to successfully classify the high-SD group into the two groups characterized by hyperplasia of fibrous cartilage and exposure of the subchondral bone (Table 1 and Fig. 7). These analytical results suggest that the SD of the SHG signal may be employed to discriminate between subtle distinct SHG patterns emitted from fibrous cartilage and subchondral bone.
These numerical findings indicate that the distribution pattern of the SHG signal intensity is a potential diagnostic index. In order to test this notion, we analyzed the knee joints of the age-related OA model mice using SHG imaging (Fig. 8, 9, and Fig. 10). Consequently, the SD values in some of the specimens from the elderly mice showed distinctively higher scores strongly associated with the histological changes observed on the 3D and 2D images; the CV values demonstrated the same tendency (Fig. 10). As a statistically valid criterion for quantifying the degree of heterogeneity of the signal distribution, we used the CV rather than SD (Fig. 3(D) and Fig. 10(D)). Using the CV values reduces the effects of differences in the average intensity among the specimens and enabled us to characterize the morphological changes in the OA model. Taken together, the quantitative analyses of the OA models suggest that static analyses of the distribution pattern of the SHG signal intensity yield diagnostic information reflecting the histopathological changes caused by OA.
In conclusion, multi-photon excited microscopy-based SHG imaging of the articular cartilage is an ideal imaging approach for characterizing the histopathological changes induced by OA in live tissue. In addition, quantitative and statistical analyses of the distribution pattern of the SHG intensity are useful for obtaining this histopathological information. Therefore, the approach using SHG imaging and successive statistical analyses described in this report constitutes a diagnostic application for detecting the initial symptom of OA, including degeneration of the cartilage matrix and pathological changes in other connective tissues.
Acknowledgments
The authors are grateful to Dr. Toshihiko Fujimori (NIBB, Japan) for providing the H2B-GFP line mice, Dr. Yoshitaka Shiraishi (Ehime University, Japan) for providing technical support and Dr. Tsutomu Hirata, Hiroko Ninomiya and Hiromi Yamamoto (Ehime University, Japan) for conducting the sample preparation for the histological study and providing assistance with mouse husbandry. The authors thank members of Nikon Corporation (Japan) for providing technical support of multi-photon microscopy. Funding for this work was supported by CREST JST (Japan Science and Technology), and MEXT KAKENHI Grant Number 22113004; JSPS KAKENHI Grant Numbers 23390368, 26670667, 24680060, and 26293392; and the JSPS Core-to-Core Program “Cooperative International Framework in TGF-β Family Signaling”. T. Im. and A. H. were supported by the Naito Foundation.
References and links
- 1.Akune T., Muraki S., Oka H., Tanaka S., Kawaguchi H., Tokimura F., Yoshida H., Suzuki T., Nakamura K., Yoshimura N., “Association of physical activities of daily living with the incidence of certified need of care in the long-term care insurance system of Japan: the ROAD study,” J. Orthop. Sci. 19(3), 489–496 (2014). 10.1007/s00776-014-0537-z [DOI] [PubMed] [Google Scholar]
- 2.McAlindon T. E., Bannuru R. R., Sullivan M. C., Arden N. K., Berenbaum F., Bierma-Zeinstra S. M., Hawker G. A., Henrotin Y., Hunter D. J., Kawaguchi H., Kwoh K., Lohmander S., Rannou F., Roos E. M., Underwood M., “OARSI guidelines for the non-surgical management of knee osteoarthritis,” Osteoarthritis and cartilage / OARS, Osteoarthritis Research Society 22(3), 363–388 (2014). 10.1016/j.joca.2014.01.003 [DOI] [PubMed] [Google Scholar]
- 3.Zhang W., Moskowitz R. W., Nuki G., Abramson S., Altman R. D., Arden N., Bierma-Zeinstra S., Brandt K. D., Croft P., Doherty M., Dougados M., Hochberg M., Hunter D. J., Kwoh K., Lohmander L. S., Tugwell P., “OARSI recommendations for the management of hip and knee osteoarthritis, Part II: OARSI evidence-based, expert consensus guidelines,” Osteoarthritis and cartilage / OARS, Osteoarthritis Research Society 16(2), 137–162 (2008). 10.1016/j.joca.2007.12.013 [DOI] [PubMed] [Google Scholar]
- 4.Pritzker K. P., Gay S., Jimenez S. A., Ostergaard K., Pelletier J. P., Revell P. A., Salter D., van den Berg W. B., “Osteoarthritis cartilage histopathology: grading and staging,” Osteoarthritis and cartilage / OARS, Osteoarthritis Research Society 14, 13–29 (2006). 10.1016/j.joca.2005.07.014 [DOI] [PubMed] [Google Scholar]
- 5.Nissi M. J., Töyräs J., Laasanen M. S., Rieppo J., Saarakkala S., Lappalainen R., Jurvelin J. S., Nieminen M. T., “Proteoglycan and collagen sensitive MRI evaluation of normal and degenerated articular cartilage,” J. Orthop. Res. 22(3), 557–564 (2004). 10.1016/j.orthres.2003.09.008 [DOI] [PubMed] [Google Scholar]
- 6.Légaré F., Pfeffer C., Olsen B. R., “The role of backscattering in SHG tissue imaging,” Biophys. J. 93(4), 1312–1320 (2007). 10.1529/biophysj.106.100586 [DOI] [PMC free article] [PubMed] [Google Scholar]
- 7.González S., Fragoso-Soriano R. J., Kouri J. B., “Chondrocytes interconnecting tracks and cytoplasmic projections observed within the superficial zone of normal human articular cartilage--a transmission electron microscopy, atomic force microscopy, and two-photon excitation microscopy studies,” Microsc. Res. Tech. 70(12), 1072–1078 (2007). 10.1002/jemt.20516 [DOI] [PubMed] [Google Scholar]
- 8.Lutz V., Sattler M., Gallinat S., Wenck H., Poertner R., Fischer F., “Characterization of fibrillar collagen types using multi-dimensional multiphoton laser scanning microscopy,” Int. J. Cosmet. Sci. 34(2), 209–215 (2012). 10.1111/j.1468-2494.2012.00705.x [DOI] [PubMed] [Google Scholar]
- 9.Filova E., Burdikova Z., Rampichova M., Bianchini P., Capek M., Kostakova E., Amler E., Kubinova L., “Analysis and three-dimensional visualization of collagen in artificial scaffolds using nonlinear microscopy techniques,” J. Biomed. Opt. 15(6), 066011 (2010). 10.1117/1.3509112 [DOI] [PubMed] [Google Scholar]
- 10.Mansfield J. C., Winlove C. P., “A multi-modal multiphoton investigation of microstructure in the deep zone and calcified cartilage,” J. Anat. 220(4), 405–416 (2012). 10.1111/j.1469-7580.2012.01479.x [DOI] [PMC free article] [PubMed] [Google Scholar]
- 11.Brown C. P., Houle M. A., Chen M., Price A. J., Légaré F., Gill H. S., “Damage initiation and progression in the cartilage surface probed by nonlinear optical microscopy,” J. Mech. Behav. Biomed. Mater. 5(1), 62–70 (2012). 10.1016/j.jmbbm.2011.08.004 [DOI] [PubMed] [Google Scholar]
- 12.Werkmeister E., de Isla N., Netter P., Stoltz J. F., Dumas D., “Collagenous Extracellular Matrix of Cartilage Submitted to Mechanical Forces Studied by Second Harmonic Generation Microscopy,” Photochem. Photobiol. 86(2), 302–310 (2010). 10.1111/j.1751-1097.2009.00648.x [DOI] [PubMed] [Google Scholar]
- 13.Mansfield J., Yu J., Attenburrow D., Moger J., Tirlapur U., Urban J., Cui Z., Winlove P., “The elastin network: its relationship with collagen and cells in articular cartilage as visualized by multiphoton microscopy,” J. Anat. 215(6), 682–691 (2009). 10.1111/j.1469-7580.2009.01149.x [DOI] [PMC free article] [PubMed] [Google Scholar]
- 14.van der Kraan P. M., Vitters E. L., van Beuningen H. M., van de Putte L. B., van den Berg W. B., “Degenerative knee joint lesions in mice after a single intra-articular collagenase injection. A new model of osteoarthritis,” J. Exp. Pathol. (Oxford) 71(1), 19–31 (1990). [PMC free article] [PubMed] [Google Scholar]
- 15.Panula H. E., Hyttinen M. M., Arokoski J. P. A., Långsjö T. K., Pelttari A., Kiviranta I., Helminen H. J., “Articular cartilage superficial zone collagen birefringence reduced and cartilage thickness increased before surface fibrillation in experimental osteoarthritis,” Ann. Rheum. Dis. 57(4), 237–245 (1998). 10.1136/ard.57.4.237 [DOI] [PMC free article] [PubMed] [Google Scholar]
- 16.Glasson S. S., Blanchet T. J., Morris E. A., “The surgical destabilization of the medial meniscus (DMM) model of osteoarthritis in the 129/SvEv mouse,” Osteoarthritis and cartilage / OARS, Osteoarthritis Research Society 15(9), 1061–1069 (2007). 10.1016/j.joca.2007.03.006 [DOI] [PubMed] [Google Scholar]
- 17.Longo U. G., Loppini M., Fumo C., Rizzello G., Khan W. S., Maffulli N., Denaro V., “Osteoarthritis: New Insights in Animal Models,” Open Orthop. J. 6(1), 558–563 (2012). 10.2174/1874325001206010558 [DOI] [PMC free article] [PubMed] [Google Scholar]
- 18.Kurotaki Y., Hatta K., Nakao K., Nabeshima Y., Fujimori T., “Blastocyst axis is specified independently of early cell lineage but aligns with the ZP shape,” Science 316(5825), 719–723 (2007). 10.1126/science.1138591 [DOI] [PubMed] [Google Scholar]
- 19.Kamekura S., Hoshi K., Shimoaka T., Chung U., Chikuda H., Yamada T., Uchida M., Ogata N., Seichi A., Nakamura K., Kawaguchi H., “Osteoarthritis development in novel experimental mouse models induced by knee joint instability,” Osteoarthritis and cartilage / OARS, Osteoarthritis Research Society 13(7), 632–641 (2005). 10.1016/j.joca.2005.03.004 [DOI] [PubMed] [Google Scholar]
- 20.Koga S., Oshima Y., Honkura N., Iimura T., Kameda K., Sato K., Yoshida M., Yamamoto Y., Watanabe Y., Hikita A., Imamura T., “In vivo subcellular imaging of tumors in mouse models using a fluorophore-conjugated anti-carcinoembryonic antigen antibody in two-photon excitation microscopy,” Cancer Sci. 105(10), 1299–1306 (2014). 10.1111/cas.12500 [DOI] [PMC free article] [PubMed] [Google Scholar]
- 21.Oshima Y., Horiuch H., Honkura N., Hikita A., Ogata T., Miura H., Imamura T., “Intravital multiphoton fluorescence imaging and optical manipulation of spinal cord in mice, using a compact fiber laser system,” Lasers Surg. Med. 46(7), 563–572 (2014). 10.1002/lsm.22266 [DOI] [PubMed] [Google Scholar]
- 22.Tew S. R., Kwan A. P., Hann A., Thomson B. M., Archer C. W., “The reactions of articular cartilage to experimental wounding: role of apoptosis,” Arthritis Rheum. 43(1), 215–225 (2000). [DOI] [PubMed] [Google Scholar]
- 23.Eltawil N. M., De Bari C., Achan P., Pitzalis C., Dell’accio F., “A novel in vivo murine model of cartilage regeneration. Age and strain-dependent outcome after joint surface injury,” Osteoarthritis and cartilage / OARS, Osteoarthritis Research Society 17(6), 695–704 (2009). 10.1016/j.joca.2008.11.003 [DOI] [PMC free article] [PubMed] [Google Scholar]
- 24.Sherwood J. C., Bertrand J., Eldridge S. E., Dell’Accio F., “Cellular and molecular mechanisms of cartilage damage and repair,” Drug Discov. Today 19(8), 1172–1177 (2014). 10.1016/j.drudis.2014.05.014 [DOI] [PubMed] [Google Scholar]


