

Abstract
Epidermal growth factor receptor (EGFR) signaling is a potent driver of glioblastoma, a malignant and lethal form of brain cancer. Disappointingly, inhibitors targeting receptor tyrosine kinase activity are not clinically effective, and EGFR persists on the plasma membrane to maintain tumor growth and invasiveness. Here we show that endolysosomal pH is critical for receptor sorting and turnover. By functioning as a leak pathway for protons, the Na+/H+ exchanger NHE9 limits luminal acidification to circumvent EGFR turnover and prolong downstream signaling pathways that drive tumor growth and migration. In glioblastoma, NHE9 expression is associated with stem/progenitor characteristics, radiochemoresistance, poor prognosis and invasive growth in vitro and in vivo. Silencing or inhibition of NHE9 in brain tumor initiating cells attenuates tumorsphere formation and improves efficacy of EGFR inhibitor. Thus, NHE9 mediates inside-out control of oncogenic signaling and is a highly druggable target for pan-specific receptor clearance in cancer therapy.
Keywords: Glioblastoma, stem cells, Na+/H+ exchanger, EGFR, transferrin receptor, trafficking, NHE9, SLC9A9, pH, sorting endosomes
Glioblastoma multiforme (GBM) is the most common and aggressive form of adult primary brain tumor with extremely poor prognosis 1,2. Diffuse invasion of tumor cells into the surrounding brain parenchyma makes surgical resection largely ineffective and the pluripotent behavior of a small group of brain tumor-initiating cells (BTIC) in GBM confers drug resistance and recurrence even after aggressive treatment3-5. As a result, clinical outcomes of patients have failed to show substantive improvement over median survival times of 12 months, and innovative approaches to therapy are urgently needed5. The key step in moving towards personalized medicine involves identifying specific genes and pathways to be targeted in individual patients. This has been the driving force for compiling databases of genome and proteome changes in GBM patients that are now being successfully mined to uncover novel risk factors and potential therapeutic targets. Using this approach, we made the unexpected discovery that in a subset of glioblastomas, the autism-associated gene SLC9A96-8 was a potent driver of tumor growth and migration, associated with decreased patient survival and increased aggressiveness in vivo.
Previously, we showed that loss of function mutations in SLC9A9 encoding the endosomal Na+/H+ exchanger NHE9 result in hyperacidification of sorting endosomes and cellular trafficking defects associated with autism6,7. In contrast, we now report that gain of function in NHE9 results in excessive luminal alkalization in brain tumor initiating cells from patient glioblastomas. Although studies of pH, ionic and volume modulation in tumor cells have thus far been restricted to plasma membrane ion transporters, there have been intriguing hints of a link between organellar pH and oncogenic signaling by growth factor receptors. The human papillomavirus type 16 E5 oncoprotein activates growth factor receptors EGFR and PDGFR with concomitant alkalization of Golgi and endosomes, following binding to H+-pumping V-ATPase 16 kDa c subunit9. Furthermore, pharmacological disruption of V-ATPase activity by bafilomycin A1 was found to augment the extent and duration of EGFR activation10. However, a causal link between luminal pH and oncogenic signaling remains to be established and the prevailing model of the luminal pH set point overwhelmingly focuses on the proton pumping V-ATPase, with the role of proton leak pathways, mediated by endosomal Na+/H+ exchange, being largely understudied.
In this study we demonstrate that NHE9 levels in patient-derived brain tumor initiating stem cells (BTIC) drive proliferation rates, cell adhesion, migration directionality and speed in vitro and in vivo mouse xenograft models. Mechanistically, these events are mediated by the luminal pH of sorting endosomes with distinct effects on endocytosis and exocytosis of cargo. EGFR is mutated, amplified or transcriptionally up regulated in 50% of human GBM11 and its downstream signaling network includes highly deregulated and oncogenic components responsible for uncontrolled cell proliferation in most cancers. By drastically attenuating receptor turnover, NHE9 exerts post-translational control on membrane persistence of EGFR, confers increased resistance to receptor tyrosine kinase inhibitors and drives oncogenic signaling pathways that regulate cell division and migration. Importantly, post-translational control by NHE9 overrides differences in EGFR transcript levels in GBM tumor cells. Finally, we demonstrate that a pharmacological inhibitor of NHE transporters works together with a known EGFR inhibitor to impair GBM tumor growth. Given the dismal prognosis of glioblastoma, these observations highlight the potential of developing selective anti-NHE9 therapeutics. Taken together, our findings reveal a crucial, hitherto unrecognized role for luminal pH in GBM progression and allow us to propose NHE9 as a promising chemotherapeutic target.
Results
NHE9 affects patient survival and GBM proliferation
Gene expression profiles for NHE9 (SLC9A9) were extracted from human glioblastoma arrays on Oncomine and The Cancer Genome Atlas (TCGA) databases 12-16. NHE9 expression varied widely among human glioblastoma subtypes, with 36% of mesenchymal tumors showing significant NHE9 upregulation (Supplementary Figure 1A). Notably, NHE9 was in the top 12% of overexpressed genes in a human gene chip array of 101 samples, with mRNA levels averaging 5.7 fold higher (p = 0.012; Student's t-test) in glioblastomas relative to control neural stem cells (Figure 1A). Interrogation of the TCGA database revealed that patients with unaltered expression of NHE9 (71.4% of 91 GBM cases) survived longer with the difference in maximal survival between these patients of 65 months (Figure 1B; p = 0.032; Logrank test). Also, patients with unaltered expression of NHE9 remained disease free for median period of 8.4 months post tumor resection. In contrast, NHE9 up regulation (28.6 % of 91 GBM cases) correlated with significantly shorter disease-free periods with median of only 4.8 months (Supplementary Figure 1B; p = 0.012; Logrank test). A more thorough examination of the TCGA dataset including a subset of patients who received neo-adjuvant chemotherapy, which included temozolomide (>50% cases), PCV (procarbazine, CCNU, vincristine) and others, revealed that patients with unaltered expression of NHE9 showed strikingly better response and survived longer with a median survival of 58.68 months, in contrast to 15.98 months in patients with NHE9 upregulation (Figure 1C; p = 0.000002; Logrank test). Furthermore, patients with unaltered expression of NHE9 with neo-adjuvant chemotherapy remained disease free post-resection for median period of 33.67 months, in comparison with 11.28 months in patients with NHE9 upregulation (Supplementary Figure 1C; p = 0.00295; Logrank test). The finding that NHE9 confers resistance to treatment is strengthened by a recent study demonstrating that patients with esophageal squamous cell carcinomas with NHE9 upregulation showed poor response to neoadjuvant chemoradiotherapy17. Taken together, the observations suggest that NHE9 expression levels may have a role in GBM prognosis.
Figure 1. NHE9 expression in glioblastoma affects patient survival, chemoradiation resistance and tumor stem cell proliferation.
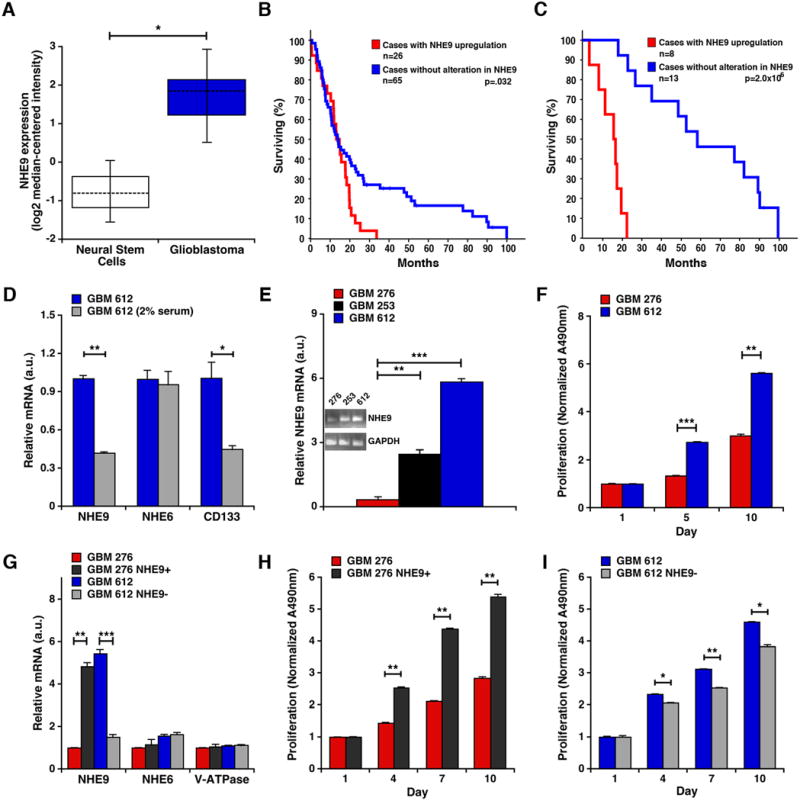
(A) NHE9 transcript is elevated in glioblastoma tumor stem cells (n=22) relative to normal neural stem cells (n=3) (*p = 0.012, student's t-test). (B-C) NHE9 transcript is upregulated in 28.6% of cases found in TCGA database when a Z-score of 0.5 was selected. (B) Patients with GBM up regulation of NHE9 had decreased overall survival. (C) Of 21 patients who received neo-adjuvant chemoradiotherapy, those with unaltered expression of NHE9 showed better response to treatment and survived longer (p = 0.000002; Logrank test) relative to those with upregulation of NHE9. (D) qPCR analysis of NHE9, NHE6 and CD133 mRNA from GBM 612 tumor stem cells cultured in medium without or with serum. Transcript levels of NHE9 and CD133 decrease in serum (*p = 0.012, **p = 0.0001, two-tailed student's t-test with Welch's correction, n = 3), whereas NHE6 shows no change. (E) qPCR analysis of NHE9 mRNA in cells from three primary GBM tumors 276, 253, and 612 (**p = 0.0003, ***p = 1.01 × 10⁻⁵, two-tailed Welch's t-test, n = 3). Inset shows ethidium bromide stained agarose gel of RT-PCR products of mRNA from the GBM cells. (F) Normalized proliferation of GBM cells 276 and 612 (***p = 1.87 × 10⁻⁵, **p = 0.0001, two-tailed Welch's t-test, n = 3) as determined by MTS assay. (G) qPCR analysis showing the efficacy of overexpression and shRNA knockdown of NHE9 in GBM 276 and 612 cells respectively (**p = 0.0008, ***p = 3.44 × 10⁻⁵ two-tailed Welch's t-test, n = 3). (H) Normalized proliferation of GBM 276 control cells and 276 cells overexpressing NHE9 (**p < 0.01, two-tailed Welch's t-test, n = 3). (I) Normalized proliferation of GBM 612 control cells and 612 cells with shRNA knockdown of NHE9 (*p < 0.05, **p = 0.0018, two-tailed Welch's t-test, n = 3). Bars represent mean ±S.D. All cell cultures were counted, seeded at similar levels and cell densities determined by measuring absorbance at 490nm (Abs490nm); initial values were as follows (average of triplicates, std. dev.): GBM 276 (0.148, 0.010); GBM 276+NHE9 (0.155, 0.011); GBM 612 (0.174, 0.022); GBM 612-NHE9 (0.167, 0.041). See related Supplementary Figures 1 and 2.
Based on these initial observations, we evaluated NHE9 transcript levels in three clinical GBM specimens (GBM 612, GBM 253, and GBM 276; Supplementary Table 1), cultured in serum-free conditions to enrich for BTIC that maintain phenotype and genotype characteristics of the original tumor. NHE9 expression, like that of CD13315, was associated with stem/progenitor characteristics, as seen by a significant decrease in transcript upon culturing GBM 612 in serum (Figure 1D. No transcriptional change was observed for the closely related isoform, NHE6 after transfer to serum. Comparative analysis of three early passage BTIC lines derived from patient tumors showed a 19.4 fold variation in NHE9 transcript levels (GBM 276 < GBM 253 < GBM 612; Figure 1E), consistent with the variation observed in database surveys. The correlation of NHE9 levels with higher growth rates in GBM 612 relative to GBM 276, was suggestive of a role in tumor cell proliferation (Figure 1F). To test this hypothesis, we engineered lentiviral-mediated elevation of NHE9 in GBM 276, and conversely, attenuated NHE9 transcripts in GBM 612 as shown Figure 1G. No compensatory changes in mRNA levels were observed in the related endosomal isoform NHE6 or V-ATPase subunit VOA1 in these cells (Figure 1G). Consistent with a role for NHE9 in tumor cell proliferation, growth rates in GBM 276 cells overexpressing NHE9 were significantly higher than vector-transfected control cells (Figure 1H). Conversely, knocking down NHE9 expression decreased cell proliferation in GBM 612 cells (Figure 1I). These findings were replicated under both normoxia and hypoxia conditions (Supplementary Figure 2A-D). We note that cell viability remained unaltered by introduction or knockdown of NHE9 (Supplementary Figure 2E). Therefore, we conclude that NHE9 levels regulate proliferation of BTIC in vitro.
NHE9 promotes tumorigenesis and invasion of GBM BTIC in vivo
Next, we evaluated in vivo effects of widely differing NHE9 expression in two human glioblastomas, GBM 276 (Figure 2A-B) and GBM 612 (Figure 2C-D), using intracranial xenograft transplants in a nude mouse model (Figure 2E). Following silencing of NHE9 in GBM 612 (GBM 612 NHE9-), tumor area in implants was visibly reduced relative to vector-transfected control (Figure 2F-G). These differences were quantitatively significant by an average ∼ 2.2 fold (Figure 2H; p = 5.3 × 10⁻⁶; two-tailed Welch's t test). Overexpression of NHE9 in GBM 276 (GBM 276 NHE9+) resulted in a significant increase in tumor size (∼2 fold on average; p = 6.1 × 10⁻⁵; two-tailed Welch's t test) relative to the vector-transfected control (Figure 2I; Supplementary Figure 3). Invasive capacity was assessed from the number of cells migrating into the contralateral hemisphere, as described previously 2. Similar to the observations with tumor size, there was a significant reduction of tumor cell invasion following NHE9 silencing in GBM 612 (p = .0025; two-tailed Welch's t test), and increased invasion with NHE9 overexpression in GBM 276 (p = .0003; two-tailed Welch's t test; Figure 2J-K) when we analyzed cell migration in vivo. Together, both in vitro and in vivo findings confirm a critical role for NHE9 in tumor progression.
Figure 2. Altering NHE9 expression in GBM BTICs affects tumor proliferation and invasion in vivo.
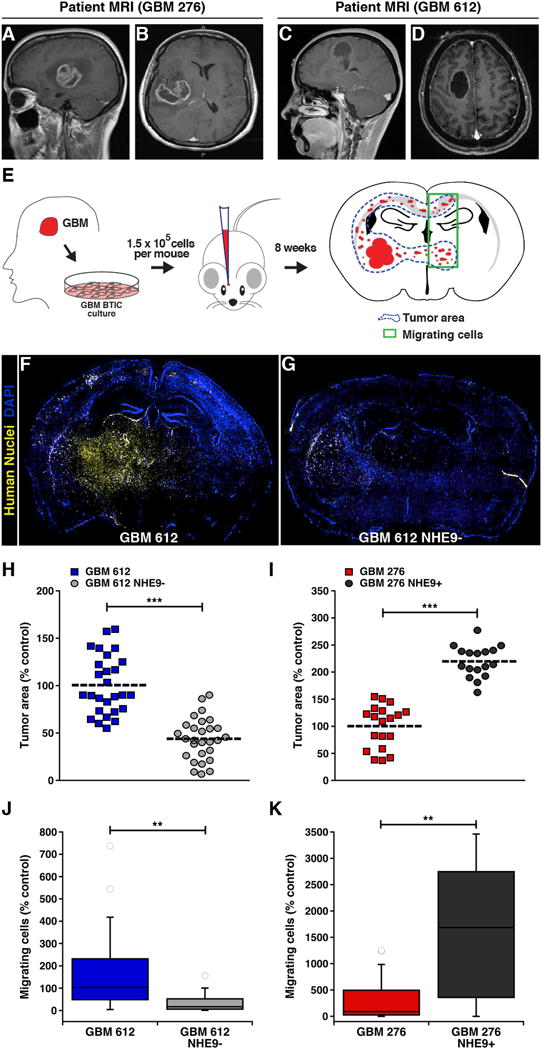
(A-D) Two different MRI views for 276 (A and B) and 612 (C and D) GBM patients show the source of the BTIC used in our study. (E) Schematic of primary tumor extraction, subsequent culture in serum free medium, and intracranial injection into a mouse brain (coordinates: X1.5, Y-1.34, Z3.5 from Bregma). Blue dotted line in the illustrated brain section represents tumor area and green box represents cells migrating into the contralateral hemisphere. (F and G) Representative images of DAPI-stained coronal sections of mouse brains, after injection of GBM 612 BTIC transfected with (F) control shRNA or (G) NHE9 shRNA constructs. Yellow staining represents human GBM cells identified by monoclonal IgG1 antibody against human nuclei. (H-K) Effect of NHE9 on tumor size and migration. Orthotopic in vivo tumors formed by GBM 612 BTIC treated with NHE9 shRNA were significantly smaller (H) and less invasive (J) than their control counterpart. Tumors formed from GBM 276 BTIC were significantly larger (I) in cells overexpressing NHE9 and more invasive (K) than control cells. Bars represent mean ±S.D; **p < 0.01, ***p < 0.0001, two-tailed Welch's t-test; from left to right, n = 27, 28 (H) and 19, 17 (I). See related Supplementary Figure 3.
NHE9 drives GBM BTIC migration on nanopatterned ECM surface
The diffuse and aggressive infiltration of tumor cells along vascular and white matter tracts is directly responsible for the inefficacy of tumor resection, resulting in mean survival times of only 12-15 months. Central to the invasiveness associated with glioblastomas, as observed in Figure 2, are tumor cell-substratum interactions and subsequent modification of matrix barriers. In vivo, tumor cells interact with extracellular matrix in the nanometer scale 18 and respond to topographical cues that affect cell adhesion and gene expression. To study BTIC migration in vitro under conditions of GBM dissemination 2,18-20, we conducted directional migration assays on nano-ridges constructed of transparent polyurethane acrylate coated with laminin (Figure 3A) as previously reported by our group 2. These longitudinal tracts closely mimic mechanical cues found in ECM such as capillaries and nerve fiber tracts along which tumor cells migrate. Biased migration along the grooves was quantified using time-lapse microscopy for a period of 15h at regular intervals of 15 min in GBM pairs 276 and 612, with NHE9 overexpressed or silenced, respectively. Phase contrast images of a representative 2h period for GBM 276 and GBM 276 NHE9+ is shown in Figure 3B. Quantification of cell speed over time for each population (Figure 3C-D) and the total average cell speed (Figure 3E-G) revealed that elevation of NHE9 expression in GBM 276 increased migration speed and consequently distance travelled, whereas attenuation of the high expression of NHE9 in GBM 612 had the converse effect, consistent with the invasion trends observed in mouse xenografts. Next, we evaluated specific parameters of migratory behavior likely to contribute to invasive ability. Migration alignment, which is the ratio of cell movement parallel to the patterned ridges to that perpendicular to the pattern (Figure 3H), correlated with migration speed, and a significant change in alignment was observed upon attenuation of NHE9 in GBM 612 cells (Figure 3I-J). Migration persistence, ratio of the actual distance travelled by the cell to the shortest distance between the initial and final points (Figure 3K), was also significantly affected by changes in NHE9 expression in both the GBM lines (Figure 3L-M). Thus, multiple parameters confirm that NHE9 regulates tumor cell migration in brain cancer.
Figure 3. GBM BTIC migration on a nanopatterned substrate is affected by NHE9.
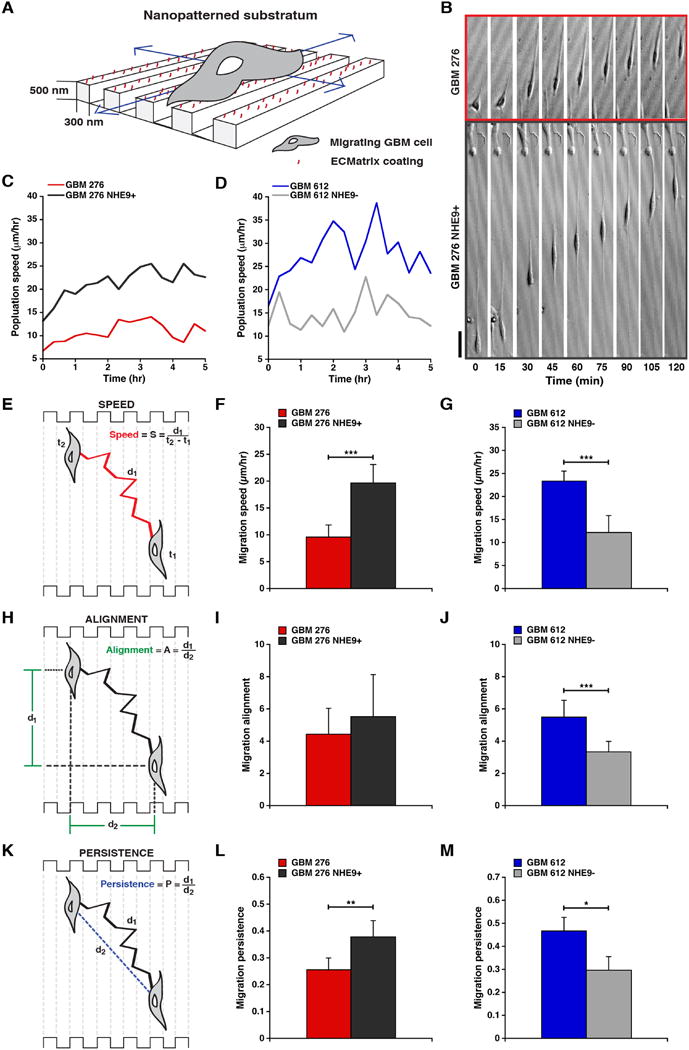
(A) Laminin-coated, longitudinal nanopatterned tracks with the designated dimensions were used for analysis of BTIC migration. (B) Representative time-lapse microscopic images collected every 15 min compare the migration of GBM 276 cells transfected with vector control and NHE9 over a period of 2 hrs. (C and D) Population speed, over a period of 5 hrs, of GBM 276 (C) and GBM 612 (D) cells relative to NHE9 overexpression or knockdown as indicated. Schematic representations of migration speed (E), alignment (H), and persistence (K) of GBM BTICs are shown, along with the formulae used for quantification. GBM 276 BTICs transduced with lentiviral vectors overexpressing NHE9 migrate faster (F) and are more persistent (L) than control cells (**p = 0.0004, ***p = 3.69 × 10⁻¹¹, two-tailed Welch's t-test, n = 75). GBM 612 BTICs treated with NHE9 shRNA show a decreased migration speed (G), alignment (J) and persistence (M) when compared to control virus-transduced cells (***p < 0.0001, *p = 0.036, two-tailed Welch's t-test, n = 75). There was no significant difference in the alignment between control and NHE9 overexpressing GBM 276 BTICs (I). Bars represent mean ±S.D. Scale bar in (C) is 50 μm.
NHE9 modulates endosomal pH and trafficking
As a starting point to decipher the mechanistic basis for tumor promotion we focused on GBM 253, in which NHE9 expression was intermediate between GBM 276 and GBM 612 BTIC (Figure 1E). Ectopic expression of NHE9 in GBM 253 significantly increased cell proliferation (Supplementary Figure 4A), consistent with results from Figure 1. We showed that NHE9-GFP partly co-localized with EEA1 (Supplementary Figure 5A-B) and Rab 11 (Figure 4A-B), markers for early and recycling endosomes respectively, in GBM 253. We did not observe co-localization of NHE9-GFP with lysobisphosphatidic acid (LBPA), a marker for late endosomes (Supplementary Figure 5C-D). Lack of co-localization with endoplasmic reticulum marker and protein folding chaperone BiP, suggested that NHE9 protein processing was not defective in GBM (Supplementary Figure 5E-F). Therefore, we concluded that NHE9 localization in tumor cells was similar to that observed in normal, primary murine astrocytes 6. Furthermore, NHE9-GFP co-localized with endocytosed transferrin tagged to Alexa Fluor-633, both in the perinuclear region and in the periphery of the cell (Figure 4C), also seen in orthogonal section (Figure 4D). We monitored steady state accumulation of transferrin (Figure 4E) and noted that NHE9-GFP expression in GBM 253 cells was accompanied by increased accumulation of Tfn-Alexa Fluor 633, relative to GFP-transfected controls, as measured by flow cytometry (Figure 4F-G) and confocal microscopy (Figure 4H-I). To determine whether increased transferrin accumulation (Figure 4J) was dependent on Na+/H+ exchange activity and not a non-specific effect of gene overexpression, we evaluated the effect of previously described autism-associated loss-of-function mutations in NHE96,8. Single amino acid substitutions in conserved regions of mammalian NHE9, L236S and S438P (Figure 4L) were generated, and introduced into GBM 253 cells. Mutant NHE9 (S438P) failed to increase cell proliferation, in contrast to wild type control (Supplementary Figure 4B). Like the wild type control, loss-of-function NHE9 mutants also co-localized with Tfn-Alexa Fluor 633 (Supplementary Figure 5G-H), but failed to elevate Tfn-Alexa Fluor 633 accumulation (Figure 4K). Therefore we concluded that ion transport activity by NHE9 alters transferrin trafficking in GBM cells.
Figure 4. NHE9 localizes to recycling endosomes and alters transferrin uptake.
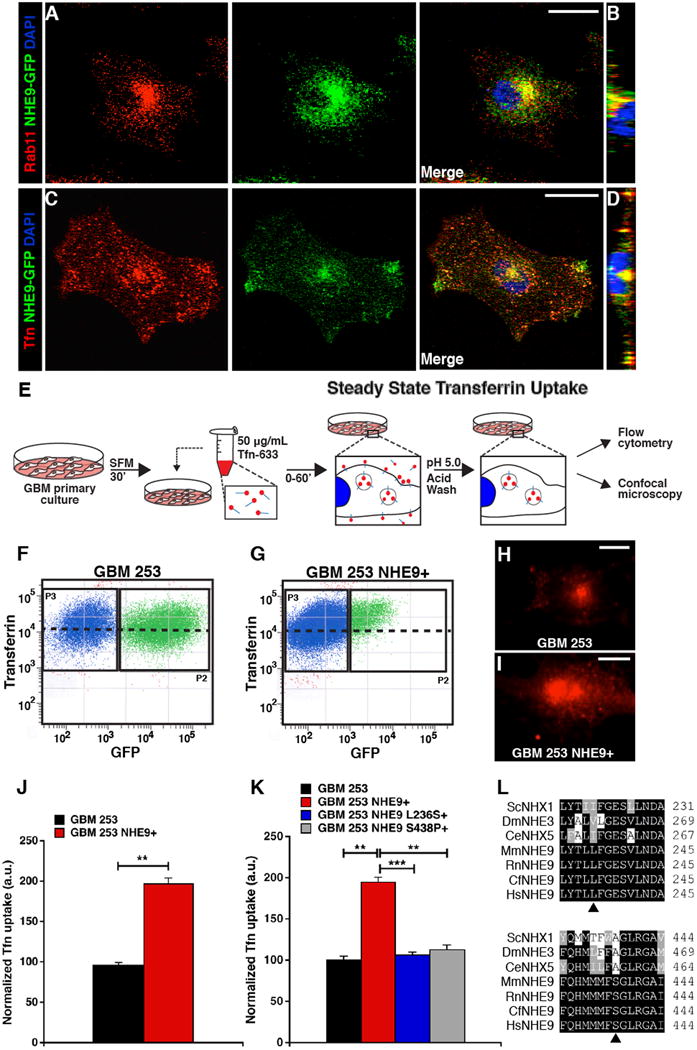
(A-D) Representative confocal microscopy images of GBM 253 cells expressing NHE9-GFP. Cells were fixed with 4% PFA and Rab11 and observed by immunofluorescence. Subcellular colocalization of NHE9-GFP (green) with Rab11 (red) is seen in the merge (A) and orthogonal slice (B). Cells were incubated with transferrin tagged to Alexa Fluor-633 (Tfn-633) for 55 min and imaged (C) to show overlap with NHE9 in the perinuclear region and cell periphery, as seen in the orthogonal slice (D). (E) GBM 253 cells were transfected with GFP vector or NHE9-GFP and incubated with Tfn-633 for 55 min to compare steady state transferrin uptake. (F-G) GBM 253 cells were subjected to FACS analysis to separate untransfected cells (blue) from GFP-expressing cells (green). Black dashed line indicates average fluorescence intensity (y-axis) of GFP positive (x-axis) population. There was an increase in average fluorescence of Tfn-633 in cells expressing NHE9-GFP relative to the GFP control, as seen by shift in the population over the black line. (H-I) Fluorescence micrograph of GBM 253 cells treated with Tfn-633 as in (F) and (G), respectively. Fluorescence intensity and exposure settings were the same in the two images. Following background subtraction, fluorescence signal was increased by 2.8 fold in (I) relative to (H). (J) Quantitation of Tfn-633 fluorescence from FACS analysis in GBM 253 control cells and 253 cells overexpressing NHE9 (**p = 0.0005, two-tailed Welch's t-test, n = 3 with >5000 cells). Note that the population in P2 may underestimate low expressors of NHE9-GFP in panel 5G. (K) Previously described loss-of-function mutations in NHE9 (L236S and S438P) failed to elevate Tfn-633 accumulation (**p < 0.01, ***p = 2.56 × 10⁻⁷, two-tailed Welch's t-test, n = 3). (L) NHE9 and gene ortholog alignments showing residue conservation of loss-of-function mutations in various species. Bars represent mean ±S.D. Scale bars: 20 μm. See related Supplementary Figures 4 and 5.
NHE9 is proposed to function as a leak pathway for protons, limiting the acidification of the endosomal lumen by the proton pumping V-ATPase6. Therefore, high levels of NHE9 should make the endosomal lumen more alkaline, via cation/proton exchange activity. To measure endosomal pH (pHe), we took advantage of colocalization of NHE9 with transferrin, as shown in Figure 4C-D. Luminal pH was quantified by a ratiometric method using pH-sensitive fluorescence of FITC-tagged transferrin, normalized for differences in endosomal uptake with pH-insensitive fluorescence of Alexa Fluor-633 linked to transferrin (Figure 5A) and calibrated using buffers of known pH (Figure 5B). Expression of NHE9 in GBM 253 cells resulted in >1 pH unit elevation of pHe from 5.71 ± 0.23 to 6.90 ± 0.47 (Figure 5C). In contrast, there was no significant change in cytoplasmic pH (Supplementary Figure 4C-D), as has been previously reported for the closely related endosomal isoform NHE621. To establish a causal link between compartmental pH and trafficking of transferrin, we evaluated a known alkalinizing agent, monensin that also mediates Na+/H+ exchange activity. Luminal pHe in GBM 253 cells treated with monensin (500 μM) was also elevated (to 7.02 ± 0.20), similar to cells expressing NHE9 (Figure 5C). We observed dose-dependent increase in steady state Tfn-Alexa Fluor 633 accumulation with monensin (Figure 5D). Next, we compared the effect of monensin and NHE9 overexpression on the kinetics of transferrin uptake and efflux. NHE9 overexpression increased the rate and steady state levels of transferrin accumulation, whereas it had no effect on the rate of efflux (Figure 5E-H). In contrast, the increase in transferrin accumulation observed with monensin treatment was largely due to a decrease in the rate of efflux (Figure 5E-H). Thus, although both NHE9 and monensin alkalinized endosomal compartments to similar extent, they had distinct effects on transferrin uptake and efflux. It was possible that enhanced transferrin uptake resulting from ectopic expression of NHE9 was the result of elevated surface expression of the transferrin receptor on GBM 253 tumor cells. To test this hypothesis, we observed transferrin-Alexa Fluor 633 bound to GBM 253 cells on ice. Under these conditions endocytosis was greatly reduced, allowing transferrin receptors present on the cell surface to be visualized. More surface-bound fluorescence was observed in GBM 253 cells transfected with NHE9 (Figure 5I), consistent with elevated levels of transferrin receptor, which was confirmed by surface biotinylation (Figure 5J). These findings suggest that NHE9 elevates surface levels of membrane receptors on GBM cells. In summary, we used a variety of experimental approaches, including flow cytometry, confocal microscopy, surface labeling and biotinylation in NHE9-overexpressing or monensin-treated cells, to demonstrate that endosomal Na+/H+ exchange activity can strongly affect binding and uptake of transferrin at the cell membrane of GBM BTIC. These observations, if extended to other cell surface proteins and growth factor receptors, have the potential to impact oncogenic signaling.
Figure 5. NHE9 regulates endosomal pH in GBM BTICs and controls transferrin receptor trafficking.
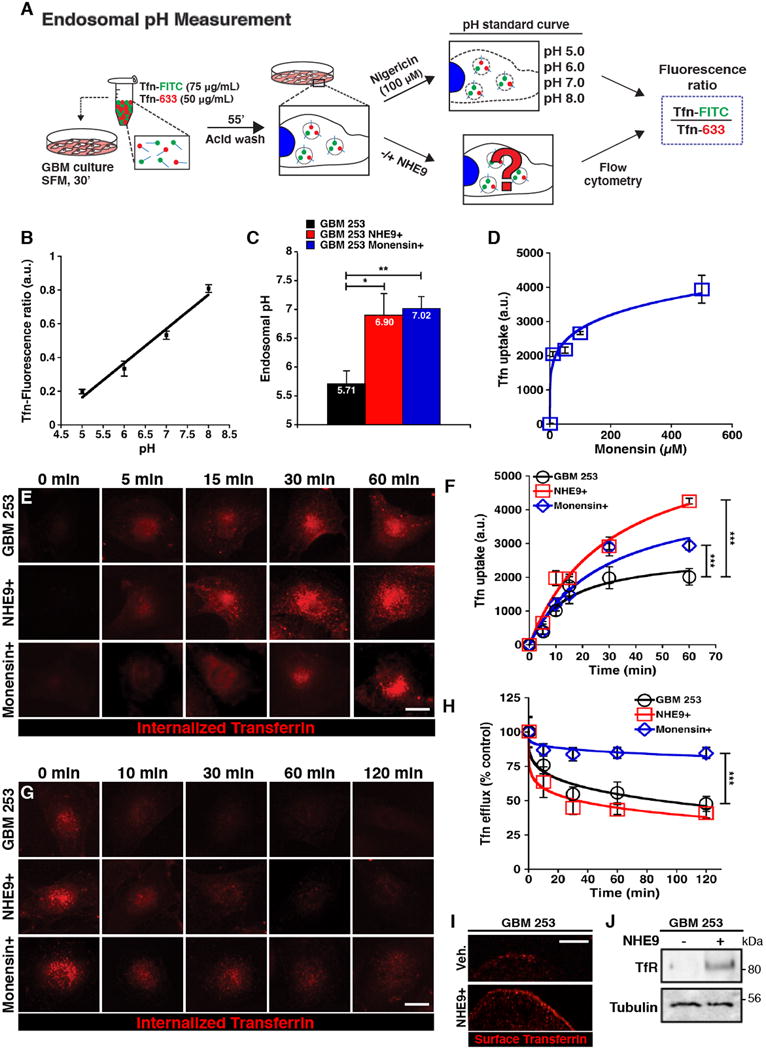
(A) Endosomal pH of transferrin positive compartments was measured by treating GBM 253 cells with transferrin tagged to pH-sensitive fluorophore fluorescein isothiocyanate (Tfn-FITC), and the pH-insensitive Alexa-633 (Tfn-633). Control and NHE9 overexpressing cells, as well as cells used to calculate a pH calibration curve, were loaded with tagged Tfn for 1 hr and a fluorescence ratio of internalized transferrin was quantified using flow cytometry. (B) Calibration of GBM 253 endosomal pH. Cells loaded with Tfn-FITC and Tfn-633 were exposed to nigericin (100 μM) and assayed in pH-defined medium (pH 5.0 to pH 8.0) to calculate their fluorescence ratio (R2 = 0.988). (C) pH in Tfn-positive endosomal compartments is alkalinized in GBM 253 cells expressing NHE9 or after treating with the ionophore monensin (500 μM for 1 hr) relative to vector control (*p = 0.032, **p = 0.002, two-tailed Welch's t-test, n = 3). (D) Dose dependence of Tfn-633 in response to monensin treatment (n = 100 cells per concentration). Fluorescence is presented in arbitrary units (a.u.). (E-F) Time course of Tfn-633 accumulation in GBM 253 cells transfected with vector control, NHE9 or treated with monensin (500 μM), as indicated. Representative images are shown (E), and mean fluorescence ±S.D. was plotted (F). Cells expressing NHE9 and control cells treated with monensin show an increased rate and total accumulation (***p < 0.0001, two-tailed Welch's t-test, n = 3 with >75 cells). (G-H) Time course of Tfn-633 efflux was monitored by loss of fluorescence, after loading cells for 55 mins, as seen in representative images (G) and plot of mean fluorescence ±S.D. (H). Monensin treatment drastically reduces Tfn-633 efflux whereas overexpression of NHE9 did not significantly change Tfn efflux (***p < 0.0001, two-tailed Welch's t-test, n = 3 with >75 cells). (I-J) Plasma membrane levels of Transferrin Receptor (TfR) in GBM 253 cells were monitored by a surface binding assay performed on ice that only allows Tfn-633 to bind surface receptors (I) and by western blot analysis of surface biotinylation (J). GBM 253 cells expressing NHE9 showed increased surface expression of TfR (n = 3). Bars represent mean ±S.D. Scale bars: 20 μm.
NHE9 promotes EGFR signaling
A striking, and signature feature of GBM is dysregulated EGFR activity, with gene amplification, mutation and alteration in receptor tyrosine kinase pathways driving tumor growth in over 80% of gliomas22. Although EGFR signaling pathways are compelling targets for therapeutic intervention, clinical outcomes for the first generation of anti-EGFR therapeutics have been disappointing in patients with GBM. This lack of efficacy of tyrosine kinase domain inhibitors has been attributed to redundancy in signaling pathways, tumor heterogeneity and mutation-specific differences in inhibitor sensitivity23. An independent and alternative strategy to inhibiting receptor tyrosine kinase phosphorylation is to down regulate cell surface availability of the receptor by exploiting negative feedback mechanisms known to control the duration and intensity of EGFR signaling. Based on our finding that NHE9 modulated transferrin receptor levels to regulate ligand uptake, we next investigated the effect of NHE9 on EGFR signaling in GBM BTIC. Growth rates of both GBM 276 and GBM 612 were responsive to EGF, and were further increased or decreased respectively by NHE9 expression or knockdown (Supplementary Figure 6A-B). Significantly, proliferation was lowest in the absence of EGF and NHE9 expression, suggesting that NHE9 may synergize with EGFR signaling to promote tumor cell growth (Supplementary Figure 6A-B). EGFR transcript levels were the same in GBM 612 and GBM 276 (Supplementary Figure 6C). Strikingly, however, plasma membrane expression of EGFR as determined by surface biotinylation was nearly three-fold higher in the faster growing and more aggressive GBM 612 BTIC, relative to GBM 276 (Supplementary Figure 6D). These findings suggested that differences in NHE9 expression between the two GBM cell lines were critical in determining surface expression of EGFR. Confirming this hypothesis, pair-wise experiments indicated that elevation of NHE9 expression in GBM 276 significantly increased plasma membrane persistence of EGFR relative to vector-transfected control (Figure 6A,C). Conversely, transcriptional attenuation of NHE9 in GBM 612 cells significantly decreased surface expression of EGFR (Figure 6B,D). Consistent with our findings, there was no correlation in gene expression between NHE9 and EGFR in the TCGA dataset14 (Pearson correlation: -0.157, p value: 0.141, n=91), and the subset of patients with mutations in EGFR (15 of 90 patients) was not associated with changes in survival or in NHE9 expression. Thus, we concluded that NHE9 functions post-transcriptionally to regulate EGFR signaling.
Figure 6. NHE9 drives EGFR membrane persistence and downstream oncogenic signaling in GBM BTICs.
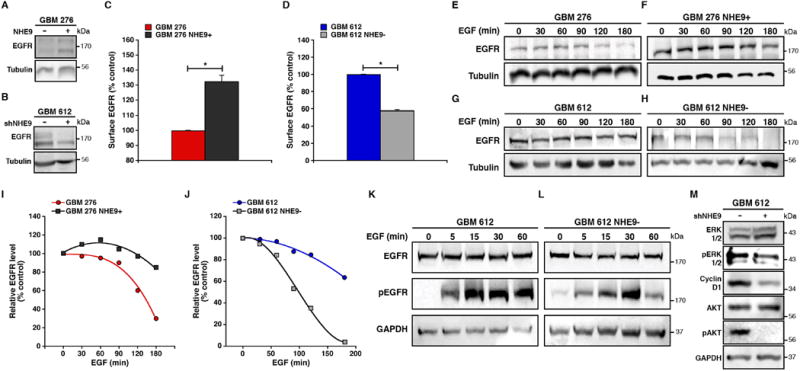
(A-D) Plasma membrane levels of EGFR, determined by surface biotinylation, are elevated in GBM 276 cells expressing NHE9-GFP (A,C) and decreased in GBM 612 cells treated with NHE9-shRNA (B,D). Representative blots are shown for GBM 276 with NHE9 overexpression (A) and GBM 612 virally transfected with NHE9 shRNA (B). Graphs represent average band intensity from densitometric scans of immunoblots. EGFR levels were normalized to Tubulin and are shown relative to vector-transformed control (*p < 0.05, two-tailed Welch's t-test, n = 3). (E-H) NHE9 regulates EGFR turnover in GBM BTICs. Cells were growth factor starved and pre-incubated with cycloheximide (CHX) for 2 hrs, followed by the addition of EGF (20 ng mL-1). At time intervals indicated, cell lysates were collected and analyzed by western blotting. Overexpressing NHE9 in GBM 276 (F) hampered EGFR degradation induced by EGF stimulation compared to 276 control cells (E). GBM 612 cells with attenuated NHE9 expression (H) showed the opposite affect, with increased EGFR degradation compared to 612 vector controls (G). Representative blots for both GBM 276 and GBM 612 are shown (n = 3). (I-J) EGFR bands in the cycloheximide assay (E-H) were normalized to their respective Tubulin levels and graphed as a percentage of GBM 276 (I) or GBM 612 (J) controls without the addition of EGF. (K-L) Knockdown of NHE9 expression in GBM 612 cells down regulates the activation of EGFR (L) compared to vector control (K). Cells were growth factor starved for 2 hrs and then treated with EGF for the indicated times before lysates were collected for immunoblotting (n = 3). Downstream signaling pathways of GBM 612 (M) treated with EGF (30 min) were also altered in cells transfected with NHE9 shRNA. Cell lysates were immunoblotted with the indicated antibodies. Bars represent mean ±S.D. See related Supplementary Figure 6.
Stimulation with EGF triggers receptor endocytosis and lysosomal degradation, resulting in disappearance of ∼70% EGFR in GBM 276 cells and ∼36.4% in GBM 612 cells within 3h, in the absence of new protein synthesis (Figures 6E and G, respectively). These differences in EGFR turnover could be directly linked to NHE9 levels. Thus, elevated expression of NHE9 in GBM 276 limited EGFR degradation to ∼15%, whereas attenuation of NHE9 expression in GBM 612 tumor cells greatly enhanced EGFR turnover by ∼ 96.4% of initial levels, within 3h (Figures 6F,I and H,J respectively). Next, we investigated the impact of altered NHE9 expression on EGFR signaling in GBM TISC. NHE9 knockdown in GBM 612 decreases phosphorylation of EGFR (Figure 6K-L) and key downstream signaling components that mediate tumor proliferation and invasion, including ERK, Cyclin D and AKT (Figure 6M). Consistent with these findings, increased NHE9 expression in GBM 276 cells resulted in increased activation of the EGFR signaling pathway (Supplementary Figure 6E).
Receptor sorting and degradation are dependent on acidic luminal pH in the endo-lysosomal system. We measured endosomal pH, as described for GBM 253 in Figure 5, in GBM 276 and GBM 612. As predicted, pHe correlated with NHE9 expression in the three GBM cell lines. GBM 276, showing lowest NHE9 levels, also had lowest endosomal pH (5.57 ± 0.13), whereas GBM 612, which had the highest NHE9 levels, had the highest pHe (6.88 ± 0.13). Furthermore, ectopic expression of NHE9 in GBM 276 significantly alkalinized pHe (6.61 ± 0.21; p = 0.023), and knockdown of NHE9 in GBM 612 resulted in corresponding acidification (to 6.63 ± 0.095; p = 0.049). Together, these data indicate that dysregulation of EGFR signaling by NHE9-mediated endosomal pH regulation could be one of the critical mechanisms leading to tumor progression.
Therapeutic potential of NHE9 inhibition
To explore the potential of NHE9 as a therapeutic target in a subset of GBMs, we first tested the effect of NHE inhibitors on GBM BTIC proliferation. The amiloride analog 5-(N-ethyl-N-isopropyl) amiloride (EIPA) is a general NHE inhibitor 24. The IC50 for EIPA in GBM 276 cells was 100 μg mL-1 for GBM 276 tumor cells, and increased by 20% following overexpression of NHE9 (Figure 7A), consistent with NHE9 being a target for EIPA. We also observed dose dependent reversal of the NHE9-mediated increase in transferrin uptake in GBM 253 cells by EIPA (Supplementary Figure 7A). Lower doses of EIPA, sufficient to inhibit NHE1, failed to inhibit growth of GBM 276 or reverse NHE9-mediated increase in cell proliferation (Supplementary Figure 7B). Overexpression of NHE9 greatly decreased the efficacy of Erlotinib, a known tyrosine kinase inhibitor of EGFR. Addition of EIPA (100 μg mL-1) effectively reversed the drug resistance conferred by NHE9, decreasing IC50 for erlotinib from 52 μg mL-1 to 31 μg mL-1 relative to that of the control GBM 276 cells, 17 μg mL-1 (Figure 7B). Similarly, treatment with EIPA improved inhibition of GBM 612 cells by Erlotinib (Supplementary Figure 7C). We show that EIPA reduces EGFR expression in GBM 612 BTIC, upon addition of EGF (Figure 7C-D), consistent with the increased efficacy of Erlotinib following EIPA treatment. U0126, a known MAP kinase (ERK1/2) inhibitor, also decreased the cell proliferation in GBM 276 cells overexpressing NHE9 (Supplementary Figure 7D), suggesting that the proliferation effects of NHE9 in these GBM cells were partly mediated by MAP kinase signaling, a major effector pathway in the EGFR network.
Figure 7. NHE inhibitor EIPA mitigates resistance to Erlotinib, EGFR persistence, and tumorsphere formation in GBM BTICs.
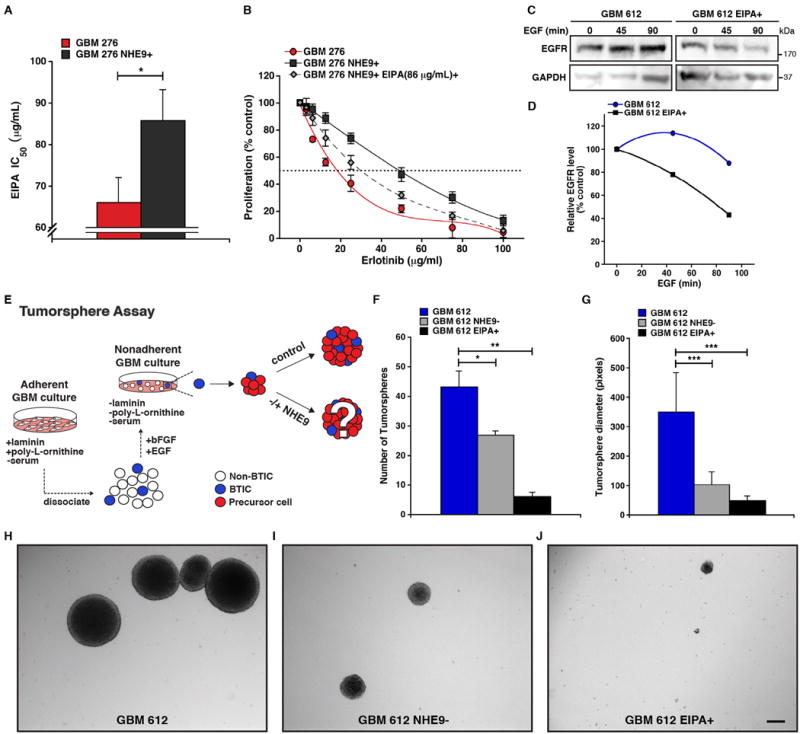
(A) GBM 276 cells were treated for 24 hrs in the presence of different concentrations of EIPA and cell viability was measured with a colorimetric MTS assay. The graph shows IC50 for EIPA is elevated in cells overexpressing NHE9 relative to vector control (*p < 0.05, two-tailed Welch's t-test, n = 3). (B) GBM 276 control cells, NHE9 overexpressing cells, and NHE9 overexpressing cells treated for 24 hrs with 85.83 μg mL-1 (EIPA IC50 of 276 NHE9+ cells) were treated with different concentrations of EGFR inhibitor Erlotinib and cell viability was measured by MTS assay (n = 3). (C-D) GBM 612 cells were growth factor starved, pre-incubated with cycloheximide (CHX) for 2 hrs, and treated with EGF (20 ng mL-1) for the times indicated before cell lysates were collected and analyzed by western blotting. 612 cells treated with EIPA (85.83 μg mL-1) showed an increase in EGF-stimulated EGFR degradation compared to vector control (C), and representative blots are shown (n = 3). EGFR bands in (C) were normalized to their GAPDH control and graphed as a percentage of controls (D) without the addition of EGF. (E) Adherent GBM BTICs not cultured in the presence of EGF were dissociated and transferred to non-adherent conditions (without laminin or poly-L-ornithine coating). Cells were cultured in StemPro NSC SFM media with EGF (20 ng mL-1) for 21 days before tumorsphere formation was analyzed. (F-G) Image J software was used to determine the number (F) and diameter (G) of tumorspheres from GBM 612, GBM 612 cells transfected with NHE9 shRNA, and GBM 612 cells treated with EIPA (85.83 μg mL-1) (*p < 0.05, **p < 0.01, ***p < 0.0001, two-tailed Welch's t-test, n = 3). (H-J) Representative phase contrast images of the tumorspheres are shown. Scale bar: 50 μm. Bars represent mean ±S.D. See related Supplementary Figure 7.
Renewable tumorsphere formation (Figure 7E) is associated with tumorigenic capacity, rapid tumor progression and is a significant predictor of clinical outcome 25. Knockdown of NHE9 in GBM 612 cells reduced the number of tumorspheres by ∼1.6 fold compared to control cells (Figure 7F and H-I). The diameter of the tumorspheres was also reduced by ∼3.3 fold (Figure 7G and H-I). Treating GBM 612 cells with 100μg mL-1 of EIPA drastically reduced both the number and diameter of tumorspheres by ∼7 fold (Figure 7F,G and H,J). Although the EIPA effects could include non-selective inhibition of other NHE isoforms besides NHE9, our results support the therapeutic potential of NHE9 as a drug target for a subset of GBM expressing elevated NHE9 levels. In such cases, bimodal therapy with known EGFR inhibitors could be an effective therapy.
Discussion
A common pathophysiological hallmark of tumors is a perturbation in pH dynamics 26. Oncogene-mediated elevation of cytoplasmic pH by constitutive activation of NHE1, and ensuing extracellular acidification, has long been recognized as an early step in neoplastic transformation driven by ras and c-mos 27,28. In contrast, the role of endosomal pH modulation in oncogenesis has not been studied although there is emerging evidence implicating organellar Na+/H+ exchangers in various cancers. In hypermutated colorectal tumors, SLC9A9, the gene encoding NHE9, was found to be among the most frequently mutated targets along with ACVR2A, APC, TGFBR2, MSH3, MSH6, and TCF7L229. Consistent with this finding, a genome-wide scan for colorectal cancer susceptibility identified linkage to chromosome 3q with SLC9A9 being one of the candidate genes30. Furthermore, a genome-wide case–control study of esophageal squamous cell carcinoma (ESCC) including 300 ESCC cases and 300 matched controls discovered significant associations of SNPs in SLC9A9 with ESCC risk31. The link between NHE9 and ESCC is strengthened by a recent study demonstrating that patients with ESCC with NHE9 downregulation (>2 fold) showed complete response to neoadjuvant chemo-radiotherapy17. Despite these clinical and genetic links, the molecular role of NHE9 in carcinogenesis was previously unknown. There has been one report showing that ectopic expression of NHE7, a closely related isoform of NHE9 that localizes to the trans-Golgi network, increased tumorigenicity in a breast cancer cell line32. Although the underlying mechanisms were not investigated, the study showed that whereas tumor invasion was enhanced by both NHE1 and NHE7, only NHE7 could promote anchorage-independent growth and cell-adhesion.
There is new evidence from model organisms as well as mammalian cells that luminal pH in the secretory-endosomal pathway is set by a balance of proton pump and leak and is critical for normal vesicle trafficking (Figure 8A) 33-35. Although the importance of the H+ pumping V-ATPase is firmly established, we are only beginning to appreciate the complementary role of eNHE as a H+ leak pathway for the precise tuning of luminal pH. Pathophysiological elevation or loss of NHE9 activity is associated with glioblastoma (this study) or autism 6,7, as a consequence of excessive luminal alkalization and acidification, respectively (Figure 8A). Early endosomes transit through a series of increasingly acidic compartments, culminating with delivery and degradation of cargo at the lysosome (Figure 8B, left panel). Luminal pH affects the fate of cargo both by modulating acid-activated hydrolases and by directing vesicle traffic through one of several routes. Thus, premature activation of vacuolar acid hydrolases in the yeast mutant lacking the eNHE ortholog, NHX1, results in degradation of chaperone protein VPS10 in the prevacuolar compartment and missorting of cargo to the extracellular medium36. Similarly, enhanced turnover of EGFR resulting from silencing or inhibition of NHE9 may be due to acidification of the endolysosomal system and activation of acid hydrolases. On the other hand, receptors may escape degradation by recycling back to the plasma membrane instead of being sorted to the late endosome/lysosome (Figure 8B; right panel). We show that elevated levels of plasma membrane receptors seen in NHE9-overexpressing GBM cells greatly enhance Alexa Fluor-labeled transferrin uptake by TfnR-mediated endocytosis and downstream signaling from EGFR.
Figure 8. Model for endosomal pH regulation by NHE9 and its affect on the downstream EGFR network.
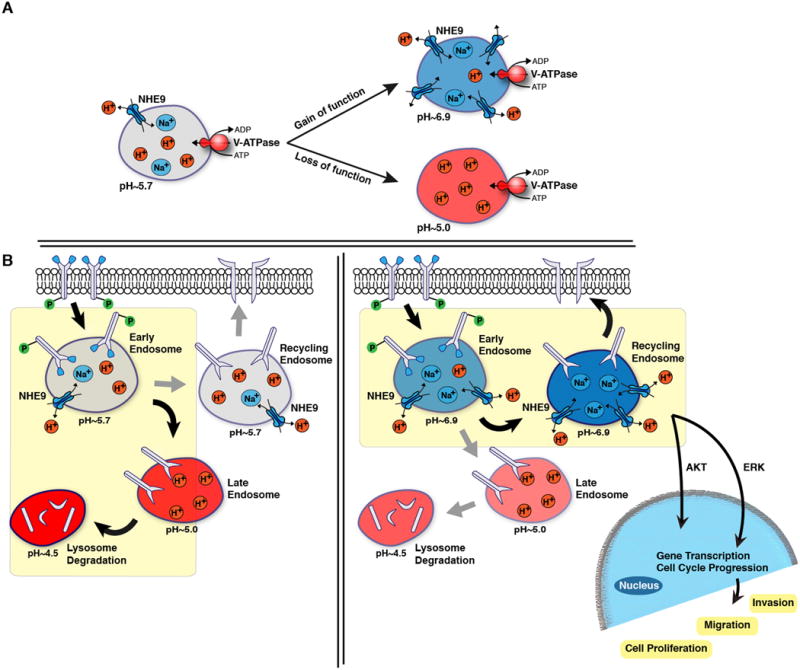
(A) Endosomal acidification is regulated by the V-ATPase, which pumps protons into the endosome lumen, and NHE9, which allows for proton movement out of the endosome via exchange with Na+ or K+. The endosome is alkalinized when there is proton leakage as a result of increased NHE9 expression or activity, and inversely acidified when there is a loss of NHE9 function. (B) Endosomes are trafficked through a series of pH-defined compartments that can lead either to i) recycling back to the plasma membrane, or ii) degradation within the lysosome. Luminal pH could regulate the activity of acid hydrolases and/or the sorting of endosomes along distinct pathways. A major fate of endocytosed EGFR under high ligand conditions is delivery to lysosomes for degradation. The model proposes that endosomal alkalization resulting from increased NHE9 activity diverts EGFR trafficking away from lysosomes and thus increases its membrane persistence. This results in activation of oncogenic downstream signals that lead to increased cell migration and tumorigenesis.
The EGFR signaling network is a powerful driver of glioblastoma 37. Ligand bound EGFR not only activates intracellular tyrosine kinases directly but synergistically transactivates other cell surface receptors to ignite signaling cascades that control cell proliferation, invasion and apoptosis. Yet, despite the importance of EGFR signaling, multiple clinical trials using EGFR kinase inhibitors have had disappointing clinical outcomes due to their lack of tumor cytotoxicity. Although kinase inhibition of EGFR results in decreased cell proliferation, cell death appears to require the loss of EGFR protein, consistent with vastly different in vivo phenotypes of EGFR knockout and mutants with greatly attenuated kinase activity 38,39. The resistance of GBM to EGFR kinase inhibitors has been attributed to a host of confounding factors, including activation of compensatory pathways, constitutively active mutations and kinase-independent prosurvival roles of EGFR. For example, EGFR protects cancer cells from autophagic death by stabilizing the active glucose transporter SGLT1, independent of its kinase function 40. There is growing realization that targeting EGFR for degradation could be a more effective strategy than inhibiting kinase activity. Recently, it was shown that depletion or inhibition of a dual specificity tyrosine phosphorylation-regulated kinase, DYRK1A, targets EGFR for lysosomal degradation, severely compromising self-renewal ability of GBM BTIC 41. Similarly, the tumor suppressor Mig-6 protein recruits internalized EGFR to the late endosome for eventual lysosomal degradation, by association with the SNARE protein STX8 42. Another example is that of LRIG, a transmembrane protein that controls CBL recruitment and EGFR downregulation, found to be attenuated in many glioblastomas 43,44. Taken together, several independent studies have borne out that EGFR membrane persistence is key to oncogenic activity.
Resveratrol, a potent SIRT1 activator, has anti-tumor property45. Treatment of GBM BTIC with resveratrol showed significant downregulation of NHE9 that is associated with reduced tumorigenicity and enhanced radiosensitivity46. In this context, it is worth noting that NHE9 is a known SIRT1 (sirtuin 1) associated gene and is repressed with SIRT1 activation47. We show that increased NHE9 expression in a subset of GBM patients decreases survival and promotes membrane persistence of multiple glial receptors and transport proteins, including EGFR, TfR (this study) and glutamate transporter6. Since multiple receptor tyrosine kinases are co-activated in GBM 48, we propose that endosomal NHE9 exerts pan-specific control over plasma membrane receptor density. Previous studies using 3D multi-scale brain tumor models suggest that a high EGFR density triggers the phenotypic switch between proliferation and migration early in the development of aggressive gliomas 49,50. Further, the simulations indicate that spatio-temporal expansion of glioblastoma depends largely on post-translational events and that malignancy cannot be determined by monitoring gene expression data alone. Our findings validate these predictions: although EGFR transcript levels were the same, the more aggressive GBM 612 tumor had much higher plasma membrane levels of EGFR protein relative to the slower growing and less invasive GBM 276 cells. We show that high levels of NHE9 correlate with increased receptor density by ensuring membrane persistence of EGFR irrespective of transcript levels, and that manipulating NHE9 expression or activity has profound effect on brain tumor stem cell renewal, proliferation and invasion. We note that membrane transport proteins are eminently “druggable” and have been successfully targeted by blockbuster drugs (Prozac, Prilosec and Lasix, to name a few). Pharmaceutical companies have already developed cardioprotective drugs against NHE1, another isoform in the NHE family. Our findings highlight an urgent need to screen for high affinity, selective NHE9 inhibitors that could be used in conjunction with receptor tyrosine kinase inhibitors to enhance receptor clearance as an effective treatment for glioblastoma.
Methods
GBM Cell Cultures
All glioblastoma tumor samples were obtained with written informed consent from patients through the Department of Neurosurgery, Johns Hopkins Hospital (Baltimore, MD), following Institutional Review Board (IRB) guidelines and as previously described2,51,52. Patient tumor grade and type was determined by a neuropathologist (Supplementary Table 1). Culture conditions were in a 5% CO2 incubator at 37°C as follows: GBM 253 primary glioblastoma cells were subcultured in DMEM/F12 (1:1) Nutrient Mixture, 10% fetal bovine serum (Invitrogen), and 1% HyClone Antibiotic Antimycotic Solution (Thermo Scientific). GBM 276 and GBM 612 glioblastoma stem cells were cultured in one of two ways: 1) as serum-free cultures on laminin and poly-L-ornithine coated plates53 using StemPro NSC SFM (Invitrogen) without EGF, or 2) as tumorsphere cultures with EGF (20 ng mL-1). EGF was only added to adherent cell cultures during experimental procedures.
Plasmids
Full-length mNHE9-EGFP was cloned into FuGW lentiviral vector as previously described 6. Quik-Change-Site-Directed Mutagenesis Kit was used to make all point mutations (Stratagene). HsNHE9 short hairpin RNA (shRNA) sequence (5′- CCGGCCCTCCATTAAGGAGAGTTTTTCAAGAGAAAACTCTCCTTAATGGAGGTTTTTC-3′) and control shRNA sequence (Sigma-Aldrich) (5′-CAACAAGATGAAGAGCACCAA-3′) were cloned into pLKO.1 lentiviral vector with a puromycin-selectable marker.
Construction of Lentiviruses and Cell Transduction
pCMV-dR8.9 and pMD2.G packaging plasmids were cotransfected with pLKO.1-NHE9 shRNA in HEK293 cells for 48 hrs. FuGW mNHE9-EGFP was cotransfected 1:1 with 2nd Generation Packaging Mix (ABM) into HEK293 cells according to manufacturer's instructions. Virus was collected 48- and 72-hours after transfection and Lenti-X Concentrator (Clontech) was added to concentrate lentiviral stocks. Glioblastoma cells infected with shRNA constructs were incubated with virus for 48 hrs and selected with puromycin (0.75 μg mL-1). GBM cells infected with mNHE9-EGFP virus were assayed 72 hrs after infection.
qPCR Analysis
mRNA was isolated from cell cultures using the RNeasy Mini kit (Qiagen) following the manufacturer's instructions and optional RNA treatment with DNase I (Roche) was done. cDNA was synthesized using the High-Capacity RNA-to-cDNA Kit (Applied Biosystems). Kit (Applied Biosystems, # 4387406), following the manufacturer's instructions. Quantitative real-time PCR analysis was performed using the 7500 Real-Time PCR System (Applied Biosystems) using Taqman Fast universal PCR Master Mix (Applied Biosystems, #4352042). Taqman gene expression assay probes used were Hs00234723_m1 (SLC9A6/NHE6), Hs00543518_m1 (SLC9A9/NHE9), Hs00184593_m1 (ATP6AP1/V-ATPase subunit), Hs01076078_m1 (EGFR), Hs01009250_m1 (PROM1/CD133), Hs99999901_s1 (18S RNA) and Hs02758991_g1 (GAPDH). Each experiment was performed with following qPCR cycling conditions: 2 minutes at 50°C, 10 minutes at 95°C, then 40 cycles of 15 sec at 95°C and 1 minute at 60°C. Ct values were used for all manipulations and were first normalized to endogenous control levels by calculating the ΔCt for each sample. Values were then calculated relative to control to generate a ΔΔCt value. Fold change was calculated using the equation: expression fold change =2−ΔΔCt. Three technical replicates of three independent (biological) replicates were run to account for assay variance.
Cell Proliferation Assay
Cell growth was monitored using the Celltiter 96 Aqueous One Solution Cell Proliferation Assay (MTS, Promega), which is based on metabolic activity as a proxy for cell number54. Briefly, 0.5 × 10⁴ cells were seeded, in triplicate, into a 96-well plate. At each time point, 20 μl of Celltiter 96 Aqueous One Solution reagent was added to each well and incubated for 2 hr at 37°C. The absorbance was measured at 490 nM using a 96-well plate reader and normalized to D1.
Intracranial GBM Injections and Immunohistochemistry
All animal protocols were approved by the Johns Hopkins Animal Care and Use Committee. In vivo tumorigenesis and invasion of cells expressing either NHE9-GFP or NHE9 shRNA were assayed in 4- to 6-week-old nude/athymic, male mice (NCr-nu/nu, NCI) using a previously described brain tumor model55. Briefly, a total of 150,000 cells were injected into the right hemisphere of the mouse brains (coordinates X1.5, Y1.34, Z3.5 relative to bregma). Each experimental group had eight animals each. Animals dying before the termination of the experiment were excluded from the analysis. Mice were sacrificed 8 weeks after injection, and fixed and stained as previously described2. Briefly, mice were subjected to a transcardiac perfusion using 4% paraformaldehyde as fixative. Dissected brain were postfixed overnight at 4°C in the same fixative, embedded in OCT compound (Tissue-Tek), frozen at -80°C, and sectioned. Then, cryosections were stained with an antibody against human nuclei (mouse monoclonal IgG1, 1:250, Millipore) and imaged to calculate tumor size and invasiveness by morphometric analysis using Image J (NIH). The slides were randomized, coded in blinded fashion and counted to prevent observer bias.
Nanopatterned Cell Migration and Quantitative Analysis
GBM cell migration was assessed and analyzed using a previously described directional migration assay 2. Briefly, nanogrooved substrates made of transparent polyurethane acrylate (PUA) were constructed using UV-assisted capillary lithography. The nanopatterned surface was coated with laminin and cell migration was quantified using time-lapse microscopy. Observation was done using a Cascade 512B II CCD camera equipped to an Olympus IX81 inverted microscope in a chamber controlled for temperature and environmental factors. Phase-contrast cell images were recorded automatically under 10X objective for 15 hrs at 15 min intervals using Slidebook 4.1 (Intelligent Imaging Innovations).
A previously designed custom MATLAB script was used to allow manual tracking of cells frame-by-frame. Beginning from the center of the cell body, average individual cell speed was calculated from a cell trajectory tracing the centroid position between intervallic images recorded within the 15 hr duration. Cell persistence was calculated by fractioning the shortest distance between the start and end point of a given cell's centroid position over the total distance travelled. Cell alignment to the nanopatterned substratum was calculated by fractioning the distance moved parallel over the distance moved perpendicularly to the ridges. All analysis were stopped in the case of an abnormal event (cell death, division, etc.) and not used in final average calculations. All averages were calculated using a minimum of 75 cell trajectories.
Immunofluorescence
Cultured GBM cells on coverslips were pre-extracted with PHEM buffer (60 mM PIPES, 25 mM HEPES, 10 mM EGTA, and 2 mM MgCl2, pH 6.8) containing 0.025% saponin for 2 min, then washed twice for 2 min with PHEM buffer containing 0.025% saponin and 8% sucrose. The cells were fixed with a solution of 4% paraformaldehyde and 8% sucrose in PBS for 30 min at room temperature and blocked with a solution of 1% BSA and 0.025% saponin in PBS for 1 hr. Primary antibodies were diluted 1:100 in 1% BSA and incubated with cells 1 hr or overnight. Alexa Fluor 568 goat anti-rabbit IgG and Alexa Fluor 568 goat anti-mouse IgG (both Invitrogen) were used at 1:1,000 dilution for 30 min. Cells were mounted onto slides using Dako Fluorescent Mounting Medium and were imaged using a Zeiss LSM510-Meta confocal microscope.
pH Measurement and Transferrin Uptake
Cells were rinsed and incubated in serum-free medium for 30 min to remove any residual transferrin. Following, cells were exposed to 100 μg mL-1 transferrin conjugated to Alexa Fluor 633 (Invitrogen) for imaging or flow cytometry, or to 100 μg mL-1 transferrin conjugated to pH sensitive FITC (75 μg mL-1) and pH non-sensitive Alexa Fluor 633 (25 μg mL-1) (Invitrogen) for pH measurement at 37°C for 55 min. Transferrin uptake was stopped by chilling the cells on ice. External transferrin was removed by washing with ice-cold serum-free DMEM and PBS, whereas bound transferrin was removed by an acid wash in PBS at pH 5.0 followed by a wash with PBS at pH 7.0. Surface bound transferrin (less than 5% to total) was determined with a parallel sample incubated on ice and was used for background subtraction. The fluorescence intensity of internalized transferrin was measured for at least 5,000 cells by flow cytometry using the FACSAria (BD Biosciences) instrument and the average intensity of the cell population was recorded 6.
For transferrin endocytosis and exocytosis measurements, cells on coverslips were rinsed and incubated in serum-free medium for 30 min and then exposed to 100 μg mL-1 transferrin conjugated with Alexa Fluor 633 for varying amounts of time. Washes were done accordingly (as described), and cells were mounted onto slides using Dako Fluorescent Mounting Medium. Fluorescence microscopy images were acquired with a Photometrics CoolSNAP FX digital camera and processed using Scanalytics IPLab software and Adobe Photoshop CS2 software. Internal fluorescence was quantified using ImageJ software, n=100, for each time point for each experiment. Exocytosis was measured as a loss of fluorescence at various time points similarly.
The surface-binding assay was carried out similarly. Cells on coverslips were rinsed and incubated in serum-free medium for 30 min and then exposed to 100 μg mL-1 transferrin conjugated with Alexa Fluor 633 in 1% BSA solution on ice for 2 minutes followed by subsequent washes with PBS at pH 7.0. Cells were mounted on slides and imaged on a Zeiss LSM510-Meta confocal microscope.
Cytoplasmic pH was measured using flow cytometry as previously described56. Briefly, cells were incubated with 1μM BCECF-AM (Life Technologies) for 30 min at 37°C, and pH was determined by excitation at 488 nm and emissions filtered through 530 (±15) nm (pH sensitive green fluorescence) and 616 (±12) nm (pH non-sensitive red fluorescence) filters. A pH calibration curve was generated by preloading cells with 1μM BCECF-AM for 30 min followed by incubation in a “high K+” HEPES buffer (25 mM HEPES, 145 mM KCl, 0.8 mM MgCl2, 1.8 mM CaCl2, 5.5 mM glucose), whose pH was adjusted to different values (6.6, 7.0, 7.4, and 7.8) and used to prepare a 4-point calibration curve in the presence of K+/H+ ionophore nigericin (10μM).
Protein Turnover and Western Blotting
Cells were lysed with Nonidet P-40 (1%, Sigma) that included protease inhibitor cocktail (Roche) and then centrifuged for 15 min at 14,000 r.p.m. at 4°C. Cell protein lysates (50-100 μg) were dissolved in loading buffer (62.5 mM Tris-HCl pH 6.8, 10% Glycerol, 2% SDS, 0.01% Bromophenol Blue, 100mM DTT), and separated by SDS-polyacrylamide gel electrophoresis. Antibodies used for western blotting were: Tf Receptor (Abcam ab38171, 1:250); EGFR (Millipore 06-847, 1: 250); p-EGFR, Tyr1068 (Cell Signaling 2234, 1:1000); ERK1/2 (Sigma M 5670, 1:2000); pERK1/2, Thr183 (Sigma M 7802, 1:500); Cyclin D1 (Sigma C 7464, 1:200); AKT (Cell Signaling 9272, 1:1000); and pAKT, Ser 473 (Cell Signaling 4056, 1:1000). Loading controls used were Tubulin (Sigma T 9026, 1:1000) and GAPDH (Sigma G 9295, 1:20,000).
Cells used for degradation assays were plated at 2.5 × 10⁵ cells/well in a 6-well tissue culture dish and allowed to adhere overnight. The following day cells were growth factor starved for 2 hrs in the presence of 50 μM cycloheximide (Sigma). These conditions were maintained for the duration of the experiment. Following, 20 ng mL-1 EGF (PeproTech) was added to the media for the indicated amounts of time. Cells were then chilled on ice, washed with PBS, and protein lysates were collected for immunoblotting. Blots were cropped to show relevant bands.
Cell Surface Biotinylation
For surface biotinylation, cell surface proteins were labeled with biotin as previously described 57. Briefly, cells were washing three times with ice-cold PBS and incubated with 1 mg mL-1 Sulpho-NHS-LC biotin in PBS at 4°C for 20 mins. Excess NHS groups were quenched using 100 mM glycine followed by three washes with PBS. Protein supernatants were mixed with 120 μL of immobilized Neutravidin beads and incubated at 4°C overnight with gentle rotation. Beads collected by centrifugation were washed three times with lysis buffer, and surface proteins labeled with biotin were separated by SDS-PAGE and analyzed by immunoblotting. All blots were cropped to show relevant bands.
Oncomine and CBioPortal Data
Primary source for the GBM expression data on NHE9 obtained from Oncomine was from Lee et al.15. Survival data obtained on the 91 ‘complete’ sequenced tumors through the cBioPortal 58 were from the Glioblastoma project TCGA dataset 13.
Supplementary Material
Acknowledgments
This work was supported by grants from the National Institutes of Health NS070024 (AQH) and DK054214 and GM62142 (RR). KCK was supported by an American Heart Association postdoctoral fellowship (11POST7380034), JP received support from the Johns Hopkins PREP program, HP was a Fulbright Fellow supported by the International Fulbright Science and Technology Award, and AH was a Porter fellow of the American Physiological Society.
Footnotes
END NOTES: Competing financial interests: The authors declare no competing financial interests.
Author Contributions: The authors report no conflict of interest. KCK and JP conceived and performed all in vitro experiments with GBM 276 and 612; VC-G performed the mouse xenograft experiments; HP performed bioinformatics analysis; HP and AH did in vitro experiments with GBM 253; JP, CS and HG-C performed BTIC migration on nanopatterned surfaces; KCK, JP and RR wrote the manuscript with edits from VC-G, HG-C and AQ-H; AQ-H and RR provided funding and oversight for the project.
References
- 1.Chaichana KL, et al. Factors involved in maintaining prolonged functional independence following supratentorial glioblastoma resection. Clinical article. Journal of neurosurgery. 2011;114:604–612. doi: 10.3171/2010.4.JNS091340. [DOI] [PMC free article] [PubMed] [Google Scholar]
- 2.Garzon-Muvdi T, et al. Regulation of brain tumor dispersal by NKCC1 through a novel role in focal adhesion regulation. PLoS biology. 2012;10:e1001320. doi: 10.1371/journal.pbio.1001320. [DOI] [PMC free article] [PubMed] [Google Scholar]
- 3.Agudelo-Garcia PA, et al. Glioma cell migration on three-dimensional nanofiber scaffolds is regulated by substrate topography and abolished by inhibition of STAT3 signaling. Neoplasia. 2011;13:831–840. doi: 10.1593/neo.11612. [DOI] [PMC free article] [PubMed] [Google Scholar]
- 4.Stupp R, et al. Radiotherapy plus concomitant and adjuvant temozolomide for glioblastoma. N Engl J Med. 2005;352:987–996. doi: 10.1056/NEJMoa043330. [DOI] [PubMed] [Google Scholar]
- 5.Watkins S, Sontheimer H. Unique biology of gliomas: challenges and opportunities. Trends in neurosciences. 2012;35:546–556. doi: 10.1016/j.tins.2012.05.001. [DOI] [PMC free article] [PubMed] [Google Scholar]
- 6.Kondapalli KC, et al. Functional evaluation of autism-associated mutations in NHE9. Nat Commun. 2013;4:2510. doi: 10.1038/ncomms3510. [DOI] [PMC free article] [PubMed] [Google Scholar]
- 7.Kondapalli KC, Prasad H, Rao R. An Inside Job: How Endosomal Na+/H+ Exchangers Link to Autism and Neurological Disease. Frontiers in Cellular Neuroscience. 2014;8 doi: 10.3389/fncel.2014.00172. [DOI] [PMC free article] [PubMed] [Google Scholar]
- 8.Morrow EM, et al. Identifying autism loci and genes by tracing recent shared ancestry. Science. 2008;321:218–223. doi: 10.1126/science.1157657. [DOI] [PMC free article] [PubMed] [Google Scholar]
- 9.Di Domenico F, et al. Expression of human papilloma virus type 16 E5 protein in amelanotic melanoma cells regulates endo-cellular pH and restores tyrosinase activity. Journal of experimental & clinical cancer research : CR. 2009;28:4. doi: 10.1186/1756-9966-28-4. [DOI] [PMC free article] [PubMed] [Google Scholar]
- 10.Suprynowicz FA, et al. The human papillomavirus type 16 E5 oncoprotein inhibits epidermal growth factor trafficking independently of endosome acidification. Journal of virology. 2010;84:10619–10629. doi: 10.1128/JVI.00831-10. [DOI] [PMC free article] [PubMed] [Google Scholar]
- 11.Chakravarti A, Dicker A, Mehta M. The contribution of epidermal growth factor receptor (EGFR) signaling pathway to radioresistance in human gliomas: a review of preclinical and correlative clinical data. International journal of radiation oncology, biology, physics. 2004;58:927–931. doi: 10.1016/j.ijrobp.2003.09.092. [DOI] [PubMed] [Google Scholar]
- 12.Rhodes DR, et al. ONCOMINE: a cancer microarray database and integrated data-mining platform. Neoplasia. 2004;6:1–6. doi: 10.1016/s1476-5586(04)80047-2. [DOI] [PMC free article] [PubMed] [Google Scholar]
- 13.Network TC. Corrigendum: Comprehensive genomic characterization defines human glioblastoma genes and core pathways. Nature. 2013;494:506. doi: 10.1038/nature11903. [DOI] [PubMed] [Google Scholar]
- 14.Network CGAR. Comprehensive genomic characterization defines human glioblastoma genes and core pathways. Nature. 2008;455:1061–1068. doi: 10.1038/nature07385. [DOI] [PMC free article] [PubMed] [Google Scholar]
- 15.Lee J, et al. Tumor stem cells derived from glioblastomas cultured in bFGF and EGF more closely mirror the phenotype and genotype of primary tumors than do serum-cultured cell lines. Cancer cell. 2006;9:391–403. doi: 10.1016/j.ccr.2006.03.030. [DOI] [PubMed] [Google Scholar]
- 16.Verhaak RG, et al. Integrated genomic analysis identifies clinically relevant subtypes of glioblastoma characterized by abnormalities in PDGFRA, IDH1, EGFR, and NF1. Cancer cell. 2010;17:98–110. doi: 10.1016/j.ccr.2009.12.020. [DOI] [PMC free article] [PubMed] [Google Scholar]
- 17.Wen J, et al. Gene expression analysis of pretreatment biopsies predicts the pathological response of esophageal squamous cell carcinomas to neo-chemoradiotherapy. Annals of oncology : official journal of the European Society for Medical Oncology / ESMO. 2014;25:1769–1774. doi: 10.1093/annonc/mdu201. [DOI] [PubMed] [Google Scholar]
- 18.Yim EK, et al. Nanopattern-induced changes in morphology and motility of smooth muscle cells. Biomaterials. 2005;26:5405–5413. doi: 10.1016/j.biomaterials.2005.01.058. [DOI] [PMC free article] [PubMed] [Google Scholar]
- 19.Giese A, Westphal M. Glioma invasion in the central nervous system. Neurosurgery. 1996;39:235–250. doi: 10.1097/00006123-199608000-00001. discussion 250-232. [DOI] [PubMed] [Google Scholar]
- 20.Kim DH, et al. Mechanosensitivity of fibroblast cell shape and movement to anisotropic substratum topography gradients. Biomaterials. 2009;30:5433–5444. doi: 10.1016/j.biomaterials.2009.06.042. [DOI] [PMC free article] [PubMed] [Google Scholar]
- 21.Xinhan L, et al. Na+/H+ exchanger isoform 6 (NHE6/SLC9A6) is involved in clathrin-dependent endocytosis of transferrin. American journal of physiology Cell physiology. 2011;301:C1431–1444. doi: 10.1152/ajpcell.00154.2011. [DOI] [PubMed] [Google Scholar]
- 22.Brennan CW, et al. The somatic genomic landscape of glioblastoma. Cell. 2013;155:462–477. doi: 10.1016/j.cell.2013.09.034. [DOI] [PMC free article] [PubMed] [Google Scholar]
- 23.Barkovich KJ, et al. Kinetics of inhibitor cycling underlie therapeutic disparities between EGFR-driven lung and brain cancers. Cancer discovery. 2012;2:450–457. doi: 10.1158/2159-8290.CD-11-0287. [DOI] [PMC free article] [PubMed] [Google Scholar]
- 24.Orlowski J, Grinstein S. Diversity of the mammalian sodium/proton exchanger SLC9 gene family. Pflugers Arch. 2004;447:549–565. doi: 10.1007/s00424-003-1110-3. [DOI] [PubMed] [Google Scholar]
- 25.Laks DR, et al. Neurosphere formation is an independent predictor of clinical outcome in malignant glioma. Stem Cells. 2009;27:980–987. doi: 10.1002/stem.15. [DOI] [PMC free article] [PubMed] [Google Scholar]
- 26.Webb BA, Chimenti M, Jacobson MP, Barber DL. Dysregulated pH: a perfect storm for cancer progression. Nature reviews Cancer. 2011;11:671–677. doi: 10.1038/nrc3110. [DOI] [PubMed] [Google Scholar]
- 27.Amith SR, Fliegel L. Regulation of the Na+/H+ Exchanger (NHE1) in Breast Cancer Metastasis. Cancer research. 2013;73:1259–1264. doi: 10.1158/0008-5472.CAN-12-4031. [DOI] [PubMed] [Google Scholar]
- 28.Reshkin SJ, Greco MR, Cardone RA. Role of pHi, and proton transporters in oncogene-driven neoplastic transformation. Philosophical transactions of the Royal Society of London Series B, Biological sciences. 2014;369:20130100. doi: 10.1098/rstb.2013.0100. [DOI] [PMC free article] [PubMed] [Google Scholar]
- 29.Cancer Genome Atlas, N. Comprehensive molecular characterization of human colon and rectal cancer. Nature. 2012;487:330–337. doi: 10.1038/nature11252. [DOI] [PMC free article] [PubMed] [Google Scholar]
- 30.Picelli S, et al. Genome-wide linkage scan for colorectal cancer susceptibility genes supports linkage to chromosome 3q. BMC cancer. 2008;8:87. doi: 10.1186/1471-2407-8-87. [DOI] [PMC free article] [PubMed] [Google Scholar]
- 31.Ng D, et al. Replication of a genome-wide case-control study of esophageal squamous cell carcinoma. International journal of cancer Journal international du cancer. 2008;123:1610–1615. doi: 10.1002/ijc.23682. [DOI] [PMC free article] [PubMed] [Google Scholar]
- 32.Onishi I, et al. Organellar (Na+, K+)/H+ exchanger NHE7 regulates cell adhesion, invasion and anchorage-independent growth of breast cancer MDA-MB-231 cells. Oncology reports. 2012;27:311–317. doi: 10.3892/or.2011.1542. [DOI] [PubMed] [Google Scholar]
- 33.Brett CL, Donowitz M, Rao R. Evolutionary origins of eukaryotic sodium/proton exchangers. American journal of physiology Cell physiology. 2005;288:C223–239. doi: 10.1152/ajpcell.00360.2004. [DOI] [PubMed] [Google Scholar]
- 34.Brett CL, Wei Y, Donowitz M, Rao R. Human Na(+)/H(+) exchanger isoform 6 is found in recycling endosomes of cells, not in mitochondria. American journal of physiology Cell physiology. 2002;282:C1031–1041. doi: 10.1152/ajpcell.00420.2001. [DOI] [PubMed] [Google Scholar]
- 35.Nakamura N, Tanaka S, Teko Y, Mitsui K, Kanazawa H. Four Na+/H+ exchanger isoforms are distributed to Golgi and post-Golgi compartments and are involved in organelle pH regulation. J Biol Chem. 2005;280:1561–1572. doi: 10.1074/jbc.M410041200. [DOI] [PubMed] [Google Scholar]
- 36.Bowers K, Levi BP, Patel FI, Stevens TH. The sodium/proton exchanger Nhx1p is required for endosomal protein trafficking in the yeast Saccharomyces cerevisiae. Mol Biol Cell. 2000;11:4277–4294. doi: 10.1091/mbc.11.12.4277. [DOI] [PMC free article] [PubMed] [Google Scholar]
- 37.Kalman B, Szep E, Garzuly F, Post DE. Epidermal growth factor receptor as a therapeutic target in glioblastoma. Neuromolecular medicine. 2013;15:420–434. doi: 10.1007/s12017-013-8229-y. [DOI] [PubMed] [Google Scholar]
- 38.Miettinen PJ, et al. Epithelial immaturity and multiorgan failure in mice lacking epidermal growth factor receptor. Nature. 1995;376:337–341. doi: 10.1038/376337a0. [DOI] [PubMed] [Google Scholar]
- 39.Luetteke NC, et al. The mouse waved-2 phenotype results from a point mutation in the EGF receptor tyrosine kinase. Genes & development. 1994;8:399–413. doi: 10.1101/gad.8.4.399. [DOI] [PubMed] [Google Scholar]
- 40.Weihua Z, et al. Survival of cancer cells is maintained by EGFR independent of its kinase activity. Cancer cell. 2008;13:385–393. doi: 10.1016/j.ccr.2008.03.015. [DOI] [PMC free article] [PubMed] [Google Scholar]
- 41.Pozo N, et al. Inhibition of DYRK1A destabilizes EGFR and reduces EGFR-dependent glioblastoma growth. The Journal of clinical investigation. 2013;123:2475–2487. doi: 10.1172/JCI63623. [DOI] [PMC free article] [PubMed] [Google Scholar]
- 42.Ying H, et al. Mig-6 controls EGFR trafficking and suppresses gliomagenesis. Proc Natl Acad Sci U S A. 2010;107:6912–6917. doi: 10.1073/pnas.0914930107. [DOI] [PMC free article] [PubMed] [Google Scholar]
- 43.Mao F, et al. A role for LRIG1 in the regulation of malignant glioma aggressiveness. International journal of oncology. 2013;42:1081–1087. doi: 10.3892/ijo.2013.1776. [DOI] [PubMed] [Google Scholar]
- 44.Ye F, et al. Upregulation of LRIG1 suppresses malignant glioma cell growth by attenuating EGFR activity. Journal of neuro-oncology. 2009;94:183–194. doi: 10.1007/s11060-009-9836-1. [DOI] [PubMed] [Google Scholar]
- 45.Knutson MD, Leeuwenburgh C. Resveratrol and novel potent activators of SIRT1: effects on aging and age-related diseases. Nutrition reviews. 2008;66:591–596. doi: 10.1111/j.1753-4887.2008.00109.x. [DOI] [PubMed] [Google Scholar]
- 46.Yang YP, et al. Resveratrol suppresses tumorigenicity and enhances radiosensitivity in primary glioblastoma tumor initiating cells by inhibiting the STAT3 axis. Journal of cellular physiology. 2012;227:976–993. doi: 10.1002/jcp.22806. [DOI] [PubMed] [Google Scholar]
- 47.Oberdoerffer P, et al. SIRT1 redistribution on chromatin promotes genomic stability but alters gene expression during aging. Cell. 2008;135:907–918. doi: 10.1016/j.cell.2008.10.025. [DOI] [PMC free article] [PubMed] [Google Scholar]
- 48.Stommel JM, et al. Coactivation of receptor tyrosine kinases affects the response of tumor cells to targeted therapies. Science. 2007;318:287–290. doi: 10.1126/science.1142946. [DOI] [PubMed] [Google Scholar]
- 49.Zhang L, Strouthos CG, Wang Z, Deisboeck TS. Simulating Brain Tumor Heterogeneity with a Multiscale Agent-Based Model: Linking Molecular Signatures, Phenotypes and Expansion Rate. Mathematical and computer modelling. 2009;49:307–319. doi: 10.1016/j.mcm.2008.05.011. [DOI] [PMC free article] [PubMed] [Google Scholar]
- 50.Athale CA, Deisboeck TS. The effects of EGF-receptor density on multiscale tumor growth patterns. Journal of theoretical biology. 2006;238:771–779. doi: 10.1016/j.jtbi.2005.06.029. [DOI] [PubMed] [Google Scholar]
- 51.Li Y, et al. c-Met signaling induces a reprogramming network and supports the glioblastoma stem-like phenotype. Proc Natl Acad Sci U S A. 2011;108:9951–9956. doi: 10.1073/pnas.1016912108. [DOI] [PMC free article] [PubMed] [Google Scholar]
- 52.Tzeng SY, et al. Non-viral gene delivery nanoparticles based on poly(beta-amino esters) for treatment of glioblastoma. Biomaterials. 2011;32:5402–5410. doi: 10.1016/j.biomaterials.2011.04.016. [DOI] [PMC free article] [PubMed] [Google Scholar]
- 53.Pollard SM, et al. Glioma stem cell lines expanded in adherent culture have tumor-specific phenotypes and are suitable for chemical and genetic screens. Cell stem cell. 2009;4:568–580. doi: 10.1016/j.stem.2009.03.014. [DOI] [PubMed] [Google Scholar]
- 54.Riss TL, M R, Niles AL, Benink HA, Worzella TJ, Minor L. In: Assay Guidance Manual. Gal-Edd N, Sittampalam GS, Arkin M, Auld D, Austin C, Bejcek B, Glicksman M, Inglese J, Lemmon V, Li Z, McGee J, McManus O, Minor L, Napper A, Riss T, Trask OJ, Weidner J, editors. Eli Lilly & Company and the National Center for Advancing Translational Sciences; Bethesda (MD): 2013. May 1, [Google Scholar]
- 55.Guerrero-Cazarez H, Attenello F, Noiman L, Quiñones-Hinojosa A. Stem cells in gliomas. Elsevier; 2011. [DOI] [PubMed] [Google Scholar]
- 56.Franck P, et al. Measurement of intracellular pH in cultured cells by flow cytometry with BCECF-AM. J Biotechnol. 1996;46:187–195. doi: 10.1016/0168-1656(95)00189-1. [DOI] [PubMed] [Google Scholar]
- 57.Ohgaki R, Fukura N, Matsushita M, Mitsui K, Kanazawa H. Cell surface levels of organellar Na+/H+ exchanger isoform 6 are regulated by interaction with RACK1. J Biol Chem. 2008;283:4417–4429. doi: 10.1074/jbc.M705146200. [DOI] [PubMed] [Google Scholar]
- 58.Gao J, et al. Integrative analysis of complex cancer genomics and clinical profiles using the cBioPortal. Science signaling. 2013;6:pl1. doi: 10.1126/scisignal.2004088. [DOI] [PMC free article] [PubMed] [Google Scholar]
Associated Data
This section collects any data citations, data availability statements, or supplementary materials included in this article.