

Abstract
Liquid chromatography–mass spectrometry (LC-MS) technology allows for rapid quantitation of cellular metabolites, with metabolites identified by mass spectrometry and chromatographic retention time. Recently, with the development of rapid scanning high-resolution high accuracy mass spectrometers and the desire for high throughput screening, minimal or no chromatographic separation has become increasingly popular. When analyzing complex cellular extracts, however, the lack of chromatographic separation could potentially result in misannotation of structurally related metabolites. Here, we show that, even using electrospray ionization, a soft ionization method, in-source fragmentation generates unwanted byproducts of identical mass to common metabolites. For example, nucleotide-triphosphates generate nucleotide-diphosphates, and hexose-phosphates generate triose-phosphates. We evaluated yeast intracellular metabolite extracts and found more than 20 cases of in-source fragments that mimic common metabolites. Accordingly, chromatographic separation is required for accurate quantitation of many common cellular metabolites.
The comprehensive analysis of small molecule metabolites from a complex biological extract is a technical challenge. The ideal analytical platform should be able to analyze a broad range of metabolites with good sensitivity and selectivity to avoid false discoveries.1 Liquid chromatography, coupled with mass spectrometry (LC-MS), has proven to be a powerful tool for metabolomic analysis.2-13 For water-soluble metabolites, we and others have developed effective analytical methods that utilize hydrophilic interaction chromatography (HILIC), reversed phase ion pairing chromatography, or other separation approaches coupled by ESI to MS/MS or high resolution MS.14-26
One key aspect of metabolomics analysis involves the annotation of a LC-MS feature to the corresponding metabolite. The LC-MS feature involves retention time on the LC column and mass spectrometry fragments in multiple reaction monitoring (MRM) mode or accurate mass in full scan mode. Recently, with the development of the high resolving power and fast scan speed mass spectrometers, compounds with small mass differences can be discriminated and rapidly quantitated. Due to these features, MS or MS/MS platforms with no or minimal LC separation have been developed, such as Agilent RapidFire high-throughput MS systems and other systems using very short chromatographic runs.27-35 These platforms advantageously enable high-throughput screening. A well-known disadvantage is the inability to resolve structural isomers effectively. For example, glucose-6-phosphate, fructose-6-phosphate, and glucose-1-phosphate are structural isomers, and their discrimination generally requires effective chromatographic separation due to identical parent ion mass and similar MS/MS fragmentation behavior.
In-source fragmentation can result in related problems. In-source fragmentation or collision induced dissociation (CID) occurs at the intermediate pressure region between the atmospheric pressure ion source and the vacuum chamber of a mass spectrometer.36-39 The extent of in-source fragmentation depends on the ion source. Electrospray ionization (ESI) is a type of atmospheric ionization mode which manifests the “softest ionization”40-42 and thus is widely applied in metabolomics and proteomics. Here, we examined isomers and in-source fragmentation in a LC-ESI-MS-based metabolomics platform. We provide methods that resolve several common isomers. Particularly interestingly, we found a surprisingly high number of cases where in-source fragments mimic common cellular metabolites. For example, ions of identical mass to the short-chain sugar phosphates “glycer-aldehyde-3-phosphate” and “erythrose-4-phosphate” could be produced via in-source fragmentation of longer chain sugar phosphates such as glucose-6-phosphate and sedoheptulose-7-phosphate. Because these structurally similar compounds often elute at similar chromatographic retention times, the lower molecular weight analytes are easily misannotated and misquantitated. Thus, an effective upfront chromatographic separation and careful annotation are essential for correctly measuring these compounds. Here, we provide a detailed account of these metabolites and approaches to avoid misannotation of both isomers and in-source fragments.
EXPERIMENTAL SECTION
Chemicals, Reagents, and Media Components
HPLC-grade water, acetonitrile, and methanol were Optima LC-MS grade obtained from ThermoFisher Scientific (San Jose, CA). The majority of the metabolite standards, as well as tributylamine, acetic acid, and all media components, were obtained through Sigma-Aldrich (St. Louis, MO). U-13C-Glucose (99%) and 1,2-13C2-glucose were obtained from Cambridge Isotope Laboratories (Andover, MA).
Yeast Strains, Culture Condition, and Extraction
Yeast strains were derived from prototrophic S288C. Cells were grown in minimal media comprising 6.7 g/L Difco Yeast Nitrogen Base without amino acids plus 2% (w/v) glucose. Yeast FBA knockdown strain (FBA-DAmP allele)43 was a general gift from Prof. Amy Caudy.
The metabolome of batch culture Saccharomyces cerevisiae was characterized as described previously.44 Briefly, saturated overnight cultures were diluted 1:30 and grown in liquid media in a shaking flask to A600 of ~0.6. A portion of the cells (3 mL) was filtered onto a 50 mm nylon membrane filter (Millipore, Billerica, MA) resting on a vacuum filter support. Once cells were loaded, the membrane filter was immediately transferred into precooled Petri dishes with −20 °C extraction solvent (40:40:20 acetonitrile/methanol/water). The Petri dish was then kept at −20 °C for 30 min to allow complete quenching and extraction. To collect the metabolite extract, the filter (now with cell debris) was thoroughly washed by the liquid in the Petri dish and the resulting mixture was transferred into an Eppendorf tube and spun down. A portion of the supernatant (400 μL) was dried under nitrogen gas, resuspended in 200 μL of HPLC grade water, and analyzed on LC-MS.
For glucose upshift, 100 mL of cell culture grown on trehalose at A600 of ~0.6 was poured onto a 100 mm cellulose acetate membrane filter (Sterlitech, Kent, WA) resting on a vacuum filter holder with a 1000 mL funnel (Kimble Chase, Vineland, NJ) and was washed with 100 mL of prewarmed (30 °C) glucose minimal medium. Immediately after the wash media went through, the filter was taken off the holder and the cells were washed into a new flask containing 100 mL of prewarmed (30 °C) glucose minimal medium. Samples were then taken at 5 min after the switch and filtered and quenched as described above.
LC-MS Analysis
Method A: UPLC-MS (Exactive)-Based Untargeted Metabolomics Being Tested Throughout This Study
The high resolution LC-MS metabolomics platform was built as previously described. Briefly, it consists of an Accela U-HPLC system with quaternary pumps, an HTC PAL autosampler, and an Exactive Orbitrap mass spectrometer (ThermoFisher Scientific, San Jose, CA), controlled by Xcalibur 2.1 software. Liquid chromatography separation was achieved on a Synergy Hydro-RP column (100 mm × 2 mm, 2.5 μm particle size, Phenomenex, Torrance, CA), using reversed-phase chromatography with the ion pairing agent tributylamine in the aqueous mobile phase to enhance retention and separation.10,15,45 The present LC method is an updated version of a method previously described by our lab.16 The total run time is 20 min (versus 25 min for the original method). Solvent A is 97:3 water/methanol with 10 mM tributylamine and 15 mM acetic acid; solvent B is methanol. The gradient is 0 min, 0% B, flow rate 200 μL/min; 2.5 min, 0% B, flow rate 200 μL/min; 5 min, 20% B, flow rate 250 μL/min; 12 min, 95% B, flow rate 250 μL/min; 14.5 min, 95% B, flow rate 250 μL/min; 15 min, 0% B, flow rate 250 μL/min; 19 min, 0% B, flow rate 200 μL/min; 20 min, 0% B, flow rate 200 μL/min. Scan range is m/z 75–1000 in negative ion mode at a frequency of 1 Hz.
Method B: LC (HILIC)-MS/MS Method for 2-Aminobutyrate and 4-Aminobutyrate
2-Aminobutyrate and 4-aminobutyrate are not separated by the reversed phase ion pairing chromatography method. They were separated by a modified HILIC method on an aminopropyl column, Luna 5 μm NH2 100A, 250 × 2 mm (Phenomenex, Torrance, CA), with an acidic buffer system.14 The gradient used was as follows: t = 0 min, 85% B; t = 15 min, 0% B; t = 28 min, 0% B; t = 30 min, 85% B; t = 40 min, 85% B. Solvent A is 98:2 H2O/acetonitrile with 10 mM ammonium acetate + 0.1% acetic acid. Solvent B is acetonitrile. The flow rate is 150 μL/min. Under this chromatography condition, 2-aminobutyrate elutes at 13.3 min while 4-aminobutyrate elutes at 14.5 min. Furthermore, the two isomers can be differentially quantitated by MS/MS (selected reaction monitoring, SRM) fragments on a triple quadrupole mass spectrometer. 2-Aminobutyrate has a specific SRM of m/z 104 → 58 at 11 eV, while 4-mainobutyrate has a specific SRM of m/z 104 → 69 at 20 eV.
Method C: LC (Slow Gradient HILIC)-MS/MS Method for Leucine and Isoleucine
Leucine and isoleucine are not separated on our reversed-phase ion pairing chromatography method. Their MS/MS fragmentation patterns are similar to the strongest fragments, m/z 86 at 10 eV. Isoleucine does have a specific SRM of m/z 132 → 69 at 11 eV, but its intensity is ~10 times smaller than the main SRM of 132 → 86 at 10 eV. Chromatographically, Pesek et al. recently demonstrated the possibility of using an aqueous normal phase mode for the separation of 19 amino acids, on a silica hydride-based stationary phase.24 Here, separation of leucine/isoleucine was achieved by a slow gradient using the same HILIC column and acidic mobile phase as above. The gradient is 0 min, 85% B; 2 min, 85% B; 3 min, 80% B; 5 min, 80% B; 6 min, 75% B; 7 min, 75% B; 8 min, 70% B; 9 min, 70% B; 10 min, 50% B; 11 min, 50% B; 12 min, 25% B; 13 min, 25% B; 14 min, 0% B; 20 min, 0% B; 22 min, 85% B; 30 min, 85% B. The flow rate is 200 μL/min. Solvent A is 98:2 H2O/acetonitrile with 10 mM ammonium acetate + 0.1% acetic acid. Solvent B is acetonitrile.
Validation with Purified Metabolites
Authentic metabolite standards, when available, were used to confirm the metabolite identity. For each purified metabolite, stock solution at a concentration of ≥0.1 mg/mL was prepared in 50:50 methanol/water and stored at −80 °C. From these stock solutions, metabolite solution was further diluted in water at 1, 5, 20, 100, 500, and 2000 ng/mL and analyzed.
RESULTS AND DISCUSSION
Separating Structural Isomers by Chromatography
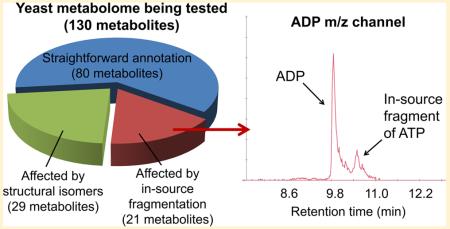
We used freshly generated intracellular metabolite extract of Saccharomyces cerevisiae and high-resolution UPLC-ESI-MS (Thermo “Exactive”, Method A) to test the annotation correctness of common water-soluble metabolites. We were able to detect and match the retention time of ~130 intracellular metabolites, including central metabolism intermediates, amino acids, and nucleotides, and their synthetic/degradative pathway intermediates/products, energy charge compounds, and important cofactors.
Structural isomers have the same exact mass and thus cannot be discriminated by a single mass spectrometry step. Accordingly, an orthogonal separation approach such as chromatography is valuable. Table S-1, Supporting Information, lists common isomers which could be detected in yeast metabolome. For each group, we ran an authenticated standard for all the compounds and recorded chromatographic retention time.
Several groups of isomers were of special interest due to their importance in central metabolism. Sugar phosphates with the same number of carbons are usually structural isomers. For hexose-phosphates, glucose-6-phosphate, fructose-6-phosphate, and glucose-1-phosphate are the most common structural isomers. The most abundant and best quantifiable fragment of all of these hexose-phosphates is phosphate anion. Thus, fragmentation is of limited value in quantitating these metabolites. However, by running internal standards and comparing their retention time to that of the metabolite extract, we found glucose-6-phosphate separates as the first peak in our 20 min chromatogram run (Figure S-1A, Supporting Information). Fructose-6-phosphate is the second largest peak, but the right part of the peak might also be mixed with small quantities of glucose-1-phosphate. Furthermore, another unannotated peak with the same m/z ratio was present at the rightmost end of the hexose-phosphate channel. For pentose-phosphates, ribose-5-phosphate separates as the left-most peak on our chromatogram. Xylulose-5-phosphate and ribulose-5-phosphate cannot be separated and make up the second peak, and another peak at the right was not readily annotated (Figure S-1B, Supporting Information).
To obtain the identity of these unannotated metabolites, we labeled yeast cells with 13C and 15N nutrients and found no shift from nitrogen labeling and a shift of +6 and +5 from carbon labeling (Figure S-1C, Supporting Information).46 Exact masses of these compounds matched putative formulas of C6H13O9P1 and C5H11O8P1, indicating that they indeed belong to hexose-phosphate and pentose-phosphate, respectively. Other than the common hexose- and pentose-phosphates discussed above, we found fructose-1-phosphate and ribose-1-phosphate in the KEGG database. We ran their standards and found that the rightmost peak in the hexose-phosphate channel matched the retention time of fructose-1-phosphate and the rightmost peak in the pentose-phosphate channel matched the retention time of ribose-1-phosphate. We have recently shown that ribose-1-phosphate is an intermediate in the ribose salvage pathway.47 This is the first report of fructose-1-phosphate in yeast, and its physiological function is now under investigation in our lab.
Although reversed phase ion pairing chromatography allows separation of many structural isomers, isomers of amino acids and their derivatives are poorly separated. This is because these polar compounds elute near void volume on reversed phase and do not separate well even in the presence of ion pairing regent. Thus, alternative chromatography and/or mass spectrometry approaches are needed. We found that hydrophilic interaction chromatography (HILIC) and/or compound-specific MS/MS fragments can effectively separate certain amino acid isomers. For example, 2-aminobutyrate and 4-aminobutyrate were separated by a modified HILIC method on an aminopropyl column and also by specific MS/MS fragments on a triple quadrupole mass spectrometer (Figure S-1D, Supporting Information, Method B). Leucine and isoleucine were separated by a slow HILIC gradient with acidic mobile phase (Figure S-1E, Supporting Information, Method C).
In-Source Fragmentation Generates Ions That Mimic Common Metabolites
When analyzing a mixture of metabolites, structural isomers can usually be found in common metabolite databases. Thus, the need for their separation is unlikely to be overlooked. In-source fragmentation, in contrast, can happen unexpectedly and interfere with the measurement of a variety of metabolites. For example, we noticed that the channel for adenosine-diphosphate (ADP) has two peaks in the yeast intracellular metabolite extract sample. The retention time of the left peak matched the pure ADP standard (Figure 1A), while the retention time of the right peak matched the pure ATP standard. Interestingly, when only the pure ATP standard was injected into the instrument, an “ADP” peak also appeared, at the same retention time of ATP and at the same retention time of the right peak in the ADP channel in the yeast intracellular metabolite extract (Figure 1B). This indicates that such a peak is actually the in-source fragmentation product of ATP. To confirm this, we performed a carbon upshift experiment which involves switching yeast cells growing on media using trehalose as the carbon source to media using glucose as the carbon source. Such carbon upshift is known to transiently decrease ATP but not ADP due to the rapid consumption of ATP for glucose phosphorylation.48 Indeed, we found that the ATP level decreased while ADP level slightly increased in yeast after glucose upshift (Figure 1C). The second “ADP” peak, matching the retention time of ATP, also decreased, confirming that this peak is an in-source fragment of ATP. Thus, without chromatographic separation, ADP level will be subject to misquantitation.
Figure 1.

Correct quantitation of ADP requires chromatographic separation. (A) The negative ionization mode-extracted ion chromatogram for U13C-ADP (+10, upper panel) and unlabeled ADP (lower panel). Yeast cells were grown in U13C-glucose, and metabolome was extracted with quenching solution spiked with unlabeled ADP. (B) The negative ionization mode-extracted ion chromatogram for the ADP channel in the ATP standard. The retention time of the “ADP” peak matched the retention time of the ATP standard, indicating that such a peak is an in-source fragment. (C) The negative ionization mode-extracted ion chromatogram for ADP and ATP channels in yeast cells grown on trehalose and 5 min after switching to glucose. Method A has been used throughout this figure.
Upon careful evaluation and annotation of metabolites with similar structures, we found that in-source fragmentation widely exists (Table 1). For example, pyrophosphate anion is formed by the fragmentation of various pyrophosphorylated metabolites, and its real peak has lower intensity than those fragments. Fumarate anion is formed by the malate losing a water molecule. Nucleic acid base anions are formed by the fragmentation of nucleosides, and various short-chain sugar phosphate anions are formed from corresponding longer chain sugar phosphates. We also notice that NADH or NADPH form NAD+ or NADP+ (in the forms of [NAD+-2H]− and [NADP+-2H]−, respectively) likely via their oxidation in the high-temperature ion source. Thus, failure to separate these metabolites by chromatography would result in misquantitation.
Table 1. List of Compounds Subject to Interference from In-Source Fragments, Retention Times, Relative Abundances (from Method A), and Notes Regarding Analysis in Yeast Extracts.
| metabolite | retention time of true metabolite (min) |
ion counts of true metabolite in yeast metabolite extract |
parent metabolite of in- source fragment |
retention time of in-source fragment (min) |
ion counts of in-source fragment in yeast metabolite extract |
notes and solutions |
|---|---|---|---|---|---|---|
| ADP | 9.80 | 1.2 × 10⁵ | ATP | 10.49 | 3.3 × 10⁴ | separated on reversed phase UPLC |
| CDP | 9.44 | 3.3 × 10⁴ | CTP | 10.31 | 8.7 × 10³ | separated on reversed phase UPLC |
| GDP | 9.67 | 1.1 × 10⁵ | GTP | 10.39 | 1.1 × 10⁴ | separated on reversed phase UPLC |
| 6-phosphogluconate | 9.29 | 6.3 × 10⁴ | unknown | 9.23 | 1.2 × 10⁶ | use <5 ppm m/z window |
| N-acetylornitine | 1.30 | 3.7 × 10⁵ | unknown | 1.66 | 4.2 × 10⁵ | separated on reversed phase UPLC |
| NADH | 9.82 | 2.6 × 10⁵ | NAD+ | 7.87 | 2.5 × 10⁴ | separated on reversed phase UPLC |
| NADPH | 10.43 | 6.3 × 10³ | NADP+ | 9.78 | 3.6 × 10³ | separated on reversed phase UPLC |
| UDP | 9.67 | 4.0 × 10⁵ | UDP-glucose | 9.33 | 1.8 × 10⁵ | separated on reversed phase UPLC |
| adenine | 4.60 | <1.0 × 10³ | adenosine | 6.84 | 1.1 × 10⁴ | adenine not quantifiable due to low concentration |
| glyceraldehyde-3- phosphate |
6.93 | <3.5 × 10³ | sedoheptulose-7- phosphate |
6.63 | 2.4 × 10⁴ | usually too low to be quantifiable (see Figures 2 and 3) |
| glucose-6-phosphate | 6.40 | 4.2 × 10⁴ | ||||
| fructose-1,6- bisphosphate |
9.74 | 1.4 × 10⁴ | ||||
| erythrose-4-phosphate | 6.99 | 1.7 × 10⁴ | sedoheptulose-7- phosphate |
6.63 | 6.1 × 10⁴ | usually too low to be quantifiable (see Figures 2 and 3) |
| glucose-6-phosphate | 6.40 | 1.3 × 10⁵ | ||||
| fumarate | 9.72 | <3.0 × 10⁴ | malate | 9.21 | 6.9 × 10⁴ | real fumarate peak is small |
| guanine | 2.43 | 2.0 × 10² | guanosine | 5.12 | 3.0 × 10² | only quantifiable in nutrient depleted condition |
| hypoxanthine | 2.33 | 5.0 × 10² | inosine | 2.98 | 1.7 × 10³ | only quantifiable in nutrient depleted condition |
| ornithine | 1.05 | 5.7 × 10⁵ | citrulline | 1.26 | 1.4 × 10⁶ | separated on reversed phase UPLC |
| phosphoenolpyruvate | 9.87 | 2.5 × 10³ | 3-phosphoglycerate | 9.41 | 5.0 × 10² | separated on reversed phase UPLC |
| diphosphoglycerate | 10.39 | 2.7 × 10⁴ | ||||
| pyrophosphate | 9.77 | 5.9 × 10⁴ | many | many | many | separated on reversed phase UPLC |
| shikimate-3-phosphate | N/A | N/A | unknown | 6.69 | 1.7 × 10⁴ | too low to quantitate |
| trehalose | 1.35 | 5.7 × 10⁴ | unknown | 1.14 | 2.1 × 10⁴ | separated on reversed phase UPLC |
| trehalose-6-phosphate | 6.53 | 7.3 × 10⁴ | unknown | 6.26 | 1.7 × 10⁴ | separated on reversed phase UPLC |
| uracil | 1.77 | 2.6 × 10² | uridine | 2.47 | 1.4 × 10³ | only quantifiable in nutrient depleted condition |
Shorter Chain Sugar Phosphates Are Easily Subject to Misannotation and Misquantitation
For shorter chain sugar phosphates, e.g., triose-phosphates, we also observed several peaks in their ion-specific chromatograms. We ran standards of the triose-phosphates glyceraldehyde-3-phosphate and dihydroxyacetone-phosphate and observed a perfect retention time match to dihydroxyacetone-phosphate but some ambiguity with glyceraldehyde-3-phosphate (doublet peak in extract but singlet with standard) (Figure 2A). To resolve this ambiguity, we turned to a biological experiment: knockdown of the metabolic enzyme fructose-bisphosphate aldolase (FBA) that makes both glyceraldehyde-3-phosphate and dihydroxyacetone-phosphate. Knockdown of FBA differentially impacted the left and right triose-phosphate peaks. The intensity of the right peak (dihydroxyacetone-phosphate) in the FBA knockdown strain was substantially lower as expected, while the intensity of the left peaks was not (Figure 2C). Further examination revealed that the left peaks matched the retention time of glucose-6-phosphate and sedoheptulose-7-phosphate, respectively. This indicates that these peaks might be the in-source fragmentation products of the longer chain sugar phosphates. Indeed, when running pure glucose-6-phosphate and sedoheptulose-7-phosphate standards, we also observed “glyceraldehyde-3-phosphate” peaks in the triose-phosphate channel, whose retention time exactly matched the “glyceraldehyde-3-phosphate” peaks observed in the yeast intracellular metabolite extract sample (Figure 2B).
Figure 2.

Glyceraldehyde-3-phosphate peak is masked by in-source fragments of glucose-6-phosphate and sedoheptulose-7-phosphate. (A) The negative ionization mode-extracted ion chromatogram for U13C-triose-phosphate (+3, upper panel) and unlabeled triose-phosphate (lower panel). Yeast cells were grown in U13C-glucose, and metabolome was extracted with quenching solution spiked with unlabeled glyceraldehyde-3-phosphate (GAP). (B) The negative ionization mode-extracted ion chromatogram for “triose-phosphate” peaks in the glucose-6-phosphate and sedoheptulose-7-phosphate standards. Glucose-6-phosphate (upper panel) and a mixture of glucose-6-phosphate and sedoheptulose-7-phosphate standards (lower panel) were analyzed by LC-MS. The retention time of the “triose-phosphate” peaks matched glucose-6-phosphate and sedoheptulose-7-phosphate standards, indicating that they are in-source fragments. (C) The negative ionization mode-extracted ion chromatogram for triose-phosphate, glucose-6-phosphate, and sedoheptulose-7-phosphate channels in wild type and FBA knockdown yeast cells. Wild type and FBA knockdown yeast cells were grown to exponential phase, and their metabolome was extracted and analyzed by LC-MS. Method A has been used throughout this figure.
While some sugar-phosphates such as fructose-1,6-bisphosphate or fructose-6-phosphate can be enzymatically fragmented into two triose species, the fragmentation reaction of glucose-6-phosphate into glyceraldehyde-3-phosphate is not known enzymatically. Thus, we hypothesized that such fragmentation is unspecific and can happen to any C–C bond on the glucose backbone (Scheme S-1, Supporting Information). Indeed, in the pure glucose-6-phosphate standard sample, we also observed peaks at the same retention time in the pentose-phosphate (e.g., ribose-5-phosphate), tetrose-phosphate (e.g., erythrose-4-phosphate), and diose-phosphate (e.g., glycolaldehyde-phosphate) channels. Such fragmentation can result in misquantitation of many short-chain sugar phosphates.
To confirm that the leftmost triose-phosphate peak in cell extracts is indeed an in-source fragment of glucose-6-phosphate, we labeled yeast cells with 1,2-13C2-glucose. Such labeling gives intracellular 1,2-13C2-glucose-6-phosphate and 1,2-13C2-fructose-1,6-bisphosphate (Figure 3A). Although the breakdown of 1,2-13C2-fructose-1,6-bisphosphate gives 1,2-13C2-dihydroxyacetone-phosphate and unlabeled glyceraldehyde-3-phosphate, triose-phosphate isomerase activity generates both 1,2-13C2-glyceraldehyde-3-phosphate and unlabeled dihydroxyacetone phosphate. We indeed observed nearly 50:50 1,2-13C2/unlabeled dihydroxyacetone-phosphate (Figure 3B, right panels). However, there was only unlabeled “glyceraldehyde-3-phosphate” (Figure 3C, left panels). This confirms that the “glyceraldehyde-3-phosphate” peak is indeed the in-source fragment from C4 to C6 of glucose-6-phosphate and that the real glyceraldehyde-3-phosphate peak has small abundance and is masked.
Figure 3.

Confirmation via isotope labeling that the putative glyceraldehyde-3-phosphate peak is from in-source fragmentation. (A) Schematic of upper glycolytic intermediates in yeast cells grown on 1,2-13C2-glucose. (B). The negative ionization mode-extracted ion chromatogram for unlabeled and 13C2 hexose-phosphate and triose-phosphate channels. Dihydroxyacetone-phosphate (DHAP) shows up in both unlabeled and 13C2 channels, but the leftmost “triose-phosphate” peak only shows up in the unlabeled channel, confirming that this peak is the in-source fragmentation of the last three carbons of glucose-6-phosphate. Method A has been used throughout this figure.
The above examples indicate that annotation of small metabolites by matching their retention time to their standards is not always enough. The results may be unreliable if the standards of small metabolites and their parent metabolite (e.g., glyceraldehyde-3-phosphate, erythrose-4-phosphate, and glucose-6-phosphate) are analyzed together. One way to resolve this issue, while relying only on MS1, is to analyze each standard one by one, looking for possible in-source fragments, noting those in-source fragments that mimic other compounds being studied, and confirming chromatographic separation between the compounds of interest and any in-source fragments mimicking them. To identify likely in-source fragments, we developed a “Fragments and Adducts” function in the Metabolomics Analysis and Visualization Engine (MAVEN) software. The function identifies likely fragments and adducts based on chromatographic coelution, peak shape similarity, and correlation in peak intensities across samples.49 When full-scan MS2 is available, the MS2 spectrum of the higher molecular weight metabolite will typically reveal the complete set of relevant fragments. Such peaks at the relevant retention time in lower m/z MS1 spectra should alert the user that they are likely fragments of the higher molecular weight species, not parent peaks. One can envision automated bioinformatics methods, using logic similar to decoMS2, for mining combined MS1 and MS2 data to issue alerts or even automatically annotate MS1 peaks corresponding to fragments.50 To further confirm the identities of metabolites in biological extracts, it is valuable to use isotopic labels (especially positional labels that are unlikely to similarly labeled potential interfering compounds) and biological perturbations that are known to manipulate specifically the concentration of the selected metabolites.
CONCLUSION
The high throughput metabolomics allows measurement of many metabolite-associated m/z peaks, with short runs with minimal or no chromatographic separation. The complexity of biological samples, however, renders metabolite annotation and data analysis challenging. Here, we demonstrate that, for the 130 water-soluble intracellular metabolites that we routinely monitor in yeast extracts, more than one-third need particular attention to separate structural isomers (29 metabolites affected) or in-source fragments (21 metabolites affected). Even using the softest ionization method, electrospray ionization, in-source fragmentation widely exists and could generate unexpected misquantitation of important metabolites. Although metabolite annotation studies have been published previously, they usually only contain the information for the correct target metabolites. Because chromatographic retention time can shift slightly from run to run and interfering peaks often elute close to targeted ones, developing a database archive for both targeted and artifact peaks is essential to avoid misannotation and misquantitation. Fragmentation typically does not lead to substantial misquantitation of the metabolite generating the fragment but, instead, of a lower molecular weight and less abundant metabolite, for which the fragment is mistaken. Thus, we remain comfortable relying solely on the parent ion peak for quantitation, with the key challenges of identifying the correct parent ion peak for each metabolite and ensuring that this peak is adequately separated from interfering ones.
Supplementary Material
ACKNOWLEDGMENTS
We thank the whole Rabinowitz lab for helpful input and discussions. Particularly, we thank Marshall Reaves, Daniel Amador-Noguez, John Purdy, Xiaoyang Su, and Jing Fan for helpful input. This research was funded by DOE Grants DE-SC0006839 and DE-SC0012461 and NIH Grants 2P30DK019525-36, 1R01CA163591-01A1, and 1R01AI097382.
Footnotes
ASSOCIATED CONTENT
Table S-1, list of structural isomers, retention times, relative abundances (from Method A), and suggested methods of separation. Scheme S-1, glyceraldehyde-3-phosphate as a fragment of glucose-6-phosphate. Figure S-1, separation of structural isomers by chromatography. This material is available free of charge via the Internet at http://pubs.acs.org.
The authors declare no competing financial interest.
REFERENCES
- (1).Kuehnbaum NL, Britz-McKibbin P. Chem. Rev. 2013;113:2437–2468. doi: 10.1021/cr300484s. [DOI] [PubMed] [Google Scholar]
- (2).Milne SB, Mathews TP, Myers DS, Ivanova PT, Brown HA. Biochemistry. 2013;52:3829–3840. doi: 10.1021/bi400060e. [DOI] [PMC free article] [PubMed] [Google Scholar]
- (3).Theodoridis G, Gika HG, Wilson ID. Mass Spectrom. Rev. 2011;30:884–906. doi: 10.1002/mas.20306. [DOI] [PubMed] [Google Scholar]
- (4).Zhou B, Xiao JF, Tuli L, Ressom HW. Mol. BioSyst. 2012;8:470–481. doi: 10.1039/c1mb05350g. [DOI] [PMC free article] [PubMed] [Google Scholar]
- (5).Kueger S, Steinhauser D, Willmitzer L, Giavalisco P. Plant J. Cell Mol. Biol. 2012;70:39–50. doi: 10.1111/j.1365-313X.2012.04902.x. [DOI] [PubMed] [Google Scholar]
- (6).Theodoridis GA, Gika HG, Want EJ, Wilson ID. Anal. Chim. Acta. 2012;711:7–16. doi: 10.1016/j.aca.2011.09.042. [DOI] [PubMed] [Google Scholar]
- (7).Garcia DE, Baidoo EE, Benke PI, Pingitore F, Tang YJ, Villa S, Keasling JD. Curr. Opin. Microbiol. 2008;11:233–239. doi: 10.1016/j.mib.2008.04.002. [DOI] [PubMed] [Google Scholar]
- (8).Patti GJ. J. Sep. Sci. 2011;34:3460–3469. doi: 10.1002/jssc.201100532. [DOI] [PubMed] [Google Scholar]
- (9).Vuckovic D. Anal. Bioanal. Chem. 2012;403:1523–1548. doi: 10.1007/s00216-012-6039-y. [DOI] [PubMed] [Google Scholar]
- (10).Buscher JM, Czernik D, Ewald JC, Sauer U, Zamboni N. Anal. Chem. 2009;81:2135–2143. doi: 10.1021/ac8022857. [DOI] [PubMed] [Google Scholar]
- (11).Gika HG, Wilson ID, Theodoridis GA. J. Chromatogr., B: Anal. Technol. Biomed. Life Sci. 2014;966:1–6. doi: 10.1016/j.jchromb.2014.01.054. [DOI] [PubMed] [Google Scholar]
- (12).Siegel D, Permentier H, Reijngoud DJ, Bischoff R. J. Chromatogr., B: Anal. Technol. Biomed. Life Sci. 2014;966:21–33. doi: 10.1016/j.jchromb.2013.11.022. [DOI] [PubMed] [Google Scholar]
- (13).Junot C, Fenaille F, Colsch B, Bécher F. Mass Spectrom Rev. 2014;33:471–500. doi: 10.1002/mas.21401. [DOI] [PubMed] [Google Scholar]
- (14).Bajad SU, Lu W, Kimball EH, Yuan J, Peterson C, Rabinowitz JD. J. Chromatogr., A. 2006;1125:76–88. doi: 10.1016/j.chroma.2006.05.019. [DOI] [PubMed] [Google Scholar]
- (15).Lu W, Bennett BD, Rabinowitz JD. J. Chromatogr., B: Anal. Technol. Biomed. Life Sci. 2008;871:236–242. doi: 10.1016/j.jchromb.2008.04.031. [DOI] [PMC free article] [PubMed] [Google Scholar]
- (16).Lu WY, Clasquin MF, Melamud E, Amador-Noguez D, Caudy AA, Rabinowitz JD. Anal. Chem. 2010;82:3212–3221. doi: 10.1021/ac902837x. [DOI] [PMC free article] [PubMed] [Google Scholar]
- (17).Roux A, Xu Y, Heilier JF, Olivier MF, Ezan E, Tabet JC, Junot C. Anal. Chem. 2012;84:6429–6437. doi: 10.1021/ac300829f. [DOI] [PubMed] [Google Scholar]
- (18).Zhang R, Watson DG, Wang L, Westrop GD, Coombs GH, Zhang T. J. Chromatogr., A. 2014;1362:168–179. doi: 10.1016/j.chroma.2014.08.039. [DOI] [PubMed] [Google Scholar]
- (19).Zhang T, Creek DJ, Barrett MP, Blackburn G, Watson DG. Anal. Chem. 2012;84:1994–2001. doi: 10.1021/ac2030738. [DOI] [PubMed] [Google Scholar]
- (20).Klavins K, Drexler H, Hann S, Koellensperger G. Anal. Chem. 2014;86:4145–4150. doi: 10.1021/ac5003454. [DOI] [PubMed] [Google Scholar]
- (21).Liu X, Ser Z, Locasale JW. Anal. Chem. 2014;86:2175–2184. doi: 10.1021/ac403845u. [DOI] [PMC free article] [PubMed] [Google Scholar]
- (22).Yanes O, Tautenhahn R, Patti GJ, Siuzdak G. Anal. Chem. 2011;83:2152–2161. doi: 10.1021/ac102981k. [DOI] [PMC free article] [PubMed] [Google Scholar]
- (23).Buescher JM, Moco S, Sauer U, Zamboni N. Anal. Chem. 2010;82:4403–4412. doi: 10.1021/ac100101d. [DOI] [PubMed] [Google Scholar]
- (24).Pesek JJ, Matyska MT, Fischer SM, Sana TR. J. Chromatogr., A. 2008;1204:48–55. doi: 10.1016/j.chroma.2008.07.077. [DOI] [PubMed] [Google Scholar]
- (25).Yang S, Sadilek M, Lidstrom ME. J. Chromatogr., A. 2010;1217:7401–7410. doi: 10.1016/j.chroma.2010.09.055. [DOI] [PMC free article] [PubMed] [Google Scholar]
- (26).Yuan M, Breitkopf SB, Yang X, Asara JM. Nat. Protoc. 2012;7:872–881. doi: 10.1038/nprot.2012.024. [DOI] [PMC free article] [PubMed] [Google Scholar]
- (27).Jonas M, LaMarr WA, Ozbal C. Comb. Chem. High Throughput Screening. 2009;12:752–759. doi: 10.2174/138620709789104924. [DOI] [PubMed] [Google Scholar]
- (28).Holt TG, Choi BK, Geoghagen NS, Jensen KK, Luo Q, LaMarr WA, Makara GM, Malkowitz L, Ozbal CC, Xiong Y, Dufresne C, Luo MJ. Assay Drug Dev. Technol. 2009;7:495–506. doi: 10.1089/adt.2009.0200. [DOI] [PubMed] [Google Scholar]
- (29).Langsdorf EF, Malikzay A, Lamarr WA, Daubaras D, Kravec C, Zhang R, Hart R, Monsma F, Black T, Ozbal CC, Miesel L, Lunn CA. J. Biomol. Screening. 2010;15:52–61. doi: 10.1177/1087057109355319. [DOI] [PubMed] [Google Scholar]
- (30).Wagner AD, Kolb JM, Ozbal CC, Herbst JJ, Olah TV, Weller HN, Zvyaga TA, Shou WZ. Rapid Commun. Mass Spectrom. 2011;25:1231–1240. doi: 10.1002/rcm.4984. [DOI] [PubMed] [Google Scholar]
- (31).Wu X, Wang J, Tan L, Bui J, Gjerstad E, McMillan K, Zhang W. J. Biomol. Screening. 2012;17:761–772. doi: 10.1177/1087057112441013. [DOI] [PubMed] [Google Scholar]
- (32).Atkinson KA, Beretta EE, Brown JA, Castrodad M, Chen Y, Cosgrove JM, Du P, Litchfield J, Makowski M, Martin K, McLellan TJ, Neagu C, Perry DA, Piotrowski DW, Steppan CM, Trilles R. Bioorg. Med. Chem. Lett. 2011;21:1621–1625. doi: 10.1016/j.bmcl.2011.01.113. [DOI] [PubMed] [Google Scholar]
- (33).Highkin MK, Yates MP, Nemirovskiy OV, Lamarr WA, Munie GE, Rains JW, Masferrer JL, Nagiec MM. J. Biomol. Screening. 2011;16:272–277. doi: 10.1177/1087057110391656. [DOI] [PubMed] [Google Scholar]
- (34).Plant M, Dineen T, Cheng A, Long AM, Chen H, Morgenstern KA. Anal. Biochem. 2011;419:217–227. doi: 10.1016/j.ab.2011.07.002. [DOI] [PubMed] [Google Scholar]
- (35).Heux S, Fuchs TJ, Buhmann J, Zamboni N, Sauer U. Metabolomics. 2012;8:433–443. [Google Scholar]
- (36).Gabelica V, De Pauw E. Mass Spectrom. Rev. 2005;24:566–587. doi: 10.1002/mas.20027. [DOI] [PubMed] [Google Scholar]
- (37).Abranko L, Garcia-Reyes JF, Molina-Diaz A. J. Mass Spectrom. 2011;46:478–488. doi: 10.1002/jms.1914. [DOI] [PubMed] [Google Scholar]
- (38).Song F. J. Agric. Food Chem. 2011;59:4361–4364. doi: 10.1021/jf200592n. [DOI] [PubMed] [Google Scholar]
- (39).Brown LJ, Smith RW, Toutoungi DE, Reynolds JC, Bristow AW, Ray A, Sage A, Wilson ID, Weston DJ, Boyle B, Creaser CS. Anal. Chem. 2012;84:4095–4103. doi: 10.1021/ac300212r. [DOI] [PubMed] [Google Scholar]
- (40).Fenn JB, Mann M, Meng CK, Wong SF, Whitehouse CM. Science. 1989;246:64–71. doi: 10.1126/science.2675315. [DOI] [PubMed] [Google Scholar]
- (41).Witte S, Neumann F, Krawinkel U, Przybylski M. J. Biol. Chem. 1996;271:18171–18175. doi: 10.1074/jbc.271.30.18171. [DOI] [PubMed] [Google Scholar]
- (42).Banerjee S, Mazumdar S. Int. J. Anal. Chem. 2012;2012:282574. doi: 10.1155/2012/282574. [DOI] [PMC free article] [PubMed] [Google Scholar]
- (43).Breslow DK, Cameron DM, Collins SR, Schuldiner M, Stewart-Ornstein J, Newman HW, Braun S, Madhani HD, Krogan NJ, Weissman JS. Nat. Methods. 2008;5:711–718. doi: 10.1038/nmeth.1234. [DOI] [PMC free article] [PubMed] [Google Scholar]
- (44).Xu YF, Zhao X, Glass DS, Absalan F, Perlman DH, Broach JR, Rabinowitz JD. Mol. Cell. 2012;48:52–62. doi: 10.1016/j.molcel.2012.07.013. [DOI] [PMC free article] [PubMed] [Google Scholar]
- (45).Luo B, Groenke K, Takors R, Wandrey C, Oldiges M. J. Chromatogr., A. 2007;1147:153–164. doi: 10.1016/j.chroma.2007.02.034. [DOI] [PubMed] [Google Scholar]
- (46).Hegeman AD, Schulte CF, Cui Q, Lewis IA, Huttlin EL, Eghbalnia H, Harms AC, Ulrich EL, Markley JL, Sussman MR. Anal. Chem. 2007;79:6912–6921. doi: 10.1021/ac070346t. [DOI] [PubMed] [Google Scholar]
- (47).Xu YF, Letisse F, Absalan F, Lu W, Kuznetsova E, Brown G, Caudy AA, Yakunin AF, Broach JR, Rabinowitz JD. Mol. Syst. Biol. 2013;9:665. doi: 10.1038/msb.2013.21. [DOI] [PMC free article] [PubMed] [Google Scholar]
- (48).Walther T, Novo M, Rossger K, Letisse F, Loret MO, Portais JC, Francois JM. Mol. Syst. Biol. 2010;6:344. doi: 10.1038/msb.2009.100. [DOI] [PMC free article] [PubMed] [Google Scholar]
- (49).Melamud E, Vastag L, Rabinowitz JD. Anal. Chem. 2010;82:9818–9826. doi: 10.1021/ac1021166. [DOI] [PMC free article] [PubMed] [Google Scholar]
- (50).Nikolskiy I, Mahieu NG, Chen YJ, Tautenhahn R, Patti GJ. Anal. Chem. 2013;85:7713–7719. doi: 10.1021/ac400751j. [DOI] [PMC free article] [PubMed] [Google Scholar]
Associated Data
This section collects any data citations, data availability statements, or supplementary materials included in this article.