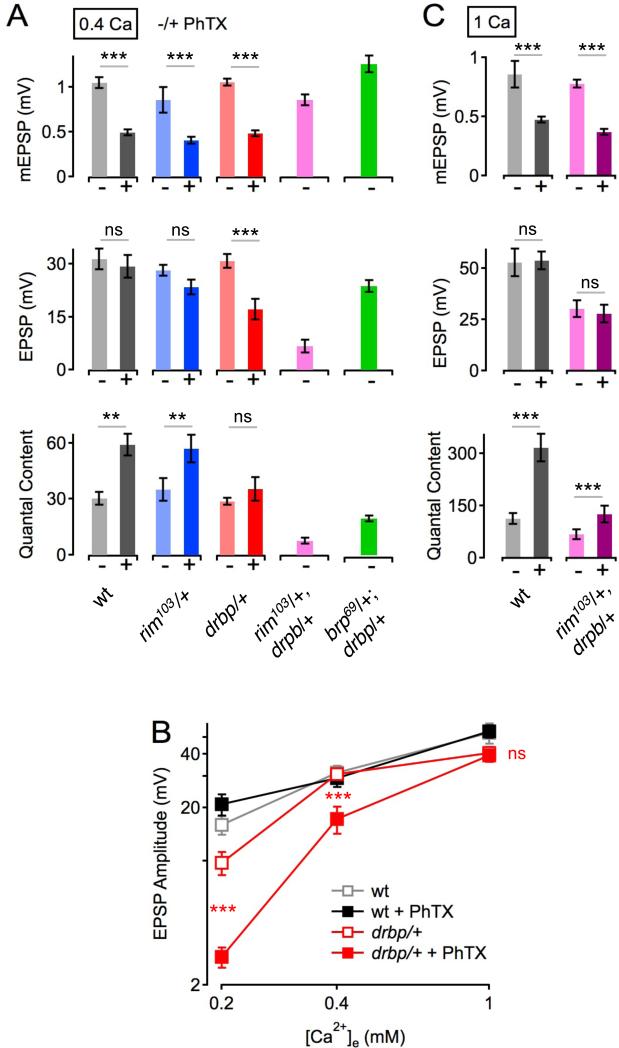
Figure 8. Genetic Interaction between drbp and rim during Baseline Synaptic Transmission.
(A) Average data for mEPSP amplitude (top), EPSP amplitude (middle) and quantal content (bottom) in the absence (−) and presence (+) of PhTX for the genotypes indicated at the bottom (0.4 mM [Ca2+]e). wt (−PhTX): n=6; wt (+PhTX): n=6; rim103/+ (−PhTX): n=7; rim103/+ (+PhTX): n=5; drbp/+ (−PhTX): n=10; drbp/+ (+PhTX): n=19; rim103/drbp (−PhTX): n=12; brp69/+;drbp/+ (−PhTX): n=10.
(B) Average EPSP amplitudes in the absence and presence of PhTX as a function of [Ca2+]e of the indicated genotypes (0.2mM [Ca2+]e: wt (−PhTX): n=8; wt (+PhTX): n=8; drbp/+ (−PhTX): n=16; drbp/+ (+PhTX): n=16; 1mM [Ca2+]e: wt (−PhTX): n=6; wt (+PhTX): n=6; drbp/+ (−PhTX): n=12; drbp/+ (+PhTX): n=12; 0.4mM [Ca2+]e as in (A)). Note the significant decrease in EPSP amplitude in drbp/+ following PhTX treatment at the two lowest [Ca2+]e with respect to baseline conditions (all p<0.001), and the decrease in EPSP amplitude in drbp/+ in the absence of PhTX at 0.2mM [Ca2+]e compared to wild type (p=0.019).
(C) Average data for mEPSP amplitude (top), EPSP amplitude (middle) and quantal content (bottom) in the absence (−) and presence (+) of PhTX for the genotypes at 1mM [Ca2+]e (rim103/drbp (−PhTX): n=12; rim103/drbp (+PhTX): n=12; n for wild type are given in (B)).

