

Abstract
Although performance on laboratory-based implicit bias tasks often is interpreted strictly in terms of the strength of automatic associations, recent evidence suggests that such tasks are influenced by higher-order cognitive control processes, so-called executive functions (EFs). However, extant work in this area has been limited by failure to account for the unity and diversity of EFs, focus on only a single measure of bias and/or EF, and relatively small sample sizes. The current study sought to comprehensively model the relation between individual differences in EFs and the expression of racial bias in three commonly used laboratory measures. Participants (N=485) completed a battery of EF tasks (session 1) and three racial bias tasks (session 2), along with numerous individual difference questionnaires. The main findings were as follows: (1) measures of implicit bias were only weakly intercorrelated; (2) EF and estimates of automatic processes both predicted implicit bias and also interacted, such that the relation between automatic processes and bias expression was reduced at higher levels of EF; (3) specific facets of EF were differentially associated with overall task performance and controlled processing estimates across different bias tasks; (4) EF did not moderate associations between implicit and explicit measures of bias; and (5) external, but not internal, motivation to control prejudice depended on EF to reduce bias expression. Findings are discussed in terms of the importance of global and specific EF abilities in determining expression of implicit racial bias.
Keywords: implicit bias, inhibition, working memory, task-switching, automatic, controlled, latent variable modeling
Borrowing from paradigms initially designed to demonstrate semantic associations between word pairs (e.g., Collins & Loftus, 1975; Neely, 1977; Posner & Snyder, 1975), social psychologists discovered 30 years ago that reaction-time- and accuracy-based laboratory measures could be used to assess cognitive associations between social categories, like race and gender, and attributes associated with those categories, such as stereotypes and evaluations (e.g., Dovidio, Evans, & Tyler, 1986; Gaertner & McLaughlin, 1983). The prospect that this mental content could be assessed without reliance on self-report was met with great enthusiasm, particularly as it was becoming clear at the time that self-reported intergroup attitudes were artificially positive, masking an underlying, stubborn basis of prejudice (Crosby, Bromley, & Saxe, 1980; Devine & Elliot, 1995). In essence, these measures promised a way to assess stereotype-based associations that people were increasingly unwilling (or unable) to report, thereby circumventing well documented limitations in the willingness and ability to accurately introspect on the cognitive processes that produce overt behaviors (Kunda, 1990; Nisbett & Wilson, 1977; Zajonc, 1980).
Given their promise for assessing associations that exist outside of conscious awareness and control (Devine, 1989; Greenwald & Banaji, 1995), this new class of measures was initially viewed as a pure reflection of the existence (and, in some cases, the strength; see Fazio, Jackson, Dunton, & Williams, 1995) of underlying, “automatically” activated associations. That is, they were welcomed as measures of processes that occur quickly, without intention, and with minimal demand on cognitive resources, unlike previously developed explicit measures.1 These new procedures –– now referred to as “implicit” measures –– were assumed to be free from distortions imposed by more reflective, effortful controlled processes (Bargh, 1999; De Houwer et al., 2009; Fazio et al., 1995; Greenwald & Banaji, 1995; Greenwald, McGhee, & Schwartz, 1998). This characterization has been described as task dissociation, assuming that such response-time- or accuracy-based measures solely reflect automatic associations, in contradistinction to explicit self-report measures, which were assumed to be influenced by controlled processes. More recent perspectives, however, have begun to reject this approach in favor of a process dissociation view. Process dissociation posits that all overt behaviors ––whether pressing a button on a computer or completing a questionnaire –– reflect the influence of both automatic and controlled processing components (Conrey, Sherman, Gawronski, Hugenberg, & Groom, 2005; Jacoby, 1991; Payne 2001, 2005). The purpose of the present research is to provide an extensive, methodologically rigorous test of the process-dissociation perspective by clarifying the role of cognitive control in implicit measures of racial bias (from here on, implicit bias tasks).
The Role of Control in the Expression of Implicit Racial Bias
With the process dissociation perspective as a starting point, a number of researchers have argued that, because implicit bias tasks require participants to make overt behavioral responses (e.g., button pressing), performance must reflect the influence of controlled processes to some extent (see Amodio & Mendoza, 2010; Conrey et al., 2005; Klauer, Voss, Schmitz, & Teige-Mocigemba, 2007; Payne, 2001, 2005; Sherman, Klauer, & Allen, 2010). Consider the frequently used Weapon Identification Task (WIT; Payne, 2001) in which racial category cues (faces of White and Black men) are presented just prior to briefly presented target objects that participants must classify as guns or tools (by pressing one of two keys) prior to a rapid response deadline. On some trials –– for example, when Black faces precede gun targets –– this task can be performed accurately by either careful processing of the target object or by relying on automatically activated stereotypical associations linking young Black men with gun violence. On such stereotype congruent trials, both the automatically activated stereotype and more controlled explicit task goals facilitate the same response (i.e., pressing the “gun” key). In contrast, other trials, such as those in which Black faces precede tool targets, require participants to overcome the influence of the stereotype to make the correct response. On these stereotype incongruent trials, automatic- and control-related processes call for opposing responses, and the correct response depends upon exertion of control. A wide variety of racial bias tasks, such as the Implicit Association Test (IAT; Greenwald et al., 1998) and First Person Shooter Task (FPST; Correll et al., 2002), follow a similar conceptual structure.
Mathematical models using Jacoby’s (1991) process dissociation procedure (PDP) (Payne, 2001), or more complex multinomial modeling procedures (Conrey et al., 2005), which separately quantify the contribution of automatic and controlled components to behavior, consistently demonstrate that controlled processes substantially contribute to performance on implicit bias tasks. In the PDP analysis, estimates for automaticity and control reflect error rates on stereotype congruent and stereotype incongruent trials. Specifically, PDP control is computed as the proportion of congruent trials on which participants respond correctly minus the proportion of incongruent trials on which they commit a stereotype-related error; PDP automatic is computed as the proportion of threat responses on non-threatening trials divided by the quantity [1 – PDP control], which represents the likelihood of an incorrect threat response when control fails. (The full set of PDP equations can be found in Payne, 2005.) Using these formulas, performance on a variety of implicit measures has been shown to depend not just on “automatic” processes, but also on participants’ ability to exert control over the influence of stereotypic associations on behavioral responses (e.g., Amodio, Devine, & Harmon-Jones, 2008; Amodio et al., 2004; Bartholow, Henry, Lust, Saults, & Wood, 2012; Conrey et al., 2005; Payne, 2001, 2005; Payne, Lambert, & Jacoby, 2002; Sherman et al., 2008). Such results clearly challenge the idea that performance on these measures simply reflects automatic associations.
Despite their potential implications, such findings do not directly address the extent to which individual differences in control-related abilities in general contribute to performance on implicit bias measures. In other words, the output of such models represents the engagement of task-specific control processes, which should be influenced by individual differences in control-related abilities but do not themselves reflect solely those abilities. The mathematical approaches may also be limited because behavioral responses from a single task are used for multiple purposes: to assess racial bias, to estimate the influence of automatic processes, and to estimate the influence of cognitive control. This leaves open the possibility that control and racially-biased behavior are related in these studies simply because they draw on the same responses.
Other research has endeavored to separately assess bias- and control-related abilities by administering racial bias tasks in conjunction with separate measures of executive functioning (EF; Amodio et al., 2008; Klauer, Schmitz, Teige-Mocigemba, & Voss, 2010; Payne, 2005; Siegel, Dougherty, & Huber, 2012). Across these studies, participants demonstrating stronger cognitive control abilities showed less bias in task performance. Other investigators have used psychophysiological measures of processes arguably reflective of EF, recorded while participants complete implicit bias tasks, to augment behavioral assessments, and have found that participants whose neural responses indicate greater implementation of cognitive control show less bias in their behavior (e.g., Amodio et al., 2004, 2008; Bartholow, Dickter, & Sestir, 2006; Bartholow et al., 2012; Correll, Urland, & Ito, 2006; see also Beer et al., 2008; Richeson et al., 2003).
Perhaps the most convincing data on the topic comes from studies in which participants’ ability to exert control during implicit measures is directly manipulated. For example, Payne et al. (2002) manipulated how quickly participants were required to respond in the WIT. Time pressure increased the amount of bias expressed on the task, and a PDP analysis showed that the shift occurred not as a function of changes in the influence of automatic processes but because the manipulation reduced participants’ ability to exert control over their behavior (see also Conrey et al., 2005). Similar effects have been found with other manipulations of cognitive control, including depleting control by forcing participants to exert cognitive effort immediately before the implicit task (Govorun & Payne, 2006), introducing an additional cognitively demanding task while measuring racial bias (i.e., increasing cognitive load; Schmitz, Teige-Mocigemba, Voss, & Klauer, 2013), increasing the salience of racial prejudice prior to measuring implicit bias (Siegel et al., 2012), and having participants consume alcohol prior to completing the implicit measure (Bartholow et al., 2006, 2012; Schlauch, Lang, Plant, Christensen, & Donohue, 2009).
Unresolved Issues
Although converging evidence based on a range of approaches suggests that performance on implicit measures of racial bias depends on more than automatically activated associations in memory, investigations of these issues to date have proceeded in a somewhat piecemeal fashion, leaving two core issues unresolved. First, and of critical theoretical importance, there is currently no unifying framework for understanding the specific processes through which control is implemented in the context of implicit racial bias. Within the literature, controlling implicit racial bias is often characterized as involving intention, effort, and limited capacity resources (e.g., Bartholow et al., 2006; Conrey et al., 2005; Devine, 1989; Lambert et al., 2003; Payne, 2001, 2005; Payne, Shimizu, & Jacoby, 2005; von Hippel, 2007), but while these features may accurately describe the conditions under which controlled processes operate, they do not define the qualitative nature of the processes themselves (i.e., what a particular process does). Even definitions of control that emphasize goal-congruent processing or pursuing distal over proximal goals (e.g., Baumeister, Vohs, & Tice, 2007; Fujita, 2011) do not identify the concrete processes needed to achieve these outcomes.
Within the stereotyping and prejudice literature, a number of unique mechanisms have been suggested, including inhibiting the impact of automatically activated stereotypic associations and activation of more egalitarian associations and/or response tendencies (Devine, 1989; Macrae, Bodenhausen, Milne, & Jetten, 1994; Mendoza, Gollwitzer, & Amodio, 2010; Monteith, Ashburn-Nardo, Voils, & Czopp, 2002; Monteith, Sherman, & Devine, 1998; von Hippel, Silver, & Lynch, 2000). Here we argue that the processes typically attributed to “control” in the stereotyping and prejudice literature overlap with what are considered in the cognitive science literature to be EFs (see also Klauer et al., 2010; Payne, 2005; Richeson & Shelton, 2003). This view is in line with previous demonstrations that control over race-based responses relies on the same neural conflict monitoring and control adjustment processes identified in cognitive neuroscience models of control more generally (e.g., Amodio et al., 2004, 2008; Bartholow et al., 2006, 2012; Correll et al., 2006). Moreover, the current work goes beyond such previous demonstrations in that, rather than adopting a monolithic and undifferentiated view of EF, we build on the latest advances in cognitive science indicating that EF is a multi-faceted construct consisting of processes including response inhibition, working memory updating, and task switching. These aspects of EF have been shown to possess both “unity and diversity” (see Teuber, 1972) in a variety of populations, including young adults, college students, children, and older adults (e.g., Fisk & Sharp, 2004; Friedman et al., 2008; Huizinga, Dolan, & van der Molen, 2006; Lehto, Juujarvi, Kooistra, & Pulkkinen, 2003; Miyake et al., 2000). Unity refers to the fact that these separate EFs significantly correlate with each other; diversity refers to the fact that the correlations are not total, indicating important differences among the different types of EF.
This pattern of unity and diversity has had important implications for understanding the relations of EFs to other constructs, as the apparent influence of EF depends on the constructs or specific measures examined (e.g., Friedman et al., 2008; 2011; Miyake et al., 2000; Willcutt et al., 2001). For example, general intelligence is most highly related to working memory updating ability (Friedman et al., 2006), whereas deficits in behavioral and attentional control are more highly related to response inhibition (Friedman et al., 2007; Young et al., 2009). If we are to understand complex behavioral outcomes like the expression of racial bias, treating control as a unitary construct is insufficient (Klauer et al., 2010). EF is a nuanced and multifaceted construct, and forming a full understanding of how control over automatic racial associations is implemented necessitates evaluating multiple aspects of EF and their relationships with implicit racial bias.
Another issue warranting further investigation is the degree to which relations of EF to implicit bias are similar across different bias tasks, or whether unique task structures employed by different measures will lead them to differentially relate to the various components of EF described above. Addressing this requires not only multiple measures of EF, but also implicit bias. In addition to facilitating consideration of how multiple aspects of EF relate to multiple measures of EF, the use of multiple tasks also provides various measurement advantages. From a task impurity perspective, any given measure is a fallible indicator of the underlying construct of interest, reflecting both construct-specific and task-specific variability (as well as random error) (e.g., Blanton, Jaccard, Gonzales, & Christie, 2006; Burgess, 1997; Cunningham, Preacher, & Banaji, 2001; Fazio & Olson, 2003 Miyake et al., 2000; Phillips, 1997). This measurement problem is exacerbated by the poor reliability of many implicit bias and EF tasks (Cunningham et al., 2001; Denckla, 1996; Rabbitt, 1997). While some studies have examined the role of cognitive control in implicit measures, many have tended to use a single measure of either implicit bias (e.g., Klauer & Mierke, 2005; Mierke & Klauer, 2003; Siegel et al., 2012) or control/EF (e.g., Payne, 2005; Klauer & Mierke, 2005; Mierke & Klauer, 2003; but see Amodio et al., 2008; Klauer et al., 2010).
To further illustrate the importance of multiple measures of both EF and bias, consider the differing results obtained in recent studies. The first example comes from studies by Payne and colleagues examining performance on implicit bias tasks, including the WIT and an evaluative priming task (Govorun & Payne, 2006; Payne, 2005). In each study, one aspect of EF—inhibitory ability—was measured by a single task (either the Stroop or antisaccade task), and the authors found that EF task performance was positively associated with estimates of control from PDP analyses. These results seem to suggest that (at least some) bias measures are sensitive to participants’ inhibitory ability. In contrast, in one of the most methodologically and analytically sophisticated studies to date, Klauer and his colleagues (2010) examined the relationship between performance on the IAT and performance on measures of inhibition, working memory, and switching. This work took a latent variable approach, employing multiple IATs tapping different constructs and multiple measures of each aspect of EF. Klauer et al. found only a negligible relationship between inhibitory ability and bias, when controlling for variance in the other EFs. Performance on the IAT was instead related to switching ability. Though Klauer et al.’s work focused purely on construct-neutral IAT method variance (i.e., not exclusive to race bias), these studies suggest that performance on different bias tasks reflects contributions from distinct EF abilities. If EF demands vary across different implicit bias measures, relations observed between a given measure of EF and any particular bias task cannot be assumed to generalize to other measures. Hence, comprehensive understanding of these relationships requires the use of multiple measures of both EF and bias.
Current Study
Based on these considerations, we conducted a large-scale, systematic study of the relation between EF and implicit racial bias that builds on past research but also expands it in several important ways. First, the current work represents a combination of cutting edge approaches in assessment of EF (from cognitive science) and racial bias (from social cognition), along with sophisticated quantitative modeling techniques. These innovations allow us to evaluate the degree to which distinct facets of EF, assessed at the level of latent variables, are involved in the expression of implicit racial bias. In line with the EF research described above, we employed a set of nine EF tasks, allowing independent assessments of response inhibition, working memory updating, and task switching at the latent variable level. Following Miyake and Friedman (2012), we incorporate a nested factors model that more directly captures the unity and diversity of these EFs. In this model, unity is captured by a “Common EF” factor on which all EF tasks load, and diversity is captured by two additional factors (“Updating-specific” and “Shifting-specific”) on which the working memory updating and task-switching measures load, respectively. These latter two factors capture the correlations among the updating and switching tasks that are not captured by the Common EF factor (i.e., variance that makes these factors distinct from each other and from Common EF). Notably, although research on the control of implicit racial biases often implicates inhibitory processes (e.g., inhibiting the influence of an undesirable behavioral tendency; see Devine, 1989; Mendoza et al., 2010; Monteith et al., 2002; von Hippel, Silver, & Lynch, 2000), the current model lacks an “Inhibition-specific” factor because inhibition is represented by the Common EF factor. That is, once variance common to all three types of EF measures is accounted for by estimation of the Common EF factor, there are no remaining correlations among the inhibition tasks to account for, a pattern that has been replicated in multiple independent datasets (see Miyake & Friedman, 2012), including that from the current study.
This nested factors model allows our results to be interpreted in terms of the proposed mechanisms that are common and unique to these EFs (Friedman et al., 2011; Miyake & Friedman, 2012). Specifically, Miyake and Friedman (2012) proposed that individual differences in Common EF tap the ability to actively maintain task goals, particularly in the face of interference, and use these goals to direct ongoing processing. This ability is key to all EF tasks and may be particularly important in response inhibition tasks (Munakata et al., 2011). In contrast, they proposed that Shifting-Specific ability may be more related to the ability to quickly let go of these goals when necessary, to flexibly adapt ongoing behavior to changing situational demands. Updating-Specific abilities may reflect efficient gating of working memory, as well as episodic retrieval. Assessment of these individual aspects of EF allows us to examine the degree to which qualitatively different aspects of EF contribute to the operation of control within the context of implicit racial bias.
A second important advance made in the current study is the inclusion of three widely used implicit measures of racial bias: the WIT, FPST, and IAT. The use of multiple indices of bias in the same participants has two distinct advantages. First, this approach permits examination of the degree of association among the bias measures (e.g., Cunningham et al., 2001). Importantly, we modified the implicit measures to assess the same basic aspect of racial stereotypes of African Americans (the association between African Americans and danger). In doing so, we eliminate assessment of different automatic associations as one possible reason for the dissociations among the tasks reported in prior research (e.g., Brauer, Wasel, & Niedenthal, 2000; Fazio & Olson, 2003; Sherman, Rose, Koch, Presson, & Chassin, 2003). We can then assess whether any remaining discrepancy between implicit bias tasks reflects either the differential contribution of cognitive control (in general) to a given measure of bias or the specific relationship between one particular measure of bias and one particular subcomponent of EF. Here, we focused on the African American-danger association because of its widespread assessment in past research (across multiple implicit measures) and the consistent finding that this stereotype exists broadly across different parts of American society (Chen & Bargh, 1997; Oliver, 2003). Second, using multiple measures improves assessment of the underlying construct of interest by circumventing task impurity problems (i.e., task-specific method variance; see Mierke & Klauer, 2003, for an example involving the IAT). We thus take a latent variable approach to modeling both EF and implicit bias, allowing us to extract overarching factors representing the variables of interest from our large battery of tasks and measures.
The third goal of the current study was to provide a definitive data set that was largely immune to the criticisms levied at past research in this area. To accomplish this, we incorporated a number of basic design improvements into our study. Perhaps the most important is the relatively large number of participants included in this study (N = 485), which provides the power necessary to test nuanced predictions concerning the strength of correlations among our measures. Also, participants were recruited from three universities located in distinct geographical and cultural areas of the U.S. Together, these factors make this one of the largest and most heterogeneous laboratory-based studies of racial bias to date, especially on the role of cognitive control in implicit bias. Furthermore, each participant completed a two-session protocol involving assessment of EFs during session 1, and assessment of implicit bias during session 2. These sessions were separated by roughly a week to ensure that any relationships between the two classes of measures were due to persistent individual differences that were stable over time.
In addition to comprehensively assessing EFs and implicit bias, we administered several questionnaire measures designed to assess racial attitudes in a more explicit fashion. Inclusion of these explicit measures allowed us to test several additional questions, such as the relationship between implicit and explicit bias measures and relations between EF and individual differences in motivation to control prejudice. These measures were also assessed during session 1 so that any relationships between the implicit and explicit measures of racial bias would be due primarily to stable individual differences. Critically, our large sample size allows us to address these questions within a well-powered design, thereby eliminating a substantial limitation found in most other studies examining EF and bias. Given the scope and complexity of the research questions investigated here, and to provide an organizing conceptual framework for the study the next section briefly outlines our primary (H1 & H2) and ancillary (H3–H6) hypotheses.
Primary Hypotheses
Our primary hypotheses and the fundamental motivation for this research concern the degree to which EF and automatically activated stereotypic associations affect participants’ performance on standard, laboratory-based measures of implicit bias. H1 and H2 both focus on implicit bias as the dependent variable of interest.
H1: Implicit bias reflects both EF and automatic processes
Our primary question involves the degree to which performance on implicit measures of racial bias reflects variability in both EF abilities and automatic processes linking race and danger. Using EF performance as a reflection of the degree to which executive control processes can be brought to bear when completing an implicit bias task, and the PDP estimates of automatic bias as a measure of the contribution of automatic processes, we expect both EF and PDP automatic estimates (from here on PDP auto) to directly predict racial bias in performance (from here on performance bias). Specifically, higher scores on EF tasks should be associated with reduced performance bias on the WIT, FPST, and IAT, whereas higher PDP auto should be associated with greater performance bias on these tasks.
H2: EF moderates the effect of automatic processes on implicit bias
In addition to predicting direct effects of both EF and automatic processes on performance bias, we also expect them to interact. To the degree that bias expression depends on the ability to exert control over the influence of automatically activated associations on behavior, EF should moderate the relation between PDP auto and performance bias (Payne, 2005). Specifically, automatic processes should more directly drive performance bias among those with weaker EF abilities. By the same logic, automatic processes should be a weaker predictor of performance bias among those with stronger EF abilities.
Critically, both hypothesis H1 and H2 will be assessed using the Unity and Diversity nested factors EF model (Miyake & Friedman, 2012). This model will allow us to further test whether particular aspects of EF are differentially implicated in these predicted relations.
Ancillary Hypotheses
In addition to these primary hypotheses, the relatively large scale of the current investigation provides the opportunity to test several ancillary hypotheses concerning relationships among implicit measures, explicit measures, EF, and motivational factors.
H3: EF is related to PDP control but not auto
Within the process dissociation framework, computations of controlled processes are thought to reflect the operation of EFs whereas estimates of automatic processes are not (Payne, 2005; see also Govorun & Payne, 2006). Although the differential relationship of EFs with PDP control and auto has been supported empirically (Govorun & Payne, 2006; Payne, 2005, see also Amodio et al., 2004, 2008; Lambert et al., 2003; Mendoza et al., 2010; Stewart & Payne, 2008), prior studies have been limited both in the types and number of EF and/or implicit bias measures assessed. The present study allows us to examine this relationship in a more comprehensive manner through use of the Unity and Diversity EF model. Based on past studies finding an association between PDP control and measures related to Common EF (Govorun & Payne, 2006; Payne, 2005), we expect a relationship between PDP control and Common EF. To the degree that controlling the influence of automatic stereotypic associations in these tasks requires flexible switching between different goals and behaviors (which draws on Shifting-specific ability), and/or the active manipulation of information in working memory (which draws on Updating-specific ability), PDP control may also relate to Shifting-specific and Updating-specific abilities.
H4: EF moderates the relation between implicit and explicit bias
Working from a classic dual process perspective, weak correlations between implicit and explicit measures could be assumed to reflect the greater influence of controlled processes on explicit than on implicit measures (e.g., Blair, 2001; Cunningham et al., 2001; Devine, Plant, Amodio, Harmon-Jones, & Vance, 2002; Fazio et al., 1995; Fazio & Olson, 2003; Greenwald, McGhee, & Schwartz, 1998; Hofmann, Gawronski, Gschwendner, Le, & Schmitt, 2005; Hofmann, Gschwendner, & Schmitt, 2005). That is, while both implicit and explicit responses could draw on an individual’s beliefs and feelings about a group, explicit responses might also be influenced by additional considerations such as motivation to control bias. Consistent with this assumption, a higher correspondence between the two types of measures has been obtained when situational pressures to implement control are minimized (Payne, Burkley, & Stokes, 2008; Ranganath, Smith, & Nosek, 2008 see also Hofmann et al., 2005; Koole, Dijksterhuis, & van Knippenberg, 2001). Here we test an individual difference analog of this effect. Given our assumption that control depends on EF, we predict that EF moderates the relationship between implicit and explicit measures of racial bias (see also, Payne, 2005), with the strength of the implicit–explicit relationship increasing for those who have less capacity to modify their explicit responses (i.e., as EF decreases) (Payne, 2005).
H5: Bias is influenced by motivation to control prejudice
Motivation to control prejudiced responses has been argued to moderate the degree to which stereotypical associations impact behavior (Devine, 1989; Dunton & Fazio, 1997; Monteith, 1993; Plant & Devine, 1998). We thus predict that participants who are motivated to control the expression of prejudice will show less implicit and explicit bias, even when controlling for the influence of EF. This may be especially true of motivation that derives from internal, personally-held egalitarian beliefs. People for whom control over bias derives from a desire to conform to perceived external normative standards may actually show higher levels of bias relative to those with lower levels of external motivation (Amodio et al., 2003, 2008; Devine et al., 2002; Gonsalkorale et al., 2011).
H6: EF moderates the effect of motivation to control prejudice on bias
Finally, in an extension of H5, we examine the degree to which motivation to control prejudice interacts with EF to predict implicit and explicit bias. While domain-general EF ability may be necessary to translate regulatory intentions into behavior (as assessed under H1 and H2), the specific concern of expressing racial bias should also be critical for recruiting such control (cf., Amodio et al., 2008). Thus, although concern about not appearing racially biased could motivate individuals to control their behavior, successfully implementing control may depend on cognitive capacity. If so, motivation to control prejudiced responses and EF should interact in predicting racial bias such that the impact of high motivation to control prejudice is most pronounced among participants with high EF abilities. This hypothesis is consistent with general theorizing about the interactive effects of motivation and ability (e.g., Fazio, 1990). Although the independent effects of domain-specific motivation and domain-general EF have been assessed before (Payne, 2005), their interactive effects have not to our knowledge been evaluated. Again, given that internal sources of motivation appear to translate more readily into lower bias, high EF may be particularly beneficial with high internal as compared to external motivation.
Method
Participants
Four hundred eighty-five undergraduate participants (246 men) were recruited across 3 research sites: the University of Colorado Boulder (CU; n = 193), the University of Missouri (MU; n = 258), and the University of Chicago (UC; n = 34). Participants were recruited from Introductory Psychology courses at each site for a study investigating individual differences in cognitive abilities. Recruitment materials specified that participation would involve testing in two sessions separated by approximately one week. Participants received either course credit or monetary compensation for completing the testing battery, which took approximately five hours. Participants ranged in age from 18 to 42 years (M = 19.75, SD = 2.21; 5 participants did not indicate their age). Of the 477 participants who provided demographic information, 31 self-identified as Hispanic, 7 as Native American, 32 as Asian, 37 as Black, 2 as Pacific Islander, and 411 as White (numbers do not sum to 477 because 37 individuals endorsed multiple ethnicities).2,3
Of the 485 individuals included in the sample, 406 completed both sessions of the study, forming the sample on which primary hypotheses were tested. Samples sizes for individual tasks varied for additional reasons such as equipment failure or experimenter error. We also excluded data from a given task a priori if performance was below chance, calculated as p < .01 binomial probability that the participant would have obtained that score by chance (0.4% of data). With these requirements in place, we had useable data from a minimum of 94.6% of participants for each task. All available data were used in analyses, which allowed for missing observations.
Materials and Measures
Executive function measures
A total of nine computerized EF measures—three tasks tapping each of three EF abilities: response inhibition, working memory updating, and task-shifting—were administered during the first session. These measures form a battery that has been extensively studied by Friedman and Miyake (e.g., Friedman et al., 2006, 2008; Miyake et al., 2000). The particular versions used here were previously used in a large study of young adult twins (Friedman et al., 2014), which found that they show the same factor structure observed here and in other studies (see Miyake & Friedman, 2012). The tasks are described briefly here, but full methodological information can be found in Supplemental Materials.
Response inhibition 1: Antisaccade (adapted from Roberts, Hager, & Heron, 1994)
Each trial of this task began with a centrally presented fixation cross that was replaced with an initial cue to the left or right of fixation, after which a numeric target appeared for 150 ms before being masked. Participants’ task was to report the target number. In an initial prosaccade block, the target always appeared on the same side as the cue to build a prepotency to orient to this stimulus. This was followed by three antisaccade blocks in which the target appeared on the side opposite from the cue. The dependent measure was the averaged proportion of correct responses across the antisaccade blocks.
Response inhibition 2: Stop signal (van den Wildenberg et al., 2006)
This task similarly consisted of one block designed to promote a prepotent response followed by three test blocks. On each trial, participants focused on a fixation point until a green arrow appeared that pointed to the right or left. Participants were instructed to press one of two buttons on the keyboard corresponding to the right or left arrows as quickly and accurately as possible. Participants completed an initial block of all-go trials, in which they simply responded according to the arrow direction. After these initial trials, the stop signal was introduced, with the green arrow changing to red on 25% of trials, indicating that participants should inhibit their responses. The onset of this signal was adjusted on a trial-by-trial basis until participants were able to inhibit about 50% of responses. The dependent measure was the stop signal reaction time (SSRT; Logan, 1994), which estimates the amount of time required to stop an already-initiated response. The SSRT was calculated as the difference between the median reaction time on go trials (which estimates the time when a response would have occurred in the absence of the stop signal) and the stop signal delay value (i.e., the average stop signal onset across blocks). Larger SSRT values indicate that a participant needed more warning to avoid responding on stop trials (i.e., poorer inhibitory control).
Response inhibition 3: Stroop (Stroop, 1935)
This task consisted of three types of trials: (1) neutral trials with strings of 3–5 asterisks printed in red, blue, or green; (2) congruent trials in which color words were printed in the matching color (e.g., “RED” displayed in red); and (3) incongruent trials in which the word and color never matched (e.g., “RED” displayed in blue). Participants were asked to name the font color aloud. Relative to the neutral trials, congruent trials often show a pattern of facilitation while incongruent trials show a pattern of interference. The overall Stroop effect was calculated as the difference in mean response times between incongruent and neutral trials.
Updating 1: Keep track (adapted from Yntema, 1963)
Participants kept track of a series of exemplars belonging to six different categories. Each trial began with a list of 2–5 target categories (relatives, countries, colors, animals, metals, and distances) shown at the bottom of the screen. Then, a stream of 15–25 exemplar words from the various categories appeared in the center of the screen. Participants were asked to verbally recall the most recent exemplar from each target category at the end of the trial. The dependent measure was the proportion of correct responses across all trials.
Updating 2: Letter memory (adapted from Morris & Jones, 1990)
As a stream of consonants appeared sequentially on the screen, participants had to rehearse aloud the last four letters seen (including the current letter), in the correct order. Letters were accumulated until the fourth letter was reached, after which the fifth letter back was dropped (i.e., “L”, “L-S”, “L-S-K”, “L-S-K-D”, “S-K-D-H”, etc.). After 9, 11, or 13 letters had appeared (series length was unpredictable), participants had to report the final four letters in the correct order. The dependent measure was the accuracy of the strings repeated after each new letter was presented, with one point given for each correctly reported set.
Updating 3: Spatial n-back (Friedman et al., 2008)
On each trial a box flashed in one of 12 locations on the screen, and participants reported whether it occurred in the same location as a prior flash. Participants completed both a 2-back and 3-back condition. The dependent measure was the averaged proportion of correct responses across the 2- and 3-back conditions. Omissions were counted as incorrect responses.
Shifting 1: Color–shape (Miyake, Emerson, Padilla, & Ahn, 2004)
Participants categorized circles and triangles, presented in either red or green, as quickly and accurately as possible. On each trial, the target was preceded by a cue that indicated whether participants should use the dimension of color (“C”) or shape (“S”). The dependent measure was the switch cost: the difference between the average reaction time for correct switch trials (a trial in which the cue does not match the cue from the previous trial) and correct repeat trials (a trial in which the current cue matches the previous cue).
Shifting 2: Category switch (adapted from Mayr & Kliegl, 2000)
This task used a similar structure as the color–shape task but presented words that could be classified both as describing living or non-living and things smaller or larger than a soccer ball (e.g., alligator, coat, knob, lion). A cue (either a heart or crossed arrows) appeared before the word to indicate which dimension was relevant for the current trial. The dependent measure was the switch cost: the difference between average reaction time for correct switch trials and correct repeat trials.
Shifting 3: Number–letter (adapted from Rogers & Monsell, 1995)
On each trial a number–letter or letter–number pair was presented in one quadrant of a square. If the set appeared in the top half of the square, participants were instructed to categorize the number as odd or even. If the set appeared in the bottom half, participants were instructed to categorize the letter as a consonant or vowel. After initial blocks in which stimuli appeared exclusively in the top half of the square, then exclusively in the bottom half, a block of predictable switches occurred in which the pair of characters was presented in a clockwise pattern. Participants then performed random-switch blocks in which the stimulus’s location was randomly determined on each trial. The dependent measure was the switch cost in these random-switch blocks: the difference between average reaction times for correct switch trials and correct repeat trials.
Implicit measures of racial bias
Three computerized measures of racial bias, all designed to assess the same basic aspect of racial stereotypes of African Americans (the association between young African American men and danger), were administered in the second session.
Weapon Identification Task (WIT)
The WIT (Payne, 2001) required participants to classify objects as either guns or tools. The task included a practice block of 30 trials, followed by a test block of 384 experimental trials.4 On each trial, a visual pattern mask (a scrambled black and white pattern; 500 ms duration) preceded a briefly presented picture of a White or Black male face (i.e., prime, 200 ms duration), which was followed immediately by presentation of either a gun or tool (i.e., target, 200 ms duration). The target was then hidden by a second visual mask (300 ms duration). Participants were told that the faces served only as a cue that a target object was about to appear, and that they should classify the objects as guns or tools as quickly and accurately as possible by pressing one of two buttons. Responses made following a 500 ms response deadline elicited a “Too Slow!” message to encourage faster responses. Trials were separated by a 1000-ms intertrial interval. Previous studies have consistently shown performance indicative of racial bias on this task in that participants more frequently press the “gun” key following Black face primes compared to White face primes (e.g., see Amodio et al., 2004, 2008; Bartholow et al., 2012; Payne, 2001, 2005).
The race primes consisted of eight pictures each of Black and White males displaying neutral facial expressions. They were shown in color and cropped to show only internal face features. Target stimuli were grayscale images of four handguns and four tools (a drill, two wrenches, and pliers) from Payne (2005). The dependent measure of interest for the WIT was bias in response accuracy, calculated as the difference in accuracy on stereotype-congruent trials (Black-gun and White-tool trials) and incongruent trials (Black-tool and White-gun trials).
First-person Shooter Task (FPST)
The FPST (Correll et al., 2002) requires participants to make speeded decisions to either shoot or not shoot images of armed and unarmed Black and White men. The task began with a practice block of 16 trials followed by a test block of 300 trials. On each trial, participants first saw a variable number of background images (1–4 images, 500–800 ms duration). The final background image was replaced with an image of a target individual in that same background, leaving the impression that the target popped up in the scene. The target was presented for 590 ms. The target was holding either one of several handguns or one of several innocuous objects (e.g., cell phone, wallet, soda can). Participants were instructed to press a button labeled “Shoot” (for armed targets) and a button labeled “Don’t Shoot” (for unarmed targets) as quickly as possible. If a response was made within the 590-ms response window (i.e., while the target was displayed), participants received the following feedback and points added to a running score (presented for 500 ms): (1) Correct decision to shoot – “Good shot,” 10 points, (2) Incorrect decision to shoot – “You shot a good guy!!” 40 point penalty, (3) Correct decision not to shoot – “Wise choice,” 5 points, and (4) Incorrect decision not to shoot – “YOU’RE DEAD!!” 20 point penalty. Timeouts were penalized with a 50-point deduction. Previous studies have shown patterns of bias on this task such that participants more frequently shoot Black than White targets (see Correll et al., 2002, 2006). Performance bias for this task was calculated as the differences in accuracy on stereotype congruent trials (armed Black and unarmed White) and incongruent trials (unarmed black and armed White trials).
Implicit Association Test (IAT)
On each trial of this task (adapted from Greenwald et al., 1998), participants saw a single stimulus: either a picture of a male face (Black or White) or a word connoting either safety or danger. Participants were asked to categorize each stimulus as quickly and accurately as possible by pressing one of two buttons. Importantly, the buttons used to categorize the stimuli changed during the course of the task. Below, we report the response categories assigned to the right-hand button (the alternate categories were assigned to the left). Stimuli remained on the screen until participants responded (a correct response was not required and no error feedback was given). Seven blocks were completed in the following order: (1) classifying faces in terms of race (24 trials, right button = Black), (2) classifying words as representing safety or danger (24 trials, right button = danger), (3) classifying both faces and words with a stereotype-congruent response mapping (48 trials, right button = Black or danger), (4) a second block identical to block 3 (96 trials), (5) classifying only faces, but with the original response mapping reversed (24 trials, right button = White), (6) classifying both faces and words with a stereotype-incongruent response mapping (48 trials, right button = White or danger), and (7) a second block identical to block 6 (96 trials). During the dual categorization blocks (3, 4, 6, & 7), stimulus type (face vs. word) alternated. Previous studies (e.g., Amodio & Devine, 2006; Cunningham et al., 2004; Glaser & Knowles, 2008; Hugenberg & Bodenhausen, 2004; Richeson & Shelton, 2003) have shown that participants tend to categorize stimuli in the congruent response mapping blocks (i.e., Black-danger; White-safety) more quickly than in the incongruent response mapping blocks (i.e., Black-safety; White-danger), indicating racial bias.
Target stimuli consisted of 12 pictures each of Black and White men, matched for attractiveness based on pilot data. Safety words were nice, kind, friend, trust, peaceful, happiness, protected, secure, harmony, unity, and caring. Danger words were violence, aggression, mean, brutal, nasty, attacking, knife, energy, fight, harmful, cruel, and fear.
Racial bias in reaction times was calculated as a D-score (as recommended by Greenwald, Nosek, & Banaji, 2003). This involved calculating two scores: (1) one value derived from subtracting the average reaction time in the first set of compatible and incompatible blocks (blocks 3 and 6) divided by the pooled standard deviation of these two blocks and (2) a second value calculated in the same manner using the second set of compatible and incompatible blocks (blocks 4 and 7). These were then averaged to obtain the final D-score. Trials with reaction times < 200 ms or > 10,000 ms were dropped, as were participants who had reaction times < 300 ms on more than 10% of trials. Following Greenwald et al. (2003), response latencies on incorrect trials were replaced with the block mean + 600 ms.
Self-report questionnaires
Participants completed the following questionnaires during session 1: (1) Attitudes Toward Blacks (Brigham, 1993), (2) Motivation to Control Prejudiced Reactions scale (Dunton & Fazio, 1997), and (3) Internal and External Motivation to Respond without Prejudice (Plant & Devine, 1998). Participants also completed feeling thermometers to assess racial attitudes, rating how they feel toward several social groups (Gay men, Hispanics, African Americans, Lesbians, Asian Americans, and White Americans) on a scale from 0 (Very Coolly) to 100 (Very Warmly). Participants’ personal stereotype content was measured using semantic differential line scales assessing the extent to which they perceived African Americans and Caucasians as possessing the following characteristics: aggression (anchored with not aggressive and aggressive), violence (anchored with not violent and violent), and dangerousness (anchored with not dangerous and dangerous). These three items were completed separately for African Americans and Caucasians. Cultural stereotype perceptions were measured by having participants respond to the same items but instructing them: “instead of telling us what you believe, we want you to tell us how you think most Americans would answer these questions.” Bias variables were created for the feeling thermometer, personal stereotype, and cultural stereotype questions by subtracting participants’ ratings for the separate White and Black items such that higher scores represented more pro-White/anti-Black bias.
Finally, we administered an indirect measure of race bias, a student group funding allocation task (Correll, Park, & Smith, 2008). Participants were told that data was being collected to determine which student groups should receive funding in light of an $11 million reduction in the university budget. They were then given a list of 30 student groups, and asked to rank order them in terms of program importance (1 as the most important, 30 as the least). Embedded in this list were four directly related to African Americans or racial minorities more generally: the African-American student association, the summer minority access to research training program, the minority arts and science program, and the prospective freshman minority visit program. The average rank of these four programs was subtracted from the average rank of four non-minority “neutral” student groups (i.e., the university community service center, the community health initiative, the fitness for life program, and the undergraduate research symposium) to create a measure of anti-black racial bias in funding allocations.
Data Scoring and Analysis
Questionnaire scoring
As highlighted throughout the work, a primary strength of our current approach is our ability to use multiple related measures to extract latent variables, which represent more accurate estimates of our conceptual variables. We applied this method to our self-report measures, entering all race-related items from the explicit measures into an exploratory factor analysis. To do this, the individual questionnaire items and the various bias scores (55 total items) were used to create a set of factor scores that more accurately captures the various constructs measured. Using principal axis factoring and promax rotation, we extracted four primary factors based on the scree plot and an eigenvalue cutoff of 2.0. Together these four factors explained 38% of the total variance. After examining the individual item loadings from the pattern matrix (see Appendix Table A1), we labelled these factors: (1) Personal Racial Attitudes (eigenvalue = 10.60, 19% of variance explained), (2) Internal Motivation to control prejudiced responding (eigenvalue = 5.35, 10% of variance explained), (3) External Motivation to control prejudiced responding (eigenvalue = 2.77, 5% of variance explained), and (4) Perceived Cultural Stereotypes (eigenvalue = 2.21, 4% of variance explained). To confirm our conceptual labels of these factors, we also examined factor correlations with the individual scales (scored as outlined by their original authors). As can be seen in Appendix Table A2, these correlations provide further evidence that the factors do indeed capture the conceptual variables described above. Extracted factors scores were used in all subsequent analyses.
Though not of focal interest, there are some noteworthy patterns in the data from this factor analysis (see Appendix Table A1). Although the various items we included were created to measure very specific constructs, many of them load onto multiple factors, contributing substantial variance to Personal Attitudes, Internal Motivation to control prejudiced responding, and External Motivation to control prejudiced responding. Also of note is the fact that despite separately measuring both personal and cultural stereotype endorsement (using the same scale and question formats), only the cultural stereotypes formed their own factor. Personal stereotypes were primarily captured by the Personal Attitude factor.
PDP scoring
For each of the three implicit measures of racial bias, we performed a PDP analysis based on error rates. This analysis attempts to separately estimate the extent to which participants’ responses were determined by control-related processes and “automatic” tendencies to indicate the presence of a threat. Following prior research (Payne, 2001; 2005), these control and automaticity estimates were computed separately for trials involving White and Black stimuli in the WIT and FPST. The control formulas represent the extent to which participants perform as intended given the goals of the task, and were calculated by subtracting the probability of an error on stereotype incongruent trials (e.g., a tool following a Black face prime in the WIT) from the probability of a correct response on a stereotype congruent trial (e.g., a gun following a Black face prime in the WIT). The automaticity formulas represent the extent to which stereotypes promote a “gun” response when control fails, and were calculated from the probability of an error on a tool trial, divided by one minus the control estimate. Past research has shown a greater contribution of automatic processes on trials with Black rather than White stimuli, yet no difference in control on Black and White trials (see Payne, 2001; 2005). Moreover, to the degree that the control estimates reflect ability to follow task requirements (e.g., identify a gun or tool while making no response to the primes in the WIT), PDP control should reflect a single underlying construct (Amodio et al., 2008). For each task, we therefore computed two primary indices on interest: (1) racial bias in the contribution of automatic processes to participants’ responses (i.e., the automatic tendency to indicate danger induced by Black stimuli – the automatic tendency to indicate danger induced by White stimuli) and (2) mean level of control (i.e., the average of control estimates induced by both White and Black stimuli).
Because of its more complicated task structure, PDP calculations were somewhat different for the IAT. For this task, we computed four separate control and automaticity estimates, one each for Black and White faces, and one each for danger and safety words. Each of these four computations followed the basic pattern outlined above, with control calculated as the probability of an incorrect response during a stereotype-incongruent block (e.g., a miscategorization of a Black face when Black and safety shared a response key) subtracted from the probability of a correct response during a stereotype-congruent block (e.g., a correct categorization of a Black face when Black and danger shared a response key). We then created two interim automaticity bias and mean control variables, one for face trials and another for word trials. These were averaged to obtain our final estimates of automaticity bias (representing the average amount of racial bias expressed on face and word trials) and mean control (representing the mean level of control across all trial types). Although PDP computations have been performed on the IAT (Huntsinger, Sinclair, & Clore, 2009; Stewart, von Hippel, & Radvansky, 2009), they are done so less frequently than with other measures of implicit bias. As a consequence, they might be viewed as more exploratory.
Data trimming and transformation
Following our previous studies (e.g., Friedman et al., 2008), we applied appropriate trimming and transformation to the EF data to improve the distributions and reduce the influence of outliers. First, for RT measures (shifting and Stroop), response latencies were trimmed according to Wilcox and Keselman (2003; equation 3). After this within-subject trimming, we also conducted between-subject trimming: For each measure, scores greater than 3 SD from the group mean were replaced with a value that was equal to 3 SD above or below the group mean, as appropriate. This replacement technique aimed to preserve each participant’s rank ordering, while preventing extreme outliers from unduly influencing correlations or model parameters. The short response windows used in the WIT and FPST resulted in a smaller range of response latencies, obviating the need for trimming. As noted earlier, we followed Greenwald et al.’s (2003) recommendation for the treatment of fast and slow response latencies in the IAT rather than employing the Wilcox and Keselman trimming.
There were two bias-related measures that were not normally distributed: Factor scores for the first questionnaire factor (Personal Attitude), and PDP control estimates for the IAT task. Normality was improved with natural log and arcsine transformations, respectively.
Analyses of response latencies in the WIT and FPST tasks were performed on log-transformed values, although data are reported in ms for ease of interpretation. After these trimming and transformation procedures were applied, all measures used in the structural equation models had skewness and kurtosis values between –1 and 1. For ease of interpretation, we reversed the directionality of EF reaction time variables (stop-signal, Stroop, and switch tasks) in all analyses so higher numbers indicate better performance.
Model estimation
Structural equation models were estimated using Mplus 6.12 to 7.2 (Muthén & Muthén, 1998–2012), which includes participants with missing data for one or more measures. (Models used all available data, which is why the Ns noted in the tables sometimes differed.) Because the χ2 is sensitive to sample size, we also used confirmatory fit index (CFI) < .95 and root-mean-square error of approximation (RMSEA) < .06 as indicators of good fit (Hu & Bentler, 1998). Statistical significance of parameters was established with χ2 difference (Δχ2) tests.
Models that included interactions between latent variables were estimated with TYPE=RANDOM and numerical integration, which provided full-information maximum likelihood estimates of the interactions (Klein & Moosbrugger, 2000); Mplus does not provide fit statistics for these models but does provide log-likelihood and scaling values that can be used for nested model comparisons (Satorra & Bentler, 2001). In cases when the calculation of the scaled Δχ2 from these comparisons resulted in a negative value (an improper value that can indicate that the constrained model is highly incorrect; Satorra & Bentler, 2010), we used Wald statistics to test significance. To assess overall fit for these models, the Mplus website FAQ on latent variable interactions (http://www.statmodel.com/faq.shtml) suggests ascertaining that the model without interactions fits the data well and then assessing whether added interactions are significant; this strategy is appropriate because chi-squares for models without interactions are not sensitive to leaving out the interaction (Mooijaart & Satorra, 2009) due to their non-inclusion of higher-order moments (beyond second-order variances and covariances). Hence, for models with interactions, we present fit statistics for the same models without interactions. Standardized interaction terms were calculated according to the method described in Wen, Marsh, and Hau (2010).
Procedure
Across two testing sessions, roughly 12 days apart, participants completed 9 EF tasks, 3 implicit racial bias tasks, several race-related questionnaires, and demographic measures. All EF tasks and questionnaires were completed during the first three-hour testing session; the three implicit racial bias tasks were completed during the second two-hour testing session.5
Because this study was designed expressly to examine individual differences, all participants completed both sessions’ tasks in a single, fixed order to minimize order effects. The first session tasks were administered in the following order: stop signal, demographic questions, spatial 2-back, category switch, Stroop, funding allocation measure of racial bias, 3–5 minute break, keep track, color/shape, letter memory, Motivation to Control Prejudice Responses scale (Dunton & Fazio, 1997), Internal and External Motivation to Control Prejudice scale (Plant & Devine, 1998), feeling thermometer, 3–5 minute break, antisaccade, number/letter, spatial 3-back, stereotype content measure, and Attitudes toward Blacks. During the second testing session, the three implicit measures of racial bias were administered in the following order: WIT, IAT, 3–5 minute break, and FPST.
All computerized tasks were administered on Macintosh computers (iMacs running OS X Leopard) and programmed in PsyScope, except for stop signal (an executable program run from a Windows XP partition on the iMacs). Responses were made using ms-accurate button boxes (IoLabs, United Kingdom) for all tasks except the Stroop, for which the timing of verbal responses was recorded with a headset microphone attached to this button box, and the stop-signal, which used a ms-accurate keyboard (Empirisoft, Inc, New York). For all tasks except the implicit measures of race bias, stimuli and trial order were presented in a single, fixed pseudorandom order to all participants. For the implicit measures of bias, the computer selected a new random order for each participant.
Results and Discussion
Before evaluating the theoretical issues of primary interest concerning relations between EF and implicit bias, we first examine basic descriptive aspects of our EF and implicit bias tasks. We specifically confirm the nested factor EF structure through a latent variable analysis, expecting Common EF, Updating-specific, and Shifting-specific factors, as described by Miyake and Friedman (2012). Next we confirm the efficacy of our implicit bias tasks, expecting mean levels of performance indicative of racial bias within each task. We then consider the important issue of interrelations among the bias measures, which we evaluate in terms of performance bias (i.e., being faster and more accurate on stereotype congruent than incongruent trials) as well as the contribution of automatic and controlled processes, as reflected in process dissociations estimates computed within the PDP framework (Jacoby, 1991).
Preliminary Analyses
Executive function model
Means, standard deviations, and reliabilities for each of the EF tasks are shown in Table 1, and their correlations are in Table 2. Figure 1 shows the nested factors EF model described by Miyake and Friedman (2012). Because these analyses use only the EF data from Session 1, they are based on a sample of 484 participants. Consistent with previous work (e.g., Friedman et al., 2011), we find Common EF, Updating-specific, and Shifting-specific factors. Inspection of the fit statistics and modification indices suggested a residual correlation between antisaccade and spatial n-back. After adding this post-hoc correlation, the model fit well, χ2(20) = 32.01, p = .043, CFI = 0.980, RMSEA = 0.035. We use this EF model in all subsequent analyses. As with past research (Friedman et al., 2011), we did not find evidence for an Inhibition-specific factor within this model. Specifically, the three inhibition tasks showed non-significant loadings on such a factor, and the residuals for the inhibition tasks did not significantly positively correlate with each other.6
Table 1.
Descriptive Statistics
| Dependent Measure | Mean (SD) | N | Reliability | Tests of Racial Bias | |
|---|---|---|---|---|---|
| t-value | p-value | ||||
| Executive Function Tasksa | |||||
| Response Inhibition | |||||
| Antisaccade | 61.98 (14.36) | 482 | .80 | ||
| Stop signal | 247 ms (32) | 458 | .41 | ||
| Stroop | 141 ms (70) | 477 | .94 | ||
| Updating | |||||
| Keep track | 73.32 (8.60) | 483 | .60 | ||
| Letter memory | 75.12 (13.49) | 482 | .91 | ||
| Spatial n-back | 80.73 (6.80) | 470 | .84 | ||
| Shifting | |||||
| Number–letter | 243 ms (156) | 480 | .92 | ||
| Color–shape | 241 ms (160) | 479 | .88 | ||
| Category switch | 156 ms (119) | 481 | .92 | ||
|
| |||||
| Implicit Measuresb | |||||
| Weapons Identification Task | |||||
| Accuracy Performance Bias | 0.17 (0.19) | 401 | .74 | 17.99 | < .001 |
| Reaction Time Performance Bias | 13 ms (23) | 401 | .46 | 11.25 | < .001 |
| First Person Shooter Task | |||||
| Accuracy Performance Bias | 0.03 (0.11) | 391 | .09 | 5.15 | < .001 |
| Reaction Time Performance Bias | −0.80 ms (16) | 391 | .07 | 1.22 | .22 |
| Implicit Association Test | |||||
| Accuracy Performance Bias | 0.03 (0.04) | 405 | .67 | 16.21 | < .001 |
| Reaction Time (D-score) Bias | 0.47 (0.27) | 402 | .87 | 34.89 | < .001 |
|
| |||||
| Explicit Measures | |||||
| Attitudes Toward Blacks | 2.37 (0.84) | 466 | .86 | ||
| Internal Motivation to Control Prejudice | 6.97 (1.75) | 481 | .85 | ||
| External Motivation to Control Prejudice | 4.99 (1.84) | 481 | .83 | ||
| Motivation to Control Prejudiced Reactions | 4.22 (0.79) | 482 | .81 | ||
| Feeling Thermometer Bias | 10.46 (21.28) | 480 | -- | 10.77 | < .001 |
| Personal Stereotype Bias | 0.29 (1.65) | 483 | .80 | 3.85 | < .001 |
| Perceived Cultural Stereotype Bias | 3.88 (2.39) | 483 | .91 | 35.63 | < .001 |
| Funding Allocation Bias | 5.93 (6.68) | 481 | -- | 19.47 | < .001 |
Note. Reliability assessed with odd-even reliability according to Cohen and Cohen (1984). Test of racial bias is a single-sample t-test comparing the variable’s mean to zero.
For EF tasks that are scored based on accuracy, higher values indicate better EF but for EF tasks that are scored based on reaction time, higher values indicate poorer EF. For model estimation, EF reaction time variables were reversed so that higher numbers indicated better EF for all EF variables.
Descriptives shown are for the untransformed variables. Models used transformed data to improve normality.
Table 2.
Correlations among EF Measures
| Task | 1 | 2 | 3 | 4 | 5 | 6 | 7 | 8 | 9 |
|---|---|---|---|---|---|---|---|---|---|
| 1. Antisaccade | -- | ||||||||
| 2. Stop-signal | .16* | -- | |||||||
| 3. Stroop | .18* | .09 | -- | ||||||
| 4. Keep-track | .19* | .03 | .17* | -- | |||||
| 5. Letter memory | .32* | .02 | .30* | .37* | -- | ||||
| 6. Spatial n-back | .39* | .04 | .14* | .31* | .38* | -- | |||
| 7. Number-letter | .18* | .11* | .23* | .07 | .12* | .11* | -- | ||
| 8. Color-shape | .07 | .00 | .12* | .02 | .06 | .06 | .37* | -- | |
| 9. Category-switch | .25* | .10* | .16* | .08 | .12* | .11* | .50* | .41* | -- |
Note. Correlations are maximum likelihood estimates (from Mplus) based on all data, adjusted for missing observations. Total N = 484.
p < .05. All data were scored so that higher numbers indicated better performance.
Figure 1.
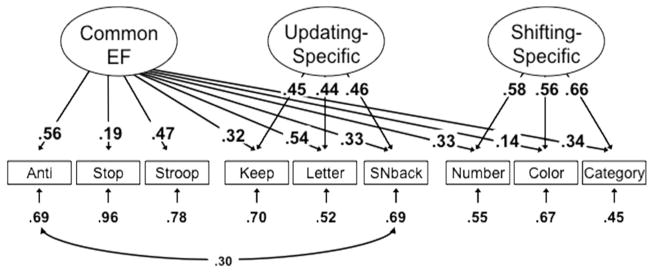
Executive Function (EF) model. Ovals indicate latent variables and rectangles indicate observed measures. Numbers on straight arrows are standardized loadings, numbers on curved, double-headed arrows are correlations, and numbers at the end of arrows are residual variances. There is a Common EF latent variable on which all nine executive function tasks load, as well as two “nested” latent variables on which the updating and shifting tasks, respectively, also load. The Common EF variance was isomorphic with the Inhibition latent variable, so there was no Inhibition-specific variance. Because the Common EF factor captures the variance common to all three EFs, the Updating-specific and Shifting-specific factors capture the variance that is unique to updating and shifting, respectively. Hence, they are uncorrelated with the Common EF factor and with each other. In all models, EF variables were scored so that higher numbers indicate better performance. Anti = antisaccade, Stop = stop-signal, Letter = letter memory, SNback = spatial n-back, Number = number-letter, Color = color-shape, Category = category-switch. Boldface type indicates p < .05.
Implicit bias tasks
Racial bias in accuracy was of primary interest in WIT and FPST due to the short response deadline used in both tasks, whereas racial bias in reaction time was of primary interest in the IAT due to its lack of response deadline. We nevertheless calculated bias in both types of responses for all measures. Mean performance bias, SDs, and reliabilities for each of the implicit bias tasks are shown in Table 1. Also included are tests of mean levels of racial bias, all coded such that higher numbers indicate that the association between Blacks and danger is stronger than the association between Whites and danger. Because these analyses use data from Session 2, they are based on the 406 participants who completed Session 2. As expected, racial bias (indicating a stronger association between Blacks and danger) was present across all tasks (although not significantly so in reaction time on FPST, likely due to the tight response deadline).7 Mean accuracy and reaction times within each condition for each task are shown in Appendix Table A3.
PDP control and automaticity estimates for each task are shown in Table 3. The current data replicate past findings of relatively greater automaticity on trials involving Blacks than Whites (e.g., Payne, 2001, 2005). Although prior work typically does not find racial differences in the PDP control estimates, the power afforded by our large sample revealed significant race differences in PDP control in all three tasks, albeit in differing directions and of relatively small magnitude. Given the inconsistent and small effects (and lack of precedent for such findings) we caution over-interpretation of this result. Correspondingly, we follow convention throughout the remainder of the analyses and focus on mean PDP estimates of control and bias in PDP estimates of automaticity (i.e., PDP auto on Black trials – PDP auto on White trials) (see Payne, 2005). Note that although error rates were lower in the IAT than WIT and FPST (see Table A3), the IAT PDP control estimate had high reliability (Table 3). Reliability for PDP auto was more modest for the IAT, but exceeded that of the FPST. Moreover, the large number of trials we administered in each task resulted in higher absolute numbers of errors than is often obtained with these tasks (Table A3).
Table 3.
Process Dissociation Procedure Parameter Estimates for Implicit Bias Measures
| Bias Measure | Control | t-value | Automaticity | t-value |
|---|---|---|---|---|
| Weapons Identification Task | .92rel | .64rel | ||
| Black | .48 (.19) | .61 (.14) | ||
| White | .50 (.18) | .45 (.15) | ||
| Racial Biasa | −.02 (.11) | 3.31* | .16 (.17) | 19.44* |
| First Person Shooter Task | .91rel | .14rel | ||
| Black | .50 (.20) | .56 (.13) | ||
| White | .45 (.17) | .53 (.12) | ||
| Racial Biasa | .05 (.10) | 9.72* | .04 (.11) | 6.64* |
| Implicit Association Test | .93rel | .36rel | ||
| Black | .91 (.07) | .59 (.19) | ||
| White | .89 (.09) | .59 (.19) | ||
| Danger | .78 (.15) | .58 (.19) | ||
| Safety | .83 (.12) | .68 (.16) | ||
| Racial Biasb | −.01 (.06) | 4.72* | .22 (.19) | 22.77* |
Note. Standard deviations in parentheses. The t values represent tests of the magnitude of bias against zero, showing whether there is differential control or automaticity associated with trials involving Blacks compared to Whites.
Racial Bias = Black estimate − White estimate.
Racial Bias = [(Black Estimate − White Estimate) + (Danger Estimate − Safety Estimate)]/2. Rel=reliability.
p ≤ .001
We next examined bivariate correlations between the racial bias measures (see Table 4), which are particularly relevant for ascertaining whether the different implicit bias measures assess the same underlying constructs and, hence, whether they can be used to construct latent variables. These correlations show that WIT and FPST are most closely related (despite the very low internal reliability estimates for FPST). At the level of overall performance, accuracy bias for WIT and FPST were significantly correlated. The D-score measure that is most traditional for the IAT did not significantly correlate with the accuracy bias scores for the other two tasks (although there was a small correlation between WIT accuracy bias and IAT accuracy bias). The pattern was similar for the PDP auto measures, with only WIT and FPST correlating. There were no significant relationships among the three reaction time measures. Thus, despite the fact that all three implicit measures were designed to assess the same stereotype content (i.e., mental associations between race and weapons/danger), it appears that there are some very real differences in the constructs they measure and/or the processes they reflect.
Table 4.
Intercorrelations among Implicit Measures and their Associated PDP Estimates
| Measure | 1 | 2 | 3 | 4 | 5 | 6 | 7 | 8 | 9 | 10 | 11 | 12 |
|---|---|---|---|---|---|---|---|---|---|---|---|---|
| Accuracy Bias | ||||||||||||
| 1. WIT | -- | |||||||||||
| 2. FPST | .18* | -- | ||||||||||
| 3. IAT | .11* | .02 | -- | |||||||||
| Reaction Time Bias | ||||||||||||
| 4. WIT | .37* | .13* | −.02 | -- | ||||||||
| 5. FPST | −.01 | −.09 | .05 | .01 | -- | |||||||
| 6. IAT (D-score) | .07 | .05 | .45* | .06 | .01 | -- | ||||||
| PDP Auto Estimate - Bias | ||||||||||||
| 7. WIT | .89* | .20* | .05 | .40* | .02 | .09 | -- | |||||
| 8. FPST | .12* | .91* | −.05 | .15* | −.03 | .02 | .16* | -- | ||||
| 9. IAT | .10* | .05 | .77* | .00 | .06 | .48* | .10 | .02 | -- | |||
| PDP Control Estimate - Mean | ||||||||||||
| 10. WIT | −.26* | .05 | −.18* | .10 | .05 | .04 | .05 | .11* | .02 | -- | ||
| 11. FPST | −.09* | .14* | −.13* | .18* | .06 | .01 | .08 | .22* | .03 | .61* | -- | |
| 12. IAT | −.03 | .10 | −.50* | .06 | −.01 | −.10* | .06 | .14* | .00 | .37* | .29* | -- |
Note: Correlations are maximum likelihood estimates (from Mplus) based on all data, adjusted for missing observations. Total N = 406. RT = reaction time.
p < .05.
Although the tasks appear to dissociate in performance bias and racial bias in PDP auto, very different conclusions are evident when examining the PDP control estimates. Here, all three tasks do appear to be measuring similar constructs, evident both in terms of the magnitude of the relation and the number of tasks correlating with each other. Mean level of control was correlated across all three tasks, suggesting substantial overlap in the control assessed by each task. It is important to note, however, that although IAT PDP control was correlated with the control estimates from the other two tasks (.37 and .29) those correlations were substantially lower than the correlation between control estimates for WIT and FPST (.61). We will return to this issue in more detail under discussion of hypothesis H3.
Together, these results suggest the following conclusions. Our tasks were effective in assessing implicit racial stereotyping; replicating scores of prior studies, our participants associated Blacks more strongly with threat and danger than they did Whites. However, while all tasks were designed to assess these same mental associations, performance across tasks was only weakly related. This was especially true of the IAT, as the strongest and most consistent relations were between WIT and FPST. Across the different types of information provided by these tasks (i.e., accuracy performance bias, reaction time performance bias, PDP auto, PDP control), they covary most strongly in terms of the level of control they elicit.
Effect of Automatic Processes and Executive Functions on Implicit Bias (H1 & H2)
We evaluated our primary theoretical questions regarding the relation between EF and implicit bias through structural equation modeling using latent variables for our constructs of interest. The dissociation of IAT from WIT and FPST (see Table 4) precluded formation of a single latent implicit bias variable from all three tasks. In the sections that follow, we present two separate instantiations of each analysis, first using a latent implicit bias variable constructed from performance on the WIT and FPST tasks, then conducting parallel analyses using IAT performance. Figure 2 shows the latent accuracy performance bias, PDP auto, and PDP control variables created from the WIT and FPST, estimated separately.
Figure 2.

Three latent variable models for bias measures. Numbers on straight arrows are standardized loadings, and numbers at the end of arrows are residual variances. In each model, analogous measures (bias scores, PDP auto (A) scores, or PDP control (C) scores) from the Weapons Identification Task (WIT) and First Person Shooter Task (FPST) load on a single latent variable. Because each factor has only two indicators, path loadings (on standardized scores) are constrained to be equal to ensure statistical identification. Boldface type indicates p < .05.
WIT and FPST
Our first model was designed to examine the degree to which implicit racial bias is a function of (1) EF, (2) automatic processes as reflected in PDP auto estimates, and (3) the interaction of EF and PDP auto. As described in the earlier Model Estimation section, we first estimated a model without interactions, which resulted in good fit, χ2(51) = 71.95, p = .028, CFI = 0.989, RMSEA = 0.029. Note that we allowed the residual variances for the bias measures from the same tasks to correlate to account for task-specific method covariance (i.e., the variance in WIT performance bias explained by the Performance Bias latent variable was allowed to correlate with the variance in WIT PDP auto not explained by the PDP auto latent variable, and the same for FPST). We then added interactions between PDP auto and EF to test H2. We started with preliminary models that included all three aspects of EF from Figure 1 (Common EF, Updating-specific, and Shifting-specific) as well as interactions of all three with PDP auto. There were never any significant interactions of the Updating-specific or Shifting-specific factors with PDP auto in the WIT/FPST analyses. For the sake of clarity, therefore, all subsequent models of implicit bias in WIT and FPST include only the Common EF x PDP auto interaction. This model, shown in Figure 3, confirmed our predictions. Specifically, we found that both racial bias in automatic processes and Common EF predict performance bias. As specified in H1, racial bias increased as a function of relatively greater automatic processes on Black than White trials, Wald test (1) = 65.46, p < .001, but decreased as a function of Common EF, Wald test (1) = 21.65, p < .001.
Figure 3.

Structural equation model predicting implicit bias (latent variable constructed from accuracy bias scores on the WIT and the FPST) with Common EF, PDP auto (latent variable constructed from PDP auto scores on the WIT and FPST), and the interaction of PDP Auto and Common EF. Ovals indicate latent variables (individual indicators not shown for simplicity). Numbers on straight arrows are standardized path coefficients, numbers on curved double-headed arrows are correlations, and numbers at the end of arrows are residual variances. The residual variance for Implicit Bias was constrained to be 0.0 to prevent a non-significant negative residual variance. Boldface type indicates p < .05.
This model also considered that the relationship between PDP auto and bias might be moderated by EF (e.g., Payne, 2005). To the degree that EF is needed to exert control over automatically activated racial associations, we would expect the relationship between automatic processes and performance bias to be weaker for those with greater EF (H2). This predicted Common EF x PDP auto interaction was significant, Wald test (1) = 45.29, p < .001. The interaction is depicted in Figure 4, with low and high values of Common EF estimated at −/+ 1 SD. As can be seen, the positive relation between PDP auto and implicit bias occurs for both those low (simple slope b = 1.25, SE = 0.14, z = 8.84, p < .001) and high (simple slope b = 0.63, SE = 0.11, z = 5.95, p < .001) in Common EF but is weaker for those high in Common EF, as hypothesized. As a result, at high levels of PDP auto, implicit bias is greater for those lower in Common EF (simple slope b = –0.54, SE = 0.08, z = –6.84, p < .001). By contrast, when PDP auto is low, implicit bias is not significantly different for those low and high in Common EF (simple slope b = 0.08, SE = 0.05, z = 1.49, p = .137). Together, these results validate and extend the findings of prior research. As others have documented, participants’ responses on implicit bias measures are significantly contaminated by individual differences in EF (Klauer et al., 2010). Those individuals with high levels of EF display lower levels of bias. Although one plausible explanation for this effect is the presence of stronger racial stereotypes among low EF-individuals, the interaction observed between Common EF and PDP auto suggests that more complex processes are at play. For participants relatively low in EF, bias in PDP auto translates more directly into performance bias on the implicit measures. Participants relatively high in EF, however, are better able to prevent these biased associations from influencing their behavior. The pattern of these results also suggests that, when PDP auto is low, EF has virtually no effect. This suggests that, in the absence of a stereotypic impulse, EF does not matter. However, when PDP auto is high, suggestive of a strong stereotypic response tendency, EF ability plays a critical role. Participants who are higher in EF seem better able to avoid behaving in line with their automatic tendencies.
Figure 4.

Plot of simple slopes for the PDP Auto x Common EF interaction predicting implicit bias shown in Figure 3, created with the plot function in Mplus. Solid lines for Low and High Common EF represent one standard deviation below or above the mean, with dashed and dotted lines depicting the 95% confidence intervals.
IAT
To evaluate the contribution of EF to performance on the IAT, we estimated an additional structural equation model in which just the IAT reaction time based D-score was regressed on the EF variables (see Figure 5). The model without interactions fit the data well, χ2(32) = 49.25, p = .026, CFI = 0.976, RMSEA = 0.033. Given that an association between IAT performance and Shifting has been demonstrated before (Klauer et al., 2010), we present the full model with interactions between all three EF latent variables and PDP auto.
Figure 5.

Structural equation model predicting implicit bias in the IAT with executive functions (EF), PDP auto scores, and their interactions. Ovals indicate latent variables (individual indicators not shown for simplicity), rectangles indicate observed measures. Numbers on straight arrows are standardized loadings, numbers on curved double-headed arrows are correlations, and numbers at the end of arrows are residual variances. This model is analogous to the one shown in Figure 3, but because IAT shows different relations with the EF components, we depict all three possible interaction effects. Boldface type indicates p < .05.
This model revealed two significant predictors of IAT bias. First, replicating the relationship found in the WIT/FPST analysis, relatively greater racial bias in automaticity was associated with greater IAT performance bias, Wald test (1) = 94.79, p < .001. Second, consistent with prior demonstrations that the IAT contains a shifting component (Klauer et al., 2010), Shifting-specific ability was negatively associated with IAT bias, Δχ2(1) = 21.80, p < .001, indicating that greater Shifting-specific ability was associated with the expression of less racial bias on the IAT. In contrast with the model predicting bias in WIT and FPST (Figure 3), Common EF was unrelated to IAT bias, Δχ2(1) = 0.03, p = .861, and there were no interactions between any aspect of EF and PDP auto (H2), all Δχ2(1) < 2.67, p > .102.
Relationship of Executive Functions with PDP Control and Auto (H3)
EFs have been theorized to play a role in PDP control but not auto (Payne, 2005). To test this prediction and to assess which aspects of EF relate to PDP control, we estimated a series of structural equation models in which WIT, FPST, and IAT PDP control and auto values were separately regressed on the EF variables. Standardized path coefficients are shown in Table 5. All of these models fit the data well, all χ2(26) < 43.41, p > .017, CFI > 0.972, RMSEA < 0.038.
Table 5.
Standardized Path Coefficients from EF Latent Variables to PDP Control and Auto
| Bias Variables | Common EF | Updating-Specific | Shifting-Specific |
|---|---|---|---|
| WIT PDP Control | .41* | −.06 | −.05 |
| FPST PDP Control | .45* | −.04 | .11 |
| IAT PDP Control | .08 | .20* | −.14* |
| WIT PDP Auto | −.02 | .07 | .08 |
| FPST PDP Auto | .06 | .00 | −.10 |
| IAT PDP Auto | −.09 | .06 | −.06 |
Note. Each row represents a separate structural equation model in which the bias variable was regressed on the three EF latent variables.
p < .05.
Consistent with H3, EFs predicted PDP control but not auto. However, the pattern of relations between EF and PDP control differed across bias tasks. Although bivariate correlations among the PDP control estimates showed significant relations among all three tasks (rs ranging from .29 to .61; see Table 4), these correlations obscured important differences in the types of control elicited from the tasks. While control in the WIT and FPST was related to Common EF, control during the IAT was not. Instead, IAT control was related to both Updating-specific (positively) and Shifting-specific (negatively) abilities. We had no a priori reason to expect a relation with the Updating-specific factor, and the relation with Shifting-specific abilities indicated that the ability to follow task instructions during the IAT declined as Shifting-specific abilities increased. Notwithstanding the difficulty of interpreting these relations, they (as well as those in Table 4) indicate that the PDP-derived IAT control scores reflect a very different process than that assessed by the PDP control scores for the WIT and FPST tasks.
EF Moderates the Relation between Implicit and Explicit Bias (H4)
Our next set of analyses examined the moderating effect of EF on the relation between implicit and explicit measures of racial bias. These measures are often found to correlate only weakly (e.g., Blair, 2001; Cunningham et al., 2001; Fazio & Olson, 2003), which has been attributed to the greater susceptibility of explicit measures to controlled processes (e.g., Koole et al., 2001; Ranganath et al., 2008). If so, EF and implicit bias may interact in predicting explicit bias, with implicit measures more strongly predicting explicit responses for people who have low EF (H4). The bivariate correlations between the implicit bias measures and the factor scores from the explicit bias measures shown in Table 6 confirm the general expectation of low relations between the two. Although there were several significant correlations between the Personal Attitude factor (factor 1) and implicit measures (WIT and IAT accuracy and RT performance bias), the size of the relations was modest (rs < .17).
Table 6.
Intercorrelations among Factor Scores of Explicit Measures and Individual Implicit Measures
| Measure | Extracted Factor | |||
|---|---|---|---|---|
| 1. Personal Attitude | 2. Internal Motivation | 3. External Motivation | 4. Cultural Stereotypes | |
| WIT Accuracy Performance Bias | .16* | −.01 | .05 | .06 |
| FPST Accuracy Performance Bias | .05 | −.08 | −.05 | .04 |
| IAT Accuracy Performance Bias | .16* | −.04 | .04 | .10 |
| WIT RT Performance Bias | .16* | −.03 | −.02 | .02 |
| FPST RT Performance Bias | .07 | .00 | .01 | −.03 |
| IAT D-score Performance Bias | .16* | −.03 | .06 | .06 |
| WIT PDP Auto | .09 | .02 | .06 | .08 |
| FPST PDP Auto | .04 | −.07 | −.05 | .05 |
| IAT PDP Auto | .11* | .02 | .06 | .07 |
| WIT PDP Control | −.18* | .12* | .05 | −.01 |
| FPST PDP Control | −.09 | .02 | .02 | .03 |
| IAT PDP Control | −.17* | .13* | .03 | −.02 |
Note. Higher values indicate greater racial bias in accuracy, reaction time, and PDP auto, higher mean control, more negative personal attitudes, higher internal and external motivation to control prejudice, and stronger perceived stereotypes. Correlations are maximum likelihood estimates (from Mplus) based on all data, adjusted for missing observations. Total N = 481. RT = reaction time.
p < .05.
WIT and FPST
We tested whether EF moderates the relationship between implicit bias and explicit bias with the structural equation model shown in Figure 6. This model uses the WIT and FPST latent performance bias variable and the Personal Attitudes factor from our factor analysis (factor 1) as the explicit bias measure. The model without interactions fit the data well, χ2(42) = 64.75, p = .014, CFI = 0.964, RMSEA = 0.033. When taking this latent variable perspective, implicit bias significantly predicted explicit attitudes. However, there was no indication that this relation depended on EF, as shown by the non-significant Common EF x Implicit Bias interaction. The only other significant predictor was Updating-specific ability; relatively greater Updating-specific ability was associated with less negative explicit attitudes towards Blacks. It is difficult to determine what this relationship might signify as the Updating-specific factor is probably the least well-understood in terms of its primary sources of variance (Miyake & Friedman, 2012), with candidates being working memory gating by the basal ganglia, retrieval from long-term memory, and perhaps capacity limitations.8
Figure 6.

Structural equation model predicting Personal Attitudes (factor 1 in Table A1) with executive functions (EF), implicit bias, and the interaction of bias with Common EF. Ovals indicate latent variables (individual indicators not shown for simplicity), rectangles indicate observed measures. Numbers on straight arrows are standardized loadings, numbers on curved double-headed arrows are correlations, and numbers at the end of arrows are residual variances. Boldface type indicates p < .05.
IAT
Similar effects were observed when predicting explicit attitudes from IAT bias (Figure 7). The model without interactions fit the data well, χ2(32) = 47.55, p = .038, CFI = 0.975, RMSEA = 0.032. IAT bias significantly predicted explicit attitudes, but this relation was not moderated by any aspect of EF. As in the WIT/FPST model, greater Updating-specific ability was associated with less negative explicit attitudes (as should be expected given that these two variables are the same across the models depicted in Figures 6 and 7). However, in contrast to the WIT/FPST model, the path from Shifting-specific to Personal Attitudes also reached significance, suggesting that better Shifting-specific ability was also associated with less negative explicit attitudes.
Figure 7.

Structural equation model predicting Personal Attitudes (factor 1 in Table A1) with executive functions (EF), implicit bias in the IAT, and their interactions. Ovals indicate latent variables (individual indicators not shown for simplicity), rectangles indicate observed measures. Numbers on straight arrows are standardized loadings, numbers on curved double-headed arrows are correlations, and numbers at the end of arrows are residual variances. This model is analogous to the one shown in Figure 6, but because IAT shows different relations with the EF components, we depict all three possible interaction effects. Boldface type indicates p < .05.
Motivation to Control Prejudice, EF, and Implicit and Explicit Bias (H5 & H6)
WIT and FPST
Our last set of analyses focused on relations among motivations to control prejudice, EF, and implicit bias. We have already established that EF weakens the relation between automatic processes and implicit bias (H2, Figure 3), showing that domain-general control abilities affect the expression of implicit racial bias. Our interest here is in the role of race-specific control concerns, in the form of motivations to control prejudice. We had two specific predictions: that motivation to control prejudice contributes to variability in bias above and beyond the contribution of EF (H5), and that EF and motivation to control prejudice interact to affect bias (H6). We evaluated these hypotheses for both implicit and explicit bias. If both the domain-specific concern about appearing biased in this particular context and the general ability to implement control are needed to modulate the impact of biased automatic associations, implicit and explicit bias should be lowest among those who have both high motivation to control prejudice and high levels of EF. This may be especially true for internal sources of motivation (cf. Amodio et al., 2003, 2008; Devine et al., 2002; Gonsalkorale et al., 2011).
These hypotheses are tested in the model depicted in Figure 8 using the Personal Attitudes factor from our factor analysis (factor 1) to represent explicit bias, and the Internal and External Motivation factors (factors 2 and 3, respectively) for the two motivation variables. The model without interactions fit the data well, χ2(56) = 84.70, p = .008, CFI = 0.966, RMSEA = 0.033. Consistent with H5, Internal Motivation independently predicted both Implicit Bias and Personal Attitudes. In both cases, higher levels of Internal Motivation were associated with lower levels of racial bias. Consistent with past research (Devine et al., 2002), External Motivation was positively associated with negative Personal Attitudes, indicating that higher levels of external motivation to control prejudice are associated with higher levels of explicit bias (controlling for internal motivation). External Motivation did not directly predict implicit bias, but did interact with Common EF. This interaction is depicted in Panel A of Figure 9 and provides some support for H6. For individuals with lower Common EF, higher External Motivation is associated with higher levels of implicit bias, (simple slope b = 0.43, SE = 0.20, z = 2.17, p = .030), but this relation weakens at higher levels of Common EF, (simple slope b = –0.25, SE = 0.18, z = –1.39, p = .165). This relation suggests that the tendency for External Motivation to be associated with greater bias is particularly true when Common EF is low. Note that Common EF moderated the effects of External Motivation only for implicit but not explicit bias.
Figure 8.

Structural equation model predicting implicit bias (latent variable constructed from bias scores on the Weapons Identification Task and the First Person Shooter Task) and Personal Attitudes (factor 1 in Table A1) with executive functions (EF), Internal and External Motivation to control prejudice (factors 2 and 3 in Table A1), and the interactions of these motivation scores with Common EF. Ovals indicate latent variables (individual indicators not shown for simplicity), rectangles indicate observed measures. Numbers on straight arrows are standardized loadings, numbers on curved double-headed arrows are correlations, and numbers at the end of arrows are residual variances. Boldface type indicates p < .05.
Figure 9.

Plot of simple slopes for the External Motivation x Common EF interactions shown in Figures 8 and 11, using the plot function in Mplus. Solid lines for low and high common EF represent one standard deviation below or above the mean, with dashed and dotted lines depicting the 95% confidence intervals. Panel A shows interaction of External Motivation and Common EF predicting the latent implicit bias score from Weapons Identification Task and First Person Shoot Task. Panel B shows the same interaction predicting IAT D-scores; although the 95% confidence intervals overlap in this latter figure, the interaction was significant according to the chi-square difference test (p < .05).
The only other significant effects in this model were negative relations of Shifting-specific and Updating-specific abilities with negative Personal Attitudes. These indicate that higher levels of Shifting-specific and Updating-specific abilities are associated with lower levels of explicit bias, as was the case in Figure 7. The direct relation between Common EF and implicit bias was not significant in this model, but its size and direction were the same as the model in Figure 3 (in this latter model, the PDP auto factor explained a good deal of variance in Performance Bias, which resulted in less error variance and tighter confidence intervals). Unlike the Shifting-specific and Updating-specific factors, Common EF did not predict explicit bias.
Together, these results confirm H5 in showing the effect of domain-specific internal motivation to control prejudice responses on racial bias. Consistent with theorizing that motivation to control prejudice should reduce its expression, higher Internal Motivation predicted both lower levels of implicit and explicit bias independent from EF ability. Support for this hypothesis was more mixed for External Motivation. There was no direct effect of External Motivation to control prejudice on implicit bias but it did predict more negative explicit racial attitudes. Moreover, instead of exerting a direct effect on implicit bias, the effect of External Motivation was moderated by Common EF, with the tendency toward greater bias among those with higher External Motivation observed in past research (Amodio et al., 2003, 2008; Devine et al., 2002; Gonsalkorale et al., 2011) weakening as Common EF increased. By contrast, the benefits of high Internal Motivation to control prejudice did not depend on Common EF. In this way, the results show an intriguing dissociation between internal and external sources of motivation to control prejudice, with internal motivation having a beneficial effect on implicit bias regardless of domain-general EF abilities. Because they are personally endorsed, internal sources of motivation are arguably more well practiced and thus may require fewer cognitive resources to implement (Amodio et al., 2006, 2008; Devine et al., 2002; Monteith, 1993; Monteith, Lybarger, & Woodcock, 2009), helping to uncouple them from overall EF abilities. By contrast, responding to social perceptions of appropriate behavior may be more resource dependent, causing the implementation of external motivations to rely more strongly on general EF abilities. Our results suggests this is more true for implicit than explicit bias.9
Under most extant theorizing, attempts to control implicit bias are thought to operate primarily through the recruitment of effortful processing rather than through changes in automatic processes. We would thus expect the effects of EF and motivation observed in Figure 8 to occur primarily through effects on PDP control but not auto. We tested this idea using the model depicted by Figure 10. Here Internal Motivation, External Motivation, the three aspects of EF, and the Common EF x Motivation interactions were used to predict both PDP control and PDP auto. The model without interactions fit the data well, χ2(67) = 93.93, p = .017, CFI = 0.969, RMSEA = 0.029. As expected, there were no effects of any aspect of EF or motivation on PDP auto. By contrast, both Common EF and Internal Motivation were independent predictors of PDP control. External Motivation, however, had no unique effect on the implementation of control. Note also the absence of EF x Motivation interactions on control, suggesting that when overall performance on implicit bias tasks is decomposed into estimates of underlying processes, the influence of motivations to control prejudice are not moderated by EF ability.
Figure 10.

Structural equation model predicting PDP Auto and PDP Control (latent variables constructed from the PDP scores on the Weapons Identification Task and the First Person Shooter Task; residuals for each test allowed to correlate) with executive functions (EF), Internal and External Motivation to control prejudice (factors 2 and 3 in Table A1), and the interactions of these motivation scores with Common EF. Ovals indicate latent variables (individual indicators not shown for simplicity), rectangles indicate observed measures. Numbers on straight arrows are standardized loadings, numbers on curved double-headed arrows are correlations, and numbers at the end of arrows are residual variances. Boldface type indicates p < .05.
IAT
The same model predicting implicit and explicit bias from EF and motivation to control prejudice is shown in Figure 11, using the IAT D-score as the measure of implicit bias. The model without interactions fit the data well, χ2(44) = 59.48, p = .060, CFI = 0.981, RMSEA = 0.027. Consistent with H5, and replicating the pattern seen with the WIT and FPST, Internal Motivation was an independent predictor of IAT bias, with less bias expressed by individuals higher in Internal Motivation. However, the IAT analyses also showed an independent effect of External Motivation: Higher levels of External Motivation were associated with more implicit bias. As with the WIT/FPST analysis and consistent with H6, External Motivation also interacted with Common EF. This interaction, depicted in Panel B of Figure 9, was similar to that obtained with WIT and FPST: The positive relation between External Motivation to control prejudice and IAT bias seen at low Common EF (simple slope b = 0.31, SE = 0.11, z = 2.92, p = .004) was eliminated in those with higher Common EF (simple slope b = −0.01, SE = 0.10, z = −0.09, p = .931).
Figure 11.

Structural equation model predicting implicit bias on the IAT and Personal Attitudes (factor 1 in Table A1) with executive functions (EF), Internal and External Motivation to control prejudice (factors 2 and 3 in Table A1), and the interactions of these motivation scores with Common EF. This model is analogous to the one shown in Figure 8. Ovals indicate latent variables (individual indicators not shown for simplicity), rectangles indicate observed measures. Numbers on straight arrows are standardized loadings, numbers on curved double-headed arrows are correlations, and numbers at the end of arrows are residual variances. Boldface type indicates p < .05.
As with the WIT/FPST analyses, we computed a model in which motivation and EF predicted IAT PDP control and auto to assess whether motivation and EF primarily influence control but not auto (Figure 12). The model without interactions fit the data well, χ2(44) = 63.47, p = .029, CFI = 0.969, RMSEA = 0.030. Replicating the pattern seen with WIT/FPST, Internal Motivation was associated with greater control. The only other significant predictor was Shifting-specific ability. As noted previously (Table 5), greater Shifting-specific ability is associated with less control in the IAT.
Figure 12.

Structural equation model predicting PDP Auto and PDP Control for the IAT with executive functions (EF), internal and external motivation to control prejudice (factors 2 and 3 in Table A1), and the interactions of these motivation scores with Common EF. This model is analogous to the one shown in Figure 10. Ovals indicate latent variables (individual indicators not shown for simplicity), rectangles indicate observed measures. Numbers on straight arrows are standardized loadings, numbers on curved double-headed arrows are correlations, and numbers at the end of arrows are residual variances. Boldface type indicates p < .05.
General Discussion
The present study sought to provide a comprehensive assessment of the relationship between EF and implicit racial bias. We begin our discussion of the results with an examination of the primary methodological and theoretical contributions made by this study and how they relate to our primary hypotheses concerning the ways in which EF moderates expression of implicit bias (H1 and H2) and what this implies about the nature of control over implicit bias. We then discuss effects related to the ancillary predictions and other implications of our results. Because of the large number of hypotheses assessed, we also summarize results with respect to each specific hypothesis in Table 7.
Table 7.
Summary of Results
| Number | Hypothesis | WIT/FPST Result | IAT Result |
|---|---|---|---|
| H1 | Performance on implicit bias tasks reflects both EF and automatic processes. | SUPPORTED: Greater bias in PDP auto predicts higher performance bias. Greater Common EF predicts lower performance bias (Figure 3). | SUPPORTED: Greater bias in PDP auto predicts higher performance bias. Greater Shifting-specific ability predicts lower performance bias (Figure 5). |
| H2 | EF moderates the effect of automatic processes on implicit bias, with automatic processes more directly driving performance bias among those with weaker EF abilities. | SUPPORTED: Common EF and PDP auto interact, with the positive relation between PDP auto and bias weakened at higher levels of EF (Figures 3 and 4). | NOT SUPPORTED: No interaction between any aspect of EF and PDP auto (Figure 5). |
| H3 | EF should relate to control but not automatic processes. | SUPPORTED: Greater Common EF ability was associated with greater control. As predicted, no relations between EF and PDP auto (Table 5). | MIXED: Greater Updating-specific ability was associated with greater control, but greater Shifting-specific ability was associated with less control. As predicted, no relations between EF and PDP auto (Table 5). |
| H4 | EF moderates the relation between implicit and explicit bias, with a stronger implicit-explicit relation when EF is low. | NOT SUPPORTED: Negative Personal Attitudes (Factor 1) were positively predicted by stronger implicit bias and negatively by Updating-specific ability, but Common EF did not interact with Implicit Bias (Figure 6). | NOT SUPPORTED: Negative Personal Attitudes (Factor 1) were positively predicted by stronger implicit bias and negatively by Updating-specific ability, but no aspects of EF interacted with Implicit Bias (Figure 7). |
| H5 | Bias will be negatively associated with Internal Motivation but positively associated with External Motivation, even when controlling for EF. | SUPPORTED for Internal Motivation; MIXED for External Motivation: Greater Internal Motivation was associated with less negative implicit and explicit bias. External motivation was unrelated to implicit bias, and was associated with more negative Personal Attitudes (Figure 8). | SUPPORTED for Internal and External Motivation: Greater Internal Motivation was associated with less negative implicit and explicit bias. Greater external motivation was associated with more negative implicit and explicit bias (Figure 10). |
| H6 | EF moderates the effect of motivation to control prejudice on implicit bias, with motivation more effectively translating into decreased bias when EF is high. | NOT SUPPORTED for Internal Motivation; SUPPORTED for External Motivation: No Common EF and Internal Motivation interaction. Common EF did interact with External Motivation in predicting implicit bias. The positive relation between External Motivation and implicit bias is strongest for people who have low Common EF (Figures 8 and 9). | NOT SUPPORTED for Internal Motivation; SUPPORTED for External Motivation: No Common EF and Internal Motivation interaction. Common EF did interact with External Motivation in predicting implicit bias. The positive relation between External Motivation and implicit bias is strongest for people who have low Common EF (Figures 9 and 10). |
The basic question of whether cognitive control is involved in performance on laboratory measures of implicit racial bias has been the focus of researchers’ attention for some time now (see Amodio & Mendoza, 2010; Bartholow et al., 2006, 2012; Conrey et al., 2005; Klauer & Mierke, 2003; Klauer et al., 2007; Payne, 2001, 2005; Schlauch et al., 2009; Siegel et al., 2012). Relative to these previous investigations, the approach taken in the current work provided a number of significant methodological advances. In particular, the current study is arguably the most comprehensive assessment of both EF and implicit racial bias yet attempted. Informed by recent advances in understanding the latent structure of EF (e.g., Miyake & Friedman, 2012), the study involved assessment of three distinct yet related facets of EF, each indicated by performance on multiple, well-validated laboratory tasks. This allowed the derivation of latent factors representing the “unity and diversity” of EF abilities (see Miyake et al., 2000; Teuber, 1972). Likewise, participants in the current study completed three different laboratory measures of implicit racial bias, each designed to assess the strength of automatic associations between young Black men and danger but in somewhat different ways. Thus, unlike most previous attempts to link EF and performance on measures of implicit racial bias, in which both EF and implicit racial bias have been represented by performance on only one or a small handful of tasks (Klauer & Mierke, 2005; Mierke & Klauer, 2003; Payne, 2005; Siegel et al., 2012; but see Klauer et al., 2010), the design of the current study allowed for tests of whether individual differences in theoretically distinct facets of EF are associated with expression of racial bias at the level of latent variables. This provides information on the nature of control involved in the performance of implicit racial bias tasks, as well as the degree to which this control is consistent across multiple measures of bias. Furthermore, the relatively large number of participants in the current study, drawn from multiple geographic locations, increases the representativeness of the sample.
The primary finding from this study, pertinent to H1, is that despite a fair degree of overlap in estimates of general controlled processing during the implicit bias tasks (i.e., PDP control; rs ≥ .29; see Table 4), the impact of the three components of EF varied across the tasks. Our results indicate that bias expressed on the WIT and FPST is affected by individual differences in Common EF. Miyake and Friedman (2012) argue that Common EF represents the ability to actively maintain and use task goals to influence lower-level processing, particularly in the face of interference. Notably, this factor involves more than inhibition; the latent variable has significant loadings from all nine of the EF tasks used in the current study. Thus, whereas much past research has focused on the role of inhibition in modulating bias expression (Devine, 1989; Gilbert & Hixon, 1991; Govorun & Payne, 2006; Macrae et al., 1994; Monteith et al., 1998; Payne, 2005; Richeson & Shelton, 2003; von Hippel, 2007), our results point to the possibility that cognitive control of implicit bias may involve more than simply the ability to inhibit prepotent responses by virtue of the contribution of performance on the shifting and updating tasks to the Common EF variable. This more expansive view of the mechanisms involved in control of implicit racial bias converges with that argued by others (e.g., Conrey et al., 2005; Payne, 2001).
In contrast to the findings for WIT and FPST, Common EF played a much less prominent role in the control of racial bias in the IAT. Rather, we observed correlations of IAT D-score and PDP control with Shifting-specific ability. This dissociation in the types of EF related to the different bias tasks speaks to important differences in the cognitive processes involved in task performance for the various measures. To date, this issue has received relatively little consideration (but see Klauer et al., 2010). Although the three bias tasks were designed to measure the same associations (i.e., stereotypes linking young Black men with danger) in roughly the same way (i.e., speeded judgments), they differ in several key ways. For example, the WIT and IAT separate the racial category information (conveyed via faces) from the stereotype-relevant content (conveyed via stereotypic images or words) whereas the two are contained in a single stimulus in the FPST (people of different races holding objects that differ in stereotypicality). The WIT is a sequential priming task, but FPST is not, and the IAT alternates stimuli and tasks on a trial-by-trial (and block-by-block) basis. The WIT and FPST involve tight response deadlines and performance is accuracy-based, whereas the IAT does not use a response deadline and performance is RT-based. Given these structural differences, it should not be surprising that they draw on different aspects of EF, but it is not clear how fully researchers consider the influence of these features when selecting a task to use.
Interestingly, our analyses show that not only do the bias tasks differ in terms of the aspects of EF to which they relate, but they also differ in terms of how those EF facets relate to PDP estimates of control drawn from the tasks. Specifically, Common EF was negatively associated with WIT/FPST bias (see Figure 3) and positively associated with PDP control drawn from those tasks (see Figure 10). In other words, better Common EF ability predicted less WIT/FPST bias and more general control during those tasks. This could suggest that PDP control reflects the influence of cognitive processes represented by the Common EF variable. In contrast, Shifting-specific ability was negatively associated with both IAT bias (see Figure 5) and PDP control in the IAT (see Figure 12). In other words, better Shifting-specific ability predicted both less IAT bias and less general control during the task. At first blush this pattern seems contradictory, but the resolution may lie in the types of control being captured in the Shifting-specific EF and PDP control variables in the IAT. Klauer and colleagues (e.g., Klauer et al., 2010; Mierke & Klauer, 2003) have argued that the link between Shifting-specific ability and IAT performance reflects method variance that is independent of the measure’s content. Specifically, they suggest that the IAT’s relation to Shifting-specific ability reflects the inherent need to switch task sets from trial-to-trial between a concept categorization task (e.g., race) and an attribute categorization task (e.g., word valence). Shifting-specific ability should thus be implicated in the IAT regardless of the type of associations being measured. Consistent with this interpretation, Klauer and colleagues observe relations between Shifting-specific ability and IAT performance across IATs assessing different types of associations (e.g., the relative positivity of flowers and insects, political parties, and racial groups). We similarly show that higher Shifting-specific ability is associated with reduced performance bias in the IAT. By contrast, estimates of PDP control reflect the ability to behave as intended (Payne, 2001), which presumably requires both switching from race classification to valence classification and simultaneously avoiding the influence of racially stereotypic associations. What is interesting in our data is that Shifting-specific ability and IAT PDP control were negatively related. We speculate that this may indicate a trade-off in the type of control being implemented, with those implementing more general task switching ability deploying less racial association-specific PDP control. Given the popularity of the IAT, further exploration of the impact of different types of control on task performance would be informative (see Hilgard, Bartholow, Dickter, & Blanton, in press).
Beyond these simple, direct associations, our results also speak to the issue of EF moderating the influence of automatic associations on bias expression (H2). As illustrated in Figure 4, for individuals relatively low in EF, bias in PDP auto translates more directly into performance bias on the implicit measures; individuals relatively high in EF, however, seem better able to reduce the influence of automatic processes on their behavior. By successfully limiting the biasing impact of these automatic associations, individuals higher in EF are less affected by the incidental racial features of the implicit measures that are objectively irrelevant to task goals (but critical for measuring racial bias). There was also little difference in bias as a function of EF when PDP auto was low, suggesting that level of EF will have less impact on the expression of bias in the absence of a stereotypic impulse. By By contrast, when stereotypic response tendencies are higher (as suggested by higher PDP auto), EF becomes more critical, such that those higher in EF are better able to avoid behaving in line with their automatic tendencies.
Here, too, there was divergence in terms of the roles played by specific EF abilities in determining bias on the WIT/FPST versus the IAT. For the WIT/FPST latent bias variable, Common EF both predicted bias directly and moderated the effect of automatic associations on bias, suggesting that Common EF attenuates the influence of automatic associations on performance (see also Payne, 2005). By contrast, the effect of EF on IAT performance bias was limited to a direct effect of Shifting-specific ability on IAT D-score. Furthermore, in our data, we see no evidence that the impact of Shifting-specific ability on IAT performance interacts with automatic race-based associations (i.e., the PDP auto bias score). As a whole, this pattern suggests that, although Shifting-specific ability affects performance on the IAT, it is not related to participants’ ability to intentionally control the influence of racially-biased associations.
Relations Between Measures of Implicit Racial Bias
The methodological innovations in our design permit a number of additional theoretical advances to be considered. First, although not a major focus of the current study, our analyses revealed that the three measures of racial bias used here showed only weak associations with one another. Although this perhaps could be expected at the level of overall performance bias (see Fazio & Olson, 2003), which arguably is contaminated by differences in structural features and the types of controlled processes invoked across the different tasks, similar patterns emerged for estimates of the extent to which automatic processes contribute to performance (i.e., PDP auto). Even the strongest correlation in PDP auto estimates, between WIT and FPST, indicates that these two measures share only 4% of their variance. Although this overlap was strong enough to allow us to extract a latent variable and relate it to our EF model, more work must be done to clarify the precise mental content assessed by these implicit measures, and to determine the extent to which differences in what the tasks measure contributes to their limited association. Furthermore, this lack of correspondence across measures suggests that researchers must use caution when making decisions concerning which laboratory measure(s) of racial bias to use.
Relations between Implicit and Explicit Racial Bias
In addition to addressing critical theoretical issues about the contribution of control to performance on implicit bias tasks, as well as the nature of that control, our data speak to the issue of how implicit and explicit measures of bias are related. Similar to the findings of Cunningham and colleagues (Cunningham et al., 2001; see also Hofmann, Gawronksi, Geschwender, Le, & Schmitt, 2005), we observed a relationship between the two types of measures that was more plainly evident when implicit bias was estimated using a latent variable rather than measure-specific indices of performance bias. However, we found no support for the prediction that participants with lower EF ability show tighter correspondence between implicit and explicit measures of racial bias due to poorer control over performance on implicit measures (H4). This prediction can be thought of as an individual differences extension of dual process model assumptions that explicit measures are more sensitive to controlled processes. To the degree that the control referred to in dual process models depends on EF, we reasoned that people with greater EF would have more capacity to control explicit responses than those with lower EF, resulting in weaker relations between implicit and explicit measures for those with higher EF. Instead, the relationship between implicit and explicit measures did not depend on EF. Thus, unlike past studies that have changed the implicit-explicit relation through situational manipulations of cognitive control (Payne et al., 2008; Ranganath et al., 2008), individual differences in EF did not show a comparable moderating effect.
Motivation to Control Prejudice
The literature on racial attitudes has emphasized the influence of specific motivations to control prejudice (Amodio et al., 2008; Dunton & Fazio, 1997; Glaser & Knowles, 2008; Park, Glaser, & Knowles, 2008; Plant & Devine, 1998; Maddux et al., 2005). To date, however, there has been little consideration of how general cognitive ability and domain-specific motivations operate together (but see Amodio et al., 2008; Payne, 2005). Our design and large sample permitted us to assess their simultaneous effects to determine whether they independently influence implicit and explicit expression of bias (H5). Our results showed that high Internal Motivation predicts less bias in WIT/FPST, IAT, and Personal Attitudes, as well as greater control on implicit bias tasks (as assessed with PDP control). This beneficial effect of Internal Motivation does not depend on EF (i.e., Internal Motivation does not interact with Common EF). By contrast, high External Motivation is associated with greater bias in the IAT and more negative Personal Attitudes, a pattern that weakens (for the implicit measures) with increases in Common EF.
There are several theoretical implications of these results. They first suggest that cognitive ability (i.e., EF) and motivation are distinct, independent predictors of bias expression, at least when motivation arises from internal factors. People who are internally motivated to avoid prejudiced responding are theorized to have internalized egalitarian standards and apply them consistently across situations (e.g., Devine et al., 2002, Monteith et al., 2009; Moskowitz, Gollwitzer, Wasel, & Schaal, 1999). Our results suggest the application of this motivational drive is relatively unaffected by variation in EF. By contrast, the impact of External Motivation appears to be more resource dependent. It has been suggested that, whereas internal motivation produces negative self-directed affect if behavior falls short of internalized egalitarian standards, feeling externally pressured to inhibit bias can produce resentment and frustration. In our data, it appears that participants high in External Motivation show evidence of this negative bias on both implicit and explicit measures. Those individuals high in EF, however, are able to reduce the expression of bias when completing the implicit tasks, presumably due to their increased ability to adhere to overarching task goals (e.g., to correctly identify guns and tools, regardless of the preceding racial prime).
In many ways this pattern makes intuitive sense. External Motivation reflects a concern with appearing prejudiced (perhaps even awareness of one’s own socially inappropriate attitudes), whereas Internal Motivation reflects differences in the desire to be—not simply to appear—egalitarian. The differences in these constructs may account for the divergence in relations between EF and the two forms of motivation: whereas belief in the value of egalitarianism might in itself be enough to reduce bias expression, a desire to appear nonprejudiced for external reasons arguably requires more effort when the situation calls for bias control—the very kind of situation in which EF should be important for modifying behavior. As noted by previous scholars, sources of internal motivation are arguably more well-practiced and thus may require fewer cognitive resources to implement (Monteith et al., 2009; Moskowitz, et al., 1999), potentially uncoupling their effects from EF abilities per se and permitting better implementation of task-specific control. This pattern was evident here by the fact that Internal Motivation was directly related to PDP control (see also Amodio et al., 2008) but External Motivation was not.
Motivation and EF were unrelated to PDP auto estimates, in line with the assumption that PDP auto reflects processes immune from the influence of intentions (Payne, 2001). Others, however, have shown that Internal Motivation is associated with less activation of automatic associations (Gonsalkorale et al., 2011), a finding suggesting that those high in Internal Motivation either lack biased automatic associations or possess the ability to automatically inhibit them (see Amodio et al., 2003; Devine et al., 2002). Intuitively, the findings and interpretation in these studies seem to fit with our results (discussed above) showing that the influence of Internal Motivation are not moderated by EF (suggesting that they are not resource dependent). It is therefore not clear to us why the results from that study differ from those observed here with respect to the relationship between motivation and PDP auto. One possibility is the use of different measures of automatic processes in the two studies (PDP versus Quad Model). Given the theoretical and practical implications of knowing whether variability in racially-biased behavior is primarily affected by differences in control, or whether differences in automatic processes also contribute, this issue merits further investigation.
The Meaning of PDP Auto and Control Estimates
As highlighted in the discussion thus far, one remarkable aspect of our findings is the relative lack of correspondence between the PDP estimates derived from our three implicit tasks. Despite our efforts to equate the stereotype content assessed by the measures, there was relatively little overlap in estimates of PDP auto, and while there were significant correlations in PDP control, these estimates actually related to very different forms of EF when examined in the context of our latent factor models. Together, these findings reinforce many of the basic lessons gleaned from past research using the PDP approach. That is, although the PDP formulas offer a powerful technique for examining the relative contribution of controlled and automatic processes within a given task, those estimates are constrained by the particular content and structure of the task. The only way to obtain domain general estimates of control is to use completely separate tasks that are known to measure these targeted processes (as was done here). One cannot simply assume that the PDP estimates observed in different tasks reflect similar underlying processes.
This conclusion also highlights a striking limitation in the field. There are currently no agreed upon process-pure measures of automatic racial associations, so while it was possible for us to measure control abilities independent from the bias tasks, we could not do the same for automatic processes. Because of this limitation, it is hard to interpret the meaning of the stronger relationship we observed between PDP auto and performance bias in the WIT/FPST vs the IAT. These differences could reflect a differential contribution of automatic processes to responding in the different tasks, or simply greater measurement overlap for WIT and FPST. Both PDP auto and performance bias are computed using error rates for the WIT/FPST, but only the PDP estimate is based on this accuracy data for the IAT (for which performance bias is scored primarily with reaction times). Future research should examine whether the tasks we used differ in the degree to which they are influenced by automatic processes. Given the central importance of this issue to the field, identifying ways to quantify these automatic processes in a purer manner (as has been accomplished in the realm of EF) seems critical.
Another important implication of our work concerns the sufficiency of PDP control estimates to capture the control being implemented in frequently-used implicit bias tasks. Our results indicate that the answer to this question depends on the type of implicit bias task in which control is measured. For WIT and FPST, Common EF and PDP control were each associated with less bias, and Common EF and PDP control were themselves strongly related, suggesting that PDP control is tapping the influence of Common EF in these tasks.
To more explicitly evaluate this conclusion, we conducted an ancillary analysis in which both Common EF, PDP control, and the interactions of each with PDP auto simultaneously predicted the latent WIT/FPST performance bias measure. This was, in essence, the same model depicted in Figure 3, but with PDP control and the PDP control x PDP auto interaction added as predictors and allowed to correlate with the EF variables. Note that the estimates of PDP control and performance bias have a much higher degree of temporal and task specificity than do the EF measures and performance bias. Even if Common EF and PDP control reflect similar constructs, we therefore expected PDP control to emerge as the primary predictor of performance bias. Indeed this was the case; PDP control and the PDP control x PDP auto interaction predicted implicit bias, but Common EF—neither directly nor via an interaction with PDP auto—did not. This suggests that Common EF does indeed play a vital role in the type of control enacted during the WIT and FPST. In essence, the PDP control estimate derived from these tasks is a direct proxy for Common EF.
The relation of EF to PDP control is different for the IAT. As noted previously, in the IAT, Shifting-specific ability and PDP control were negatively correlated, but each was associated with less IAT bias, a pattern suggesting that EF and PDP control make independent contributions to IAT performance. As with WIT/FPST, we conducted an ancillary analysis including both EF and PDP control as predictors of IAT bias (i.e., a model similar to that in Figure 5 but adding the PDP control and PDP control x PDP auto interaction). Shifting-specific ability remained an independent predictor of IAT bias, but with Shifting-specific ability (as well as all other facets of EF) in the model, PDP control did not predict IAT bias. Consistent with earlier conclusions, there appears to be unique, non-overlapping aspects of control contributing to IAT performance and fully capturing both the type and amount of control in the IAT might require independent measures of EF. To the question of whether PDP control is sufficient to represent the influence of Common EF in these tasks, if the goal is to determine the type of control recruited in these tasks, independent quantification of different aspects of EF is needed, but if the goal is to quantify the amount of control recruited, relying on PDP control may be sufficient.
Limitations and Suggestions for Future Research
Although the current study represents perhaps the most comprehensive examination to date of the relationship between EF and implicit racial bias, it was not without limitations. First, despite its relatively large size, the sample used in the current study likely represented a restricted range of responses in terms of both EF and racial bias. All participants were drawn from undergraduate populations at three relatively large universities, who arguably have both better cognitive abilities and less biased racial attitudes than the general population. This issue could help account for the fact that although our analyses revealed predicted patterns of association between EF and implicit bias, the magnitude of those associations generally was modest. Replication of the current findings in a sample drawn from a broader population would be extremely valuable.
A second limitation concerns differences in the structural features of the bias tasks used here, which likely contributed to the very modest associations among their bias estimates. While our use of tasks with different structural properties had the benefit of minimizing the influence of particular measurement characteristics, it is not surprising that tasks measuring bias in different ways produce estimates of bias that are not highly correlated with each other. However, to the extent that these tasks truly measure the same implicit biases, they ought to correlate for more than just methodological reasons. Though a useful approach for future research might be to choose or design bias tasks whose structural features are as similar as possible in order to permit more robust latent variables to be extracted, such design decisions might also allow method variance to contaminate the latent variables. It is also worth noting that the variability among our tasks is representative of the variability seen across studies purporting to measure implicit racial bias. If such variability affected the relations among our tasks, they also raise concerns about generalizing across studies using different tasks.
While the large number of tasks employed and the latent variable approach they permitted is a strength of the research, we must also consider the impact of fatigue associated with the completion of so many tasks. We tried to minimize this through frequent breaks, close monitoring for fatigue, and screening for below chance levels of responding, which was detected at a low rate. Nevertheless, we acknowledge that fatigue could have contributed noise to the data. Despite the large number of tasks employed, inferences concerning the role of EFs in the expression of bias based on the current results are limited by the specific facets of EF we chose to measure. With perhaps one exception (Common EF and PDP automatic predicting WIT/FPST bias; see Figure 3) our models failed to account for the total variance in both bias expression and control during the tasks, suggesting that the bias tasks used here tap some other forms of control not represented in the Unity and Diversity model (see Sherman et al., 2008). Moreover, although latent variable models clearly permit better estimates of EF facets than do any single tasks (see Miyake et al., 2000) it is also clear that performance on some tasks relates more strongly to individual differences in underlying EF abilities than does performance on others. For example, despite its status as a prototypical inhibition measure (see Verbruggen & Logan, 2008), the stop-signal task was only modestly associated with the Common EF factor; likewise, the color-shape task was robustly associated with Shifting-specific ability but demonstrated a much smaller association with Common EF than did the other shifting tasks. Future research would benefit from both a broader conceptualization of EF abilities and better specificity in EF measurement.
Finally, we note that the goal of this research was to identify the qualitative nature of control implemented during implicit bias tasks rather than to document the conditions under which control operates (c.f., Fujita, Trope, Cunningham, & Liberman, in press; Gawronski & Bodenhausen, 2009; Sherman, 2006). Some definitions of control assume it requires intention and effort (Bargh, 1994), but researchers are increasingly recognizing that aligning behavior with goals can operate with little intention and/or effort (e.g., Fujita et al., in press; Moskowitz, et al., 1999). Our own data are broadly in line with this conclusion by showing that EF influences responses on implicit bias tasks when tight response deadlines limit the opportunity for reflective thought, but this issue requires greater research.
Conclusions
The current work represents a multidisciplinary union of theory and methods from contemporary cognitive science and social cognition brought to bear on a question that has intrigued scientists in both disciplines and that has considerable implications for our understanding of the meaning of implicit racial bias. Significant methodological advances include the relatively large number of participants recruited, the measurement of relevant constructs (EF and racial bias) with multiple representative tasks, the rigorous multi-session procedure, the use of advanced quantitative modeling techniques, and the collection of data in three distinct geographic locations. In designing this project, our goal was to create a definitive dataset that could be used as a reference for the many scientists who are interested in core issues underlying racial bias and the impact of EF on implicit measures. Because these issues cross many disciplinary boundaries, our findings are of value not only to those directly interested in the role of EF on implicit bias, but also methodologists who seek to understand how implicit measures work, cognitive scientists who investigate the structure and functions of cognitive control, and social scientists of many orientations interested in race relations and the operation of implicit and explicit racial bias.
The current results make clear that various EFs do indeed relate to the racial bias expressed on implicit and explicit measures. Critically, these relationships depend greatly on the type of implicit measure used. In this way, our findings highlight not only the commonalities between various measures of racial bias, but also a number of intriguing differences among them. Although past research has documented some of the relationships shown here, past studies suffered from limited sample sizes, leaving open the possibility that their results were contaminated by both Type I and Type II errors. Our sample size offers some protection from these issues, and in this way serves as a roadmap for future research, highlighting areas where suggestive relationships need to be further examined, and where mysteries remain. Because of this, the current results stand as a statement on the field’s current understanding of EF and implicit bias, highlighting both what we know about the implicit measurement of racial bias, and what requires further investigation.
Supplementary Material
Acknowledgments
This work was supported by National Science Foundation grant BCS 0847872 and NIH grant MH063207. We are grateful to Geoff Kerr, Lindsey Newnes, and Christopher R. Engelhardt for assistance with data collection.
APPENDIX
Table A1.
Factor Scores and Loadings from Explicit Measures
| Factor 1: Personal Attitude | Factor 2: Internal Motivation | Factor 3: External Motivation | Factor 4: Cultural Stereotypes | |
|---|---|---|---|---|
| Attitudes Toward Blacks (ATB) | ||||
| I would rather not have Black people live in the same apartment building I live in. | .67 | .09 | .13 | −.01 |
| I get very upset when I hear a White person make a prejudicial remark about Black people (R). | .34 | −.41 | .04 | .02 |
| Black and White people are inherently equal (R). | .32 | −.10 | −.04 | .00 |
| I would not mind at all if a Black family with about the same income and education as me moved in next door (R). | .54 | .17 | −.06 | −.10 |
| It would not bother me if my new roommate were Black (R). | .63 | .17 | .02 | −.07 |
| Whites should support Blacks in their struggle against discrimination and segregation (R). | .57 | −.08 | −.09 | −.05 |
| If a Black person were put in charge of me, I would not mind taking advice and direction from him or her (R). | .62 | .08 | −.03 | −.04 |
| I think that Black people look more similar to each other than White people do. | .44 | −.02 | .29 | .06 |
| The federal government should take decisive steps to override the injustices Black people suffer at the hands of local authorities (R). | .37 | −.20 | −.02 | .01 |
| I would probably feel somewhat self-conscious dancing with a Black person in a public place. | .55 | .15 | .12 | .01 |
| Interracial marriage should be discouraged to avoid the “who-am-I?” confusion which the children feel. | .53 | .08 | .00 | −.06 |
| Black people are demanding too much too fast in their push for equal rights. | .48 | −.07 | −.04 | .00 |
| I enjoy a funny racial joke, even if some people may find it offensive. | .01 | −.71 | .17 | .10 |
| If I had a chance to introduce Black visitors to my friends and neighbors, I would be pleased to do so (R). | .67 | .16 | −.04 | −.08 |
| I favor open housing laws that allow more racial integration of neighborhoods (R). | .62 | .03 | .01 | −.08 |
| Generally, Black people are not as smart as White people. | .59 | .02 | −.10 | .02 |
| Some Black people are so touchy about race that it is difficult to get along with them. | .34 | −.28 | .20 | .14 |
| It is likely that Black people will bring violence to neighborhoods when they move in. | .66 | .09 | −.02 | .02 |
| Racial integration (of schools, businesses, residences, etc.) has benefited both Whites and Black people (R). | .33 | −.01 | −.09 | −.01 |
| I worry that in the next few years I may be denied my application for a job or a promotion because of preferential treatment given to minority group members. | .32 | −.19 | .17 | .01 |
| Internal and External Motivation to Respond without Prejudice | ||||
| Because of today’s PC (politically correct) standards, I try to appear nonprejudiced toward Black people. | .04 | −.09 | .74 | .01 |
| I try to hide any negative thought about Black people in order to avoid negative reactions from others. | .13 | .07 | .68 | −.01 |
| I attempt to act in nonprejudiced ways toward Black people because it is personally important to me. | −.18 | .32 | .37 | .03 |
| I try to act nonprejudiced toward Black people because of pressure from others. | .18 | −.23 | .74 | −.06 |
| According to my personal values, using stereotypes about Black people is ok (R). | −.30 | .40 | −.09 | .01 |
| If I acted prejudiced toward Black people, I would be concerned that others would be angry with me. | −.05 | .02 | .67 | −.01 |
| Being nonprejudiced toward Black people is important to my self-concept. | −.32 | .20 | .34 | .00 |
| I attempt to appear nonprejudiced toward Black people in order to avoid disapproval from others. | .16 | −.22 | .82 | −.03 |
| Because of my personal values, I believe that using stereotypes about Black people is wrong. | −.32 | .40 | .13 | .03 |
| I am personally motivated by my beliefs to be nonprejudiced toward Black people. | −.37 | .27 | .28 | .02 |
| Non-Scale Measures | ||||
| Feeling Thermometer Bias | .57 | .02 | .21 | .00 |
| Personal Stereotype Bias - Aggressive | .51 | .10 | −.08 | .22 |
| Personal Stereotype Bias - Violent | .59 | .12 | .03 | .15 |
| Personal Stereotype Bias - Dangerous | .52 | .19 | .09 | .09 |
| Perceived Cultural Stereotype Bias - Aggressive | −.06 | −.03 | −.04 | .83 |
| Perceived Cultural Stereotype Bias - Violent | .00 | .00 | −.01 | .93 |
| Perceived Cultural Stereotype Bias - Dangerous | .02 | .07 | −.02 | .85 |
| Funding Allocation Bias | .39 | −.05 | .07 | −.04 |
| Motivation to Control Prejudiced Reactions (MCPR) | ||||
| In today’s society it is important that one not be perceived as prejudiced in any manner. | −.17 | .07 | .28 | .02 |
| I always express my thoughts and feelings, regardless of how controversial they might be (R). | .20 | .41 | .08 | .04 |
| I get angry with myself when I have a thought or feeling that might be considered prejudiced. | −.10 | .45 | .20 | −.04 |
| If I were participating in a class discussion and a Black student expressed an opinion with which I disagreed, I would be hesitant to express my own viewpoint. | .27 | .27 | .07 | −.10 |
| Going through life worrying about whether you might offend someone is just more trouble than it’s worth (R). | .05 | .48 | −.01 | .00 |
| It’s important to me that other people not think I’m prejudiced. | −.11 | .26 | .40 | −.04 |
| I feel it’s important to behave according to society’s standards. | .18 | .21 | .29 | .07 |
| I’m careful not to offend my friends, but I don’t worry about offending people I don’t know or don’t like (R). | −.16 | .31 | −.16 | .06 |
| I think that it is important to speak one’s mind rather than to worry about offending someone (R). | .26 | .66 | −.11 | .05 |
| It’s never acceptable to express one’s prejudices. | −.08 | .36 | .00 | .00 |
| I feel guilty when I have a negative thought or feeling about a Black person. | −.06 | .36 | .34 | −.06 |
| When speaking to a Black person, it’s important to me that he/she not think I’m prejudiced. | .00 | .18 | .51 | −.01 |
| It bothers me a great deal when I think I’ve offended someone, so I’m always careful to consider other people’s feelings. | .05 | .61 | .09 | .08 |
| If I have a prejudiced thought or feeling, I keep it to myself. | −.08 | .53 | .12 | .07 |
| I would never tell jokes that might offend others. | .16 | .81 | −.12 | −.03 |
| I’m not afraid to tell others what I think, even when I know they disagree with me (R). | .32 | .46 | −.07 | .00 |
| If someone who made me uncomfortable sat next to me on a bus, I would not hesitate to move to another seat (R). | .04 | .12 | .04 | .06 |
Note. Item loadings .40 and greater are bolded, loadings less than .20 are greyed out. R indicates a reserve scored item.
Table A2.
Intercorrelations among Factor Scores and Individual Explicit Measures
| Measure | Extracted Factor | |||
|---|---|---|---|---|
| Personal Attitude | Internal Motivation | External Motivation | Cultural Stereotype | |
| Personal Attitude (factor 1) | -- | |||
| Internal Motivation (factor 2) | −.58* | -- | ||
| External Motivation (factor 3) | −.22* | .61* | -- | |
| Cultural Stereotypes (factor 4) | .03 | −.05 | .01 | -- |
| Attitudes Toward Blacks | .94* | −.58* | −.20* | .03 |
| Internal Motivation to Control Prejudice | −.66* | .79* | .61* | .00 |
| External Motivation to Control Prejudice | −.01 | .37* | .91* | .00 |
| Motivation to Control Prejudiced Reactions | −.38* | .91* | .68* | −.02 |
| Feeling Thermometer Bias | .51* | −.17* | .10* | .01 |
| Personal Stereotype Bias | .59* | −.18* | −.03 | .20* |
| Perceived Cultural Stereotype Bias | .00 | −.04 | .00 | .98* |
| Funding Allocation Bias | .41* | −.22* | −.04 | −.03 |
Note. Higher values indicate more negative personal attitudes, higher internal and external motivation to control prejudice, and greater stereotyping of Blacks. Correlations are maximum likelihood estimates (from Mplus) based on all data, adjusted for missing observations. Total N = 481.
p ≤ .05.
Table A3.
Mean Accuracy Rates and Reaction Times for Implicit Tasks as a Function of Trial/Block Type
| Trial/Block Type | Accuracy | RT |
|---|---|---|
| Weapons Identification Task | ||
| Black - Gun | .80 (.10) | 389 (29) |
| Black - Tool | .68 (.14) | 405 (32) |
| White - Gun | .72 (.12) | 394 (30) |
| White - Tool | .77 (.12) | 397 (30) |
| First Person Shooter Task | ||
| Black - Armed | .78 (.11) | 463 (24) |
| Black - Unarmed | .72 (.13) | 494 (23) |
| White - Armed | .74 (.09) | 460 (25) |
| White - Unarmed | .70 (.12) | 492 (23) |
| Implicit Association Test | ||
| Stereotype Congruent | .94 (.04) | 645 (102) |
| Stereotype Incongruent | .91 (.07) | 805 (174) |
Note. RT = reaction time. Standard deviations in parentheses.
Footnotes
The term “automatic” is used widely, but is often poorly defined (cf. Bargh, 1994). Automatic processes typically incorporate one or more of the following components: speed, lack of intention, lack of awareness, minimal demand on cognitive resources, parallel processing, unavoidability (i.e., difficulty overriding the process once it is initiated), and consolidation of subordinate elements. In this paper we use the term chiefly to refer to processes that are unintentional and difficult to avoid. We suggest, however, that much as this paper draws meaningful distinctions regarding different forms of “control,” the field would benefit from a more nuanced treatment of “automaticity.” Neither construct is monolithic.
Results do not change when Black participants are omitted from analyses.
Sixty-four participants at CU and 116 at MU completed the bias tasks in the second session while event-related brain potentials (ERPs) were recorded. Those data are not of interest here and will not be reported. We tested whether inclusion of data from individuals who had ERP recorded in session 2 affected the results. Across the 12 racial bias constructs assessed (reaction time bias, accuracy bias, PDP auto, and PDP control for all three tasks), there was only one marginally significant effect (p = .084) (M p-level = .64, Median p-level = .71). ERP participants had marginally less reaction time bias on the FPST (M = −2.45ms) than non-ERP participants (M = 0.48ms). We also examined whether ERP participants differed on any construct assessed in the first session (i.e., EF scores and questionnaire factor means). Across the 13 measures there was one significant difference (p = .015) and two marginal differences (ps = .063 and .074) (M p-level = .428, Median p-level = .310). ERP participants had significantly higher antisaccade scores (M = 64.06) than non-ERP participants (M = 60.76), marginally higher stop-signal scores (M = 250.57) than non-ERP participants (M = 244.94), and marginally lower Internal Motivation factor scores (M = −0.11) than non-ERP participants (M = 0.59). ERP and non-ERP participants also showed measurement invariance in their EF models (non-significant difference when intercepts and factor loadings were constrained to be equal; Δχ2(24) = 35.83, p = .057), which was not surprising given that EF testing in Session 1 was the same for both ERP and non-ERP participants. Most importantly, none of the conclusions about relations between EFs and bias are affected by the inclusion of the ERP subjects as significance levels and directions of effects did not change when the bias task data were removed for the ERP participants.
There were an additional 32 trials each in which a Black or White prime was shown but no target gun/tool stimulus followed. These trials were inserted for the purpose of ERP analyses (to allow quantification of ERP responses to primes into the period where the target stimulus would normally appear). These prime-only trials were randomly intermixed among the prime-target trials. Participants were instructed to omit responses on any trial lacking a gun or tool. Since there are no behavioral responses on these trials, they are not considered in the present analyses.
Participants also performed De Houwer’s (2003) Extrinsic Affective Simon Task. However, in line with a recent critique offered by De Houwer himself (De Houwer & De Bruycker, 2007), this task showed poor split-half reliability and did not correlate meaningfully with the other measures of bias in this study. Because of its problematic status in the literature, poor psychometric performance, and the impossibility (based on low intercorrelations) of employing it in latent variables analyses, we excluded it from the final analysis. It is crucial to note that this task was always administered at the end of the second session (after all of the other tasks) and therefore could not influence performance on them.
There was a significant negative correlation between the residuals for antisaccade and Stroop, r = −.68, χ2(1) = 16.27, p < .001. Because the correlation was negative and was also inconsistent with our findings in another sample, in which the only significant residual correlation among the response inhibition tasks was a negative correlation between stop-signal and Stroop (Friedman et al., 2011), we did not consider it as evidence for an Inhibition-Specific factor and did not include it in the final models.
The magnitude of behavioral bias in the FPST was somewhat smaller than we typically see (eta-squared = .06). This may be due to the extremely short response window (590 ms versus 630 ms, which is typically used) or, more likely, to the fact that participants performed 300 trials, rather than the standard 100 trials. Indeed, previous work has shown that practice with this task can reduce the magnitude of bias (Correll et al., 2007).
Though we report results using factor scores extracted from the exploratory factor analysis presented in Table A1, we obtained similar results when using scale scores for the measures with items included in the factor analysis. For example, when we ran the models shown in Figures 6, 7, 8 and 11 with the Attitudes Toward Blacks scale (ATB; Brigham, 1993) instead of the Personal Attitudes factor score, conclusions were the same (implicit bias significantly predicted explicit attitudes, but there was no indication that this relation depended on EF). The pattern in these models was also the same when using the funding allocation bias score on its own instead of as part of the Personal Attitudes factor score. Finally, the models pictured in Figures 8, 10, 11, and 12 with Internal and External motivation to control prejudice scale scores (Plant & Devine, 1998) used in place of the factor scores for those constructs also resulted in similar patterns, though some paths dropped from significant to marginally significant. The overall similarity of results with the factor scores and scale scores suggests that the factor scores appear to be suitable composites of the constructs tapped by the individual explicit measures.
Past research suggests that Internal and External Motivation interact to affect the expression of prejudice (i.e., evaluative associations), with the lowest level of bias among those high in Internal Motivation but low in External Motivation (Amodio et al., 2006, 2008; Devine et al., 2002; Gonsalkoral et al., 2011; Plant & Devine, 1998). We might not expect such an interaction in the current data, given that the implicit measures we used were structured to reflect stereotyping, and as argued by Amodio et al. (2008), the interaction of these two facets of motivation should predict implicitly measured evaluations rather than stereotypes. Indeed, when models were modified to include the interaction between Internal and External Motivation, this interaction failed to predict WIT/FPST or IAT bias.
References
- Amodio DM, Devine PG. Stereotyping and evaluation in implicit race bias: Evidence for independent constructs and unique effects on behavior. Journal of Personality and Social Psychology. 2006;91:652–661. doi: 10.1037/0022-3514.91.4.652. [DOI] [PubMed] [Google Scholar]
- Amodio DM, Devine PG, Harmon-Jones E. Individual differences in the regulation of intergroup bias: The role of conflict monitoring and neural signals for control. Journal of Personality and Social Psychology. 2008;94:60–74. doi: 10.1037/0022-3514.94.1.60. [DOI] [PubMed] [Google Scholar]
- Amodio DM, Harmon-Jones E, Devine PG. Individual differences in the activation and control of affective race bias as assessed by startle eyeblink responses and self-report. Journal of Personality and Social Psychology. 2003;84:738–753. doi: 10.1037/0022-3514.84.4.738. [DOI] [PubMed] [Google Scholar]
- Amodio DM, Harmon-Jones E, Devine PG, Curtin JJ, Hartley SL, Covert AE. Neural signals for the detection of unintentional race bias. Psychological Science. 2004;15:225–232. doi: 10.1111/j.0963-7214.2004.01502003.x. [DOI] [PubMed] [Google Scholar]
- Amodio DM, Mendoza SA. Implicit intergroup bias: Cognitive, affective, and motivational underpinnings. In: Gawronski B, Payne BK, editors. Handbook of Implicit Social Cognition. New York: Guilford; 2010. pp. 353–374. [Google Scholar]
- Bargh JA. The four horsemen of automaticity: Awareness, intention, efficiency, and control in social cognition. In: Wyer RS Jr, Srull TK, editors. Handbook of social cognition. 2. Hillsdale, NJ: Lawrence Erlbaum Associates, Inc; 1994. pp. 1–40. [Google Scholar]
- Bargh JA. The cognitive monster: The case against controllability of automatic stereotype effects. In: Chaiken S, Trope Y, editors. Dual process theories in social psychology. New York: Guilford; 1999. [Google Scholar]
- Bartholow BD, Dickter CL, Sestir MA. Stereotype activation and control of race bias: Cognitive control of inhibition and its impairment by alcohol. Journal of Personality and Social Psychology. 2006;90:272–287. doi: 10.1037/0022-3514.90.2.272. [DOI] [PubMed] [Google Scholar]
- Bartholow BD, Henry EA, Lust SA, Saults JS, Wood PK. Alcohol effects on performance monitoring and adjustment: Affect modulation and impairment of evaluative cognitive control. Journal of Abnormal Psychology. 2012;121:173–186. doi: 10.1037/a0023664. [DOI] [PMC free article] [PubMed] [Google Scholar]
- Baumeister RF, Vohs KD, Tice DM. The strength model of self-control. Current Directions in Psychological Science. 2007;16:396–403. http://dx.doi.org//doi:10.1111/j.1467-8721.2007.00534.x. [Google Scholar]
- Beer JS, Stallen M, Lombardo MV, Gonsalkorale K, Cunningham W, Sherman JW. The Quadruple Process Model Approach to Examining the Neural Underpinnings of Prejudice. NeuroImage. 2008;43:775–783. doi: 10.1016/j.neuroimage.2008.08.033. [DOI] [PubMed] [Google Scholar]
- Blair I. Implicit stereotypes and prejudice. In: Moskowitz GB, editor. Cognitive social psychology: The Princeton symposium on the legacy and future of social cognition. Mahwah, NJ: Erlbaum; 2001. pp. 359–374. [Google Scholar]
- Blanton H, Jaccard J, Gonzales PM, Christie C. Decoding the Implicit Association Test: Implications for criterion prediction. Journal of Experimental Social Psychology. 2006;42:192–212. [Google Scholar]
- Brauer M, Wasel W, Niedenthal P. Implicit and explicit components of prejudice. Review of General Psychology. 2000;4:79–101. [Google Scholar]
- Brigham JC. College students’ racial attitudes. Journal of Applied Social Psychology. 1993;23:1933–1967. [Google Scholar]
- Burgess PW. Theory and methodology in executive function research. In: Rabbitt P, editor. Methodology of frontal and executive function. Hove, UK: Psychology Press; 1997. pp. 81–116. [Google Scholar]
- Chen M, Bargh JA. Nonconscious behavioral confirmation processes: The self-fulfilling consequences of automatic stereotype activation. Journal of Experimental Social Psychology. 1997;33(5):541–560. doi: 10.1006/jesp.1997.1329. [DOI] [Google Scholar]
- Cohen J, Cohen P. Applied Multiple Regression/Correlation Analysis for the Behavioral Sciences. 2. Psychology Press; 1984. [Google Scholar]
- Collins AM, Loftus EF. A spreading activation theory of semantic processing. Psychological Review. 1975;82:407–428. [Google Scholar]
- Conrey FR, Sherman JW, Gawronski B, Hugenberg K, Groom C. Separating multiple processes in implicit social cognition: The Quad model of implicit task performance. Journal of Personality and Social Psychology. 2005;89:469–487. doi: 10.1037/0022-3514.89.4.469. [DOI] [PubMed] [Google Scholar]
- Correll J, Park B, Judd CM, Wittenbrink B. The police officer’s dilemma: Using ethnicity to disambiguate potentially threatening individuals. Journal of Personality and Social Psychology. 2002;83:1314–1329. [PubMed] [Google Scholar]
- Correll J, Park B, Smith JA. Colorblind and multicultural prejudice reduction strategies in high-conflict situations. Group Process and Intergroup Relations. 2008;11:471–491. [Google Scholar]
- Correll J, Urland GR, Ito TA. Event-related potentials and the decision to shoot: The role of threat perception and cognitive control. Journal of Experimental Social Psychology. 2006;42:120–128. [Google Scholar]
- Crosby F, Bromley S, Saxe L. Recent unobtrusive studies of Black and White discrimination and prejudice: A literature review. Psychological Bulletin. 1980;87:546–563. [Google Scholar]
- Cunningham WA, Johnson MK, Raye CL, Gatenby JC, Gore JC, Banaji MR. Separable neural components in the processing of Black and White Faces. Psychological Science. 2004;15:806–813. doi: 10.1111/j.0956-7976.2004.00760.x. [DOI] [PubMed] [Google Scholar]
- Cunningham WA, Preacher KJ, Banaji MR. Implicit attitude measures: Consistency, stability, and convergent validity. Psychological Science. 2001;12:163–170. doi: 10.1111/1467-9280.00328. [DOI] [PubMed] [Google Scholar]
- De Houwer J. The extrinsic affective Simon task. Experimental Psychology. 2003;50:77–85. doi: 10.1026//1618-3169.50.2.77. [DOI] [PubMed] [Google Scholar]
- De Houwer J, De Bruycker E. The Implicit Association Test outperforms the Extrinsic Affective Simon Task as a measure of interindividual differences in attitudes. British Journal of Social Psychology. 2007;46:401–421. doi: 10.1348/014466606X130346. [DOI] [PubMed] [Google Scholar]
- De Houwer J, Teige-Mocigemba S, Spruyt A, Moors A. Implicit measures: A normative analysis and review. Psychological Bulletin. 2009;135:347–368. doi: 10.1037/a0014211. [DOI] [PubMed] [Google Scholar]
- Denckla MB. A theory and model of executive function: A neuropsychological perspective. In: Lyon GR, Krasnegor NA, editors. Attention, memory, and executive function. Baltimore, MA: Brookes; 1996. pp. 263–278. [Google Scholar]
- Devine PG. Stereotypes and prejudice: Their automatic and controlled components. Journal of Personality & Social Psychology. 1989;56:5–18. [Google Scholar]
- Devine PG, Elliot AJ. Are racial stereotypes really fading? The Princeton Trilogy revisited. Personality and Social Psychology Bulletin. 1995;21:1139–1150. [Google Scholar]
- Devine PG, Plant EA, Amodio DM, Harmon-Jones E, Vance SL. The regulation of explicit and implicit race bias: The role of motivations to respond without prejudice. Journal of Personality and Social Psychology. 2002;82:835–84. [PubMed] [Google Scholar]
- Dovidio JF, Evans N, Tyler RB. Racial stereotypes: The contents of their cognitive representations. Journal of Experimental Social Psychology. 1986;22:22–37. [Google Scholar]
- Dunton BC, Fazio RH. An individual difference measure of motivation to control prejudiced reactions. Personality and Social Psychology Bulletin. 1997;23:316–326. [Google Scholar]
- Fazio RH. Multiple processes by which attitudes guide behavior: The MODE model as an integrative framework. Advances in Experimental Social Psychology. 1990;23:75–109. [Google Scholar]
- Fazio RH, Jackson JR, Dunton BC, Williams CJ. Variability in automatic activation as an unobstrusive measure of racial attitudes: A bona fide pipeline? Journal of Personality and Social Psychology. 1995;69(6):1013–1027. doi: 10.1037//0022-3514.69.6.1013. [DOI] [PubMed] [Google Scholar]
- Fazio RH, Olson MA. Implicit measures in social cognition research: Their meaning and use. Annual Review of Psychology. 2003;54:297–327. doi: 10.1146/annurev.psych.54.101601.145225. [DOI] [PubMed] [Google Scholar]
- Fisk JE, Sharp CA. Age-related impairment in executive functioning: updating, inhibition, shifting, and access. Journal of Clinical Experimental Neuropsychology. 2004;26:874–890. doi: 10.1080/13803390490510680. [DOI] [PubMed] [Google Scholar]
- Friedman NP, Haberstick BC, Willcutt EG, Miyake A, Young SE, Corley RP, Hewitt JK. Greater attention problems during childhood predict poorer executive functioning in late adolescence. Psychological Science. 2007;18:893–900. doi: 10.1111/j.1467-9280.2007.01997.x. [DOI] [PubMed] [Google Scholar]
- Friedman NP, Miyake A, Altamirano LJ, Corley RP, Young SE, Rhea SA, Hewitt JK. Stability and Change in Executive Function Abilities From Late Adolescence to Early Adulthood: A Longitudinal Twin Study. 2014. Manuscript submitted for publication. [DOI] [PMC free article] [PubMed] [Google Scholar]
- Friedman NP, Miyake A, Corley RP, Young SE, DeFries JC, Hewitt JK. Not all executive functions are related to intelligence. Psychological Science. 2006;17:172–179. doi: 10.1111/j.1467-9280.2006.01681.x. [DOI] [PubMed] [Google Scholar]
- Friedman NP, Miyake A, Robinson JL, Hewitt JK. Developmental trajectories in toddlers’ self-restraint predict individual differences in executive functions 14 years later: A behavioral genetic analysis. Developmental Psychology. 2011;47:1410–1430. doi: 10.1037/a0023750. [DOI] [PMC free article] [PubMed] [Google Scholar]
- Friedman NP, Miyake A, Young SE, DeFries JC, Corley RP, Hewitt JK. Individual differences in executive functions are almost entirely genetic in origin. Journal of Experimental Psychology: General. 2008;137:201–225. doi: 10.1037/0096-3445.137.2.201. [DOI] [PMC free article] [PubMed] [Google Scholar]
- Fujita K. On conceptualizing self-control as more than the effortful inhibition of impulses. Personality and Social Psychology Review. 2011;15:352–366. doi: 10.1177/1088868311411165. [DOI] [PubMed] [Google Scholar]
- Fujita K, Trope Y, Cunningham WA, Liberman N. What is control? A conceptual analysis. In: Sherman JW, Gawronski B, Trope Y, editors. Dual-process theories of the social mind. New York, NY: Guilford Press; pp. 50–68. [Google Scholar]
- Gaertner SL, McLaughlin JP. Racial stereotypes: Associations and ascriptions of positive and negative characteristics. Social Psychology Quarterly. 1983;46:23–30. [Google Scholar]
- Gawronski B, Bodenhausen GV. Operating principles versus operating conditions in associative and propositional processes. Behavioral and Brain Sciences. 2009;32:207–208. [Google Scholar]
- Gilbert DT, Hixon JG. The trouble of thinking: Activation and application of stereotypic beliefs. Journal of Personality and Social Psychology. 1991;60:509–517. [Google Scholar]
- Glaser J, Knowles ED. Implicit motivation to control prejudice. Journal of Experimental Social Psychology. 2008;44:164–172. [Google Scholar]
- Gonsalkorale K, Sherman JW, Allen TJ, Klauer KC, Amodio DM. Accounting for successful control of implicit racial bias: The roles of association activation, response monitoring, and overcoming bias. Personality and Social Psychology Bulletin. 2011;37(11):1534–1545. doi: 10.1177/0146167211414064. [DOI] [PubMed] [Google Scholar]
- Govorun O, Payne BK. Ego depletion and prejudice: Separating automatic and controlled components. Social Cognition. 2006;24:111–136. [Google Scholar]
- Greenwald AG, Banaji MR. Implicit social cognition: Attitudes, self-esteem, and stereotypes. Psychological Review. 1995;102(1):4–27. doi: 10.1037/0033-295x.102.1.4. [DOI] [PubMed] [Google Scholar]
- Greenwald AG, McGhee DE, Schwartz JLK. Measuring individual differences in implicit cognition: The implicit association test. Journal of Personality and Social Psychology. 1998;74(6):1464–1480. doi: 10.1037//0022-3514.74.6.1464. [DOI] [PubMed] [Google Scholar]
- Greenwald AG, Nosek BA, Banaji MR. Understanding and using the Implicit Association Test: I. An improved scoring algorithm. Journal of Personality and Social Psychology. 2003;85(2):197–216. doi: 10.1037/0022-3514.85.2.197. [DOI] [PubMed] [Google Scholar]
- Hilgard J, Bartholow BD, Dickter CL, Blanton H. Characterizing switching and congruency effects in the Implicit Association Test as reactive and proactive cognitive control. Social Cognitive and Affective Neuroscience. doi: 10.1093/scan/nsu060. (in press) [DOI] [PMC free article] [PubMed] [Google Scholar]
- Hofmann W, Gawronski B, Gschwendner T, Le H, Schmitt M. A meta-analysis on the correlation between the implicit association test and explicit self-report measures. Personality and Social Psychology Bulletin. 2005;31:1369–1385. doi: 10.1177/0146167205275613. [DOI] [PubMed] [Google Scholar]
- Hofmann W, Gschwendner T, Schmitt M. On implicit-explicit consistency: The moderating role of individual differences in introspection and adjustment. European Journal of Personality. 2005;19:25–49. [Google Scholar]
- Hofmann W, Schmeichel BJ, Baddeley AD. Executive functions and self-regulation. Trends in Cognitive Sciences. 2012;16:174–180. doi: 10.1016/j.tics.2012.01.006. [DOI] [PubMed] [Google Scholar]
- Hu L, Bentler PM. Fit indices in covariance structure modeling: Sensitivity to underparameterized model misspecification. Psychological Methods. 1998;3:424–453. [Google Scholar]
- Huizinga M, Dolan CV, van der Molen MW. Age-related change in executive function: Developmental trends and a latent variable analysis. Neuropsychologia. 2006;44:2017–2036. doi: 10.1016/j.neuropsychologia.2006.01.010. [DOI] [PubMed] [Google Scholar]
- Hugenberg K, Bodenhausen GV. Ambiguity in social categorization: The role of prejudice and facial affect in race categorization. Psychological Science. 2004;15:342–345. doi: 10.1111/j.0956-7976.2004.00680.x. [DOI] [PubMed] [Google Scholar]
- Huntsinger JR, Sinclair S, Clore GL. Affective regulation of implicitly measured stereotype and attitudes: Automatic and controlled components. Journal of Experimental Social Psycyhology. 2009;45:560–566. doi: 10.1016/j.jesp.2009.01.007. [DOI] [Google Scholar]
- Jacoby LL. A process dissociation framework: Separating automatic from intentional uses of memory. Journal of Memory & Language. 1991;30:513–541. [Google Scholar]
- Klauer KC, Mierke J. Task-set inertia, attitude accessibility, and compatibility-order effects: New evidence for a task-set switching account of the IAT effect. Personality and Social Psychology Bulletin. 2005;31:208–217. doi: 10.1177/0146167204271416. [DOI] [PubMed] [Google Scholar]
- Klauer KC, Schmitz F, Teige-Mocigemba S, Voss A. Understanding the role of executive control in the Implicit Association Test: Why flexible people have small IAT effects. Quarterly Journal of Experimental Psychology. 2010;63:595–619. doi: 10.1080/17470210903076826. [DOI] [PubMed] [Google Scholar]
- Klauer KC, Voss A, Schmitz F, Teige-Mocigemba S. Process components of the Implicit Association Test: A diffusion-model analysis. Journal of Personality and Social Psychology. 2007;93:353–368. doi: 10.1037/0022-3514.93.3.353. [DOI] [PubMed] [Google Scholar]
- Klein A, Moosbrugger H. Maximum likelihood estimation of latent interaction effects with the LMS method. Psychometrika. 2000;65:457–474. [Google Scholar]
- Koole SL, Dijksterhuis A, van Knippenberg A. What’s in a name: implicit self-esteem and the automatic self. Journal of Personality and Social Psychology. 2001;80(4):669–685. doi: 10.1037//0022-3514.80.4.669. [DOI] [PubMed] [Google Scholar]
- Kunda Z. The case for motivated reasoning. Psychological Bulletin. 1990;108:480–498. doi: 10.1037/0033-2909.108.3.480. [DOI] [PubMed] [Google Scholar]
- Lambert AJ, Payne BK, Shaffer LM, Jacoby LL, Chasteen A, Khan S. Stereotypes as dominant responses: On the “social facilitation” of prejudice in anticipated public contexts. Journal of Personality and Social Psychology. 2003;84:277–295. doi: 10.1037//0022-3514.84.2.277. http://dx.doi.org/10.1037/0022-3514.84.2.277. [DOI] [PubMed] [Google Scholar]
- Lehto JE, Juujarvi P, Kooistra L, Pulkkinen L. Dimensions of executive functioning: Evidence from children. British Journal of Developmental Psychology. 2003;21:59–80. [Google Scholar]
- Logan GD. On the ability to inhibit thought and action: A user’s guide to the stop signal paradigm. In: Dagenbach D, Carr TH, editors. Inhibitory processes in attention, memory, and language. San Diego, CA: Academic Press; 1994. pp. 189–239. [Google Scholar]
- Macrae CN, Bodenhausen GV, Milne AB, Jetten J. Out of mind but back in sight: Stereotypes on the rebound. Journal of Personality and Social Psychology. 1994;67:808–817. [Google Scholar]
- Maddux WW, Barden J, Brewer MB, Petty RE. Saying no to negativity: The effects of context and motivation to control prejudice on automatic evaluative responses. Journal of Experimental Social Psychology. 2005;41:19–35. [Google Scholar]
- Mayr U, Kliegl R. Task-set switching and long-term memory retrieval. Journal of Experimental Psychology: Learning, Memory, and Cognition. 2000;26:1124–1140. doi: 10.1037//0278-7393.26.5.1124. [DOI] [PubMed] [Google Scholar]
- Mendoza SA, Gollwitzer PM, Amodio DM. Reducing the expression of implicit Stereotypes: Reflexive control through implementation intentions. Personality and Social Psychology Bulletin. 2010;36:512–523. doi: 10.1177/0146167210362789. [DOI] [PubMed] [Google Scholar]
- Mierke J, Klauer KC. Method-specific variance in the Implicit Attitude Test. Journal of Personality and Social Psychology. 2003;85:1180–1192. doi: 10.1037/0022-3514.85.6.1180. [DOI] [PubMed] [Google Scholar]
- Miyake A, Emerson MJ, Padilla F, Ahn JC. Inner speech as a retrieval aid for task goals: The effects of cue type and articulatory suppression in the random task cuing paradigm. Acta Psychologica. 2004;115:123–142. doi: 10.1016/j.actpsy.2003.12.004. [DOI] [PubMed] [Google Scholar]
- Miyake A, Friedman NP. The nature and organization of individual differences in executive functions: Four general conclusions. Current Directions in Psychological Science. 2012;21:8–14. doi: 10.1177/0963721411429458. [DOI] [PMC free article] [PubMed] [Google Scholar]
- Miyake A, Friedman NP, Emerson MJ, Witzki AH, Howerter A, Wager T. The unity and diversity of executive functions and their contributions to complex “frontal lobe” tasks: A latent variable analysis. Cognitive Psychology. 2000;41:49–100. doi: 10.1006/cogp.1999.0734. [DOI] [PubMed] [Google Scholar]
- Monteith MJ. Self-regulation of prejudiced responses: Implications for progress in prejudice reduction efforts. Journal of Personality and Social Psychology. 1993;65:469–485. [Google Scholar]
- Monteith MJ, Ashburn-Nardo L, Voils CI, Czopp AM. Putting the brakes on prejudice: On the development and operation of cues for control. Journal of Personality and Social Psychology. 2002;83:1029–1050. doi: 10.1037//0022-3514.83.5.1029. [DOI] [PubMed] [Google Scholar]
- Monteith MJ, Lybarger JE, Woodcock A. Schooling the cognitive monster: The role of motivation in the regulation and control of prejudice. Social and Personality Compass. 2009;3:211–226. [Google Scholar]
- Monteith MJ, Sherman JW, Devine PG. Suppression as a stereotype control strategy. Personality and Social Psychology Review. 1998;2:63–82. doi: 10.1207/s15327957pspr0201_4. [DOI] [PubMed] [Google Scholar]
- Mooijaart A, Satorra A. On insensitivity of the chi-square model test to nonlinear misspecification in structural equation models. Psychometrika. 2009;74:443–455. [Google Scholar]
- Morris N, Jones DM. Memory updating in working memory: The role of the central executive. British Journal of Psychology. 1990;81:111–121. [Google Scholar]
- Moskowitz GB, Gollwitzer PM, Wasel W, Schaal B. Preconscious control of stereotype activation through chronic egalitarian goals. Journal of Personality and Social Psychology. 1999;77:167. [Google Scholar]
- Munakata Y, Herd SA, Chatham CH, Depue BE, Banich MT, O’Reilly RC. A unified framework for inhibitory control. Trends in Cognitive Sciences. 2011;15:453–459. doi: 10.1016/j.tics.2011.07.011. [DOI] [PMC free article] [PubMed] [Google Scholar]
- Muthén LK, Muthén BO. Mplus User’s Guide. 7. Los Angeles, CA: Muthén & Muthén; 1998–2012. [Google Scholar]
- Neely JH. Semantic priming and retrieval from lexical memory: Roles of inhibitionless spreading activation and limited capacity attention. Journal of Experimental Psychology: General. 1977;106:226–254. [Google Scholar]
- Nisbett RE, Wilson TD. Telling more than we can know: Verbal reports on mental processes. Psychological Review. 1977;84:231–259. [Google Scholar]
- Oliver MB. African American men as “criminal and dangerous”: Implications of media portrayals of crime on the “criminalization” of African American men. Journal of African American Studies. 2003;7(2):3–18. doi: 10.1007/s12111-003-1006-5. [DOI] [Google Scholar]
- Park SH, Glaser J, Knowles ED. Implicit motivation to control prejudice moderates the effect of cognitive depletion on unintended discrimination. Social Cognition. 2008;26:379–398. [Google Scholar]
- Payne BK. Prejudice and perception: The role of automatic and controlled processes in misperceiving a weapon. Journal of Personality and Social Psychology. 2001;81:181–192. doi: 10.1037//0022-3514.81.2.181. [DOI] [PubMed] [Google Scholar]
- Payne BK, Lambert AJ, Jacoby LL. Best laid plans: Effects of goals on accessibility bias and cognitive control in race-based misperceptions of weapons. Journal of Experimental Social Psychology. 2002;38:384–396. [Google Scholar]
- Payne BK, Shimizu Y, Jacoby LL. Mental control and visual illusions: Toward explaining race-biased weapon misidentifications. Journal of Experimental Social Psychology. 2005;41:36–47. [Google Scholar]
- Payne BK. Conceptualizing Control in Social Cognition: How executive control modulates the expression of automatic stereotyping. Journal of Personality and Social Psychology. 2005;89:488–503. doi: 10.1037/0022-3514.89.4.488. http://dx.doi.org/10.1037/0022-3514.89.4.488. [DOI] [PubMed] [Google Scholar]
- Payne BK, Burkley M, Stokes MB. Why do implicit and explicit attitude tests diverge? The role of structural fit. Journal of Personality and Social Psychology. 2008;94:16–31. doi: 10.1037/0022-3514.94.1.16. http://dx.doi.org//10.1037/0022-3514.94.1.16. [DOI] [PubMed] [Google Scholar]
- Phillips LH. Do “frontal tests” measure executive function? Issues of assessment and evidence from fluency tests. In: Rabbitt P, editor. Methodology of frontal and executive function. Hove, UK: Psychology Press; 1997. pp. 191–213. [Google Scholar]
- Plant EA, Devine PG. Internal and external motivation to respond without prejudice. Journal of Personality and Social Psychology. 1998;75:811–832. doi: 10.1177/0146167205275304. [DOI] [PubMed] [Google Scholar]
- Posner MI, Snyder CRR. Attention and cognitive control. In: Solso RL, editor. Information processing and cognition: The Loyola symposium. Hillsdale, NJ: Erlbaum; 1975. pp. 55–85. [Google Scholar]
- Rabbitt P. Introduction: Methodologies and models in the study of executive function. In: Rabbitt P, editor. Methodology of frontal and executive function. Hove, UK: Psychology Press; 1997. pp. 1–38. [Google Scholar]
- Ranganath KA, Smith CT, Nosek BA. Distinguishing automatic and controlled components of attitudes from direct and indirect measurement methods. Journal of Experimental Social Psychology. 2008;44(2):386–396. doi: 10.1016/j.jesp.2006.12.008. [DOI] [PMC free article] [PubMed] [Google Scholar]
- Richeson JA, Baird AA, Gordon HL, Heatherton TF, Wyland CL, Trawalter S, Shelton JN. An fMRI investigation of the impact of interracial contact on executive function. Nature Neuroscience. 2003;6:1323–1328. doi: 10.1038/nn1156. [DOI] [PubMed] [Google Scholar]
- Richeson JA, Shelton JN. When prejudice does not pay: Effects of interracial contact on executive function. Psychological Science. 2003;14:287–290. doi: 10.1111/1467-9280.03437. [DOI] [PubMed] [Google Scholar]
- Roberts RJ, Hager LD, Heron C. Prefrontal cognitive processes: Working memory and inhibition in the antisaccade task. Journal of Experimental Psychology: General. 1994;123:374–393. [Google Scholar]
- Rogers RD, Monsell S. Costs of a predictable switch between simple cognitive tasks. Journal of Experimental Psychology: General. 1995;124:207–231. [Google Scholar]
- Satorra A, Bentler PM. A scaled difference chi-square test statistic for moment structure analysis. Psychometrika. 2001;66:507–514. doi: 10.1007/s11336-009-9135-y. [DOI] [PMC free article] [PubMed] [Google Scholar]
- Satorra A, Bentler PM. Ensuring positiveness of the scaled difference chi-square test statistic. Psychometrika. 2010;75:243–248. doi: 10.1007/s11336-009-9135-y. [DOI] [PMC free article] [PubMed] [Google Scholar]
- Schlauch RC, Lang AR, Plant EA, Christensen R, Donohue KF. Effect of alcohol on race-biased responding: the moderating role of internal and external motivations to respond without prejudice. Journal of Studies on Alcohol and Drugs. 2009;70:328–36. doi: 10.15288/jsad.2009.70.328. [DOI] [PubMed] [Google Scholar]
- Schmitz F, Teige-Mocigemba S, Voss A, Klauer KC. When scoring algorithms matter: Effects of working memory load on different IAT scores. British Journal of Social Psychology. 2013;52:103–121. doi: 10.1111/j.2044-8309.2011.02057.x. [DOI] [PubMed] [Google Scholar]
- Sherman JW, Gawronski B, Gonsalkorale K, Hugenberg K, Allen TJ, Groom CJ. The self-regulation of automatic associations and behavioral impulses. Psychological Review. 2008;115:314–335. doi: 10.1037/0033-295X.115.2.314. [DOI] [PubMed] [Google Scholar]
- Sherman JW, Klauer KC, Allen TJ. Mathematical modeling of implicit social cognition: The machine in the ghost. In: Gawronski B, Payne BK, editors. Handbook of implicit social cognition: Measurement, theory, and applications. New York, NY: Guilford; 2010. pp. 156–175. [Google Scholar]
- Sherman SJ, Rose JS, Koch K, Presson CC, Chassin L. Implicit and explicit attitudes toward cigarette smoking: The effects of context and motivation. Journal of Social and Clinical Psychology. 2003;22:13–39. [Google Scholar]
- Sherman JW. Clearing up some misconceptions about the Quad Model. Psychological Inquiry. 2006;17:269–276. [Google Scholar]
- Siegel EF, Dougherty MR, Huber DE. Manipulating the role of cognitive control while taking the implicit association test. Journal of Experimental Social Psychology. 2012;48:1057–1068. [Google Scholar]
- Stewart BD, Payne BK. Bringing automatic stereotyping under control: Implementation intentions as efficient means of thought control. Personality and Social Psychology Bulletin. 2008;34:1332–1345. doi: 10.1177/0146167208321269. http://dx.doi.org//10.1177/0146167208321269. [DOI] [PubMed] [Google Scholar]
- Stewart BD, Von Hippel W, Radvansky GA. Age, Race, and Implicit Prejudice: Using Process Dissociation to Separate the Underlying Components. Psychological Science. 2009;20(2):164–168. doi: 10.1111/j.1467-9280.2009.02274.x. [DOI] [PubMed] [Google Scholar]
- Stroop JR. Studies of interference in serial verbal reactions. Journal of Experimental Psychology. 1935;18:643–662. [Google Scholar]
- Teuber HL. Unity and diversity of frontal lobe functions. Acta Neurobiologiae Experimentalis. 1972;32:615–656. [PubMed] [Google Scholar]
- van den Wildenberg WPM, van Boxtel GJM, van der Molen MW, Bosch DA, Speelman JD, Brunia CHM. Simulation of the subthalamic region facilitates selection and inhibition of motor responses in Parkinson’s Disease. Journal of Cognitive Neuroscience. 2006;18:626–636. doi: 10.1162/jocn.2006.18.4.626. [DOI] [PubMed] [Google Scholar]
- Verbruggen F, Logan GD. Response inhibition in the stop-signal paradigm. Trends in Cognitive Sciences. 2008;12:418–424. doi: 10.1016/j.tics.2008.07.005. [DOI] [PMC free article] [PubMed] [Google Scholar]
- von Hippel W. Aging, executive functioning, and social control. Current Directions in Psychological Science. 2007;16:240–244. [Google Scholar]
- von Hippel W, Silver LA, Lynch ME. Stereotyping against your will: The role of inhibitory ability in stereotyping and prejudice among the elderly. Personality and Social Psychology Bulletin. 2000;26:523–532. [Google Scholar]
- Wen Z, Marsh HW, Hau KT. Structural equation models of latent interactions: An appropriate standardized solution and its scale-free properties. Structural Equation Modeling. 2010;17:1–22. [Google Scholar]
- Wilcox RR, Keselman HJ. Modern robust data analysis methods: Measures of central tendency. Psychological Methods. 2003;8:254–274. doi: 10.1037/1082-989X.8.3.254. [DOI] [PubMed] [Google Scholar]
- Willcutt EG, Pennington BF, Boada R, Tunick RA, Ogline J, Chhabildas NA, Olson RK. A comparison of the cognitive deficits in reading disability and attention-deficit/hyperactivity disorder. Journal of Abnormal Psychology. 2001;110:157–172. doi: 10.1037//0021-843x.110.1.157. [DOI] [PubMed] [Google Scholar]
- Yntema DB. Keeping track of several things at once. Human Factors. 1963;5:7–17. doi: 10.1177/001872086300500102. [DOI] [PubMed] [Google Scholar]
- Young SE, Friedman NP, Miyake A, Willcutt EG, Corley RP, Haberstick BC, Hewitt JK. Behavioral dis- inhibition: Liability for externalizing spectrum disorders and its genetic and environmental relation to response inhibition across adolescence. Journal of Abnormal Psychology. 2009;118:117–130. doi: 10.1037/a0014657. [DOI] [PMC free article] [PubMed] [Google Scholar]
- Zajonc RB. Feeling and thinking: Preferences need no inferences. American Psychologist. 1980;35:151–175. [Google Scholar]
Associated Data
This section collects any data citations, data availability statements, or supplementary materials included in this article.