

Abstract
The gastrointestinal tracts of mammals are colonized by hundreds of microbial species that contribute to health, including colonization resistance against intestinal pathogens1. Many antibiotics destroy intestinal microbial communities and increase susceptibility to intestinal pathogens2. Among these, Clostridium difficile, a major cause of antibiotic-induced diarrhea, greatly increases morbidity and mortality in hospitalized patients3. Which intestinal bacteria provide resistance to C. difficile infection and their in vivo inhibitory mechanisms remain unclear. By treating mice with different antibiotics that result in distinct microbiota changes and lead to varied susceptibility to C. difficile, we correlated loss of specific bacterial taxa with development of infection. Mathematical modeling augmented by microbiota analyses of hospitalized patients identified resistance-associated bacteria common to mice and humans. Using these platforms, we determined that Clostridium scindens, a bile acid 7-dehydroxylating intestinal bacterium, is associated with resistance to C. difficile infection and, upon administration, enhances resistance to infection in a secondary bile acid-dependent fashion. Using a workflow involving mouse models, clinical studies, metagenomic analyses and mathematical modeling, we identified a probiotic candidate that corrects a clinically relevant microbiome deficiency. These findings have implications for rational design of targeted antimicrobials as well as microbiome-based diagnostics and therapeutics for individuals at risk for C. difficile infection.
Clostridium difficile infection is a growing public health threat3. Susceptibility to infection is associated with antibiotic use3, and fecal microbiota transplant (FMT), which restores microbiota complexity, can resolve recurrent infections4. However the microbiome-encoded genes and biosynthetic gene clusters5 critical for infection resistance remain largely undefined, limiting mechanistic understanding and development of microbiota-based therapies. We sought to identify, interrogate, and validate sources of microbiome-mediated C. difficile resistance. We first investigated the impact of antibiotics with diverse antimicrobial spectra on the intestinal microbiota and C. difficile susceptibility (Extended Data Fig. 1a). Consistent with prior work from our group2, clindamycin administration resulted in long-lasting susceptibility to infection (Fig. 1a). In contrast, ampicillin induced transient susceptibility (Fig. 1c), while enrofloxacin did not increase susceptibility to C. difficile infection (Fig. 1e). C. difficile toxin expression correlated significantly with C. difficile abundance in the intestine (Extended Data Fig. 1b). The antibiotic regimens did not substantially alter bacterial density (Extended Data Fig. 1c), but 16S rRNA gene amplicon sequencing revealed that the three antibiotics had distinct impacts on intestinal microbiota composition (Fig. 1b, d, f).
Figure 1. Different antibiotics induce distinct changes to C. difficile infection resistance and intestinal microbiota composition.
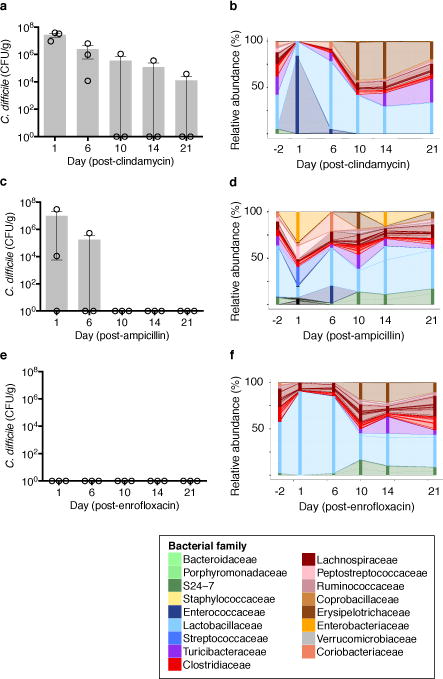
Susceptibility to C. difficile infection following clindamycin (a), ampicillin (b), or enrofloxacin (c). Correlation of C. difficile CFU and toxin in cecal content following infection (d). Intestinal microbiota composition at timepoints indicated (e,f,g). Each stacked bar represents the mean microbiota composition of three separately-housed animals. ****P<0.0001. Center values (mean), error bars (s.e.m.) (a, b, c).
We exploited this variance in intestinal bacterial composition and infection susceptibility to relate features of microbiota structure to C.difficile inhibition. Infection susceptibility correlated with decreased microbiota alpha diversity (i.e. diversity within individuals) (Fig. 2a), consistent with previous studies6. Using weighted UniFrac7 distances to evaluate beta diversity (i.e. diversity between individuals), we found that although clindamycin and ampicillin administration induced distinct changes in microbiota structure, recovery of resistance corresponded with return to a common coordinate space shared by antibiotic-naïve animals (Fig. 2b). However, these diversity metrics generally did not resolve the susceptibility status of animals harboring microbiota with low alpha diversity (Fig. 2a (red box)) or at early timepoints post-antibiotic exposure (Fig. 2b), suggesting that recovery of more precise microbiota features (e.g. individual species) contributed to infection resistance. We correlated resistance with individual bacterial species abundances, corresponding to operational taxonomic units (OTUs, ≥97% 16S sequence identity) (Extended Data Fig. 1d), and identified 11 bacterial OTUs that correlated strongly with infection resistance (Fig. 2c). These OTUs represent a small fraction of the microbiota membership (6%) and were comprised primarily by Clostridium cluster XIVa, including the OTU with the strongest resistance correlation, even among animals harboring low-alpha diversity microbiota, Clostridium scindens (Figure 2c).
Figure 2. Native intestinal bacterial species conserved across murine and human microbiota are predicted to inhibit C. difficile infection.
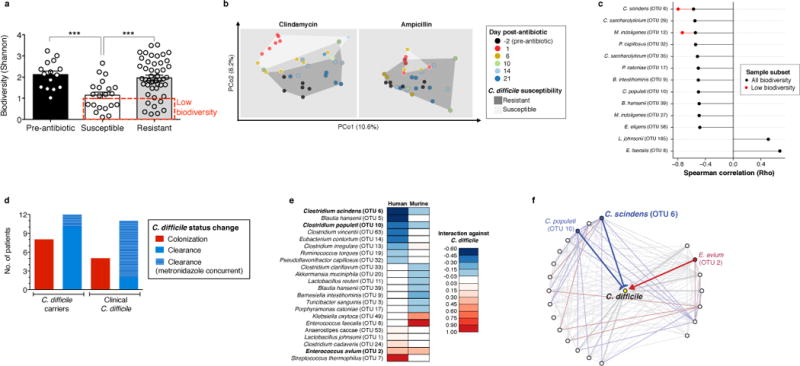
Intestinal microbiota alpha diversity (a) and Beta diversity (weighted UniFrac distances) (b) of antibiotic-naïve (n=15) and antibiotic-exposed animals susceptible (n=21) or resistant (n=47) to C. difficile infection. Correlation of individual bacterial OTUs with susceptibility to C. difficile infection (c). Colonization (C. difficile-negative to -positive) and clearance (C. difficile-positive to –negative) events among C. difficile-diagnosed and carrier patients included in microbiota time-series inference modeling (d). Bacterial species with strong C. difficile interactions in human and murine microbiota models (e) that exist in a conserved subnetwork predicted to inhibit (blue) or positively associate (red) with C. difficile (f). ***P<0.001. In (c), P<0.0005 (“any biodiversity”, n=68) or P<0.05 (“Low biodiversity”, Shannon≤1 (n=16 animals). Center values (mean), error bars (s.e.m.).
To relate intestinal bacterial species to C. difficile resistance in humans, we extended our study to a cohort of patients undergoing allogeneic hematopoeietic stem cell transplantation (allo-HSCT). The majority of these patients were diagnosed with a hematological malignancy and received chemotherapy and/or total body irradiation as well as antibiotics during transplantation (Extended Data Table 1), incurring reduced microbiota biodiversity associated with increased risk of bacterial blood stream infections8 and C. difficile infection9. Compared to controlled animal studies, temporal variation in antibiotic administration and sampling times among patients complicates analysis of relationships between microbiota composition and infection susceptibility. To address these challenges we employed a recently developed systems biology approach10 that integrates antibiotic delivery schedules and time-resolved microbiota data to mathematically model microbiota dynamics and infer which bacteria inhibit C. difficile. We included 24 allo-HSCT patients, 12 diagnosed with C. difficile infection and 12 that were C. difficile carriers without clinical infection (Fig. 2d, Extended Data Fig. 2). To facilitate comparisons across datasets, we clustered murine and human microbiota together to define OTUs (≥97% sequence similarity) that together accounted for a majority of both the human and mouse microbiota structure (Extended Data Fig. 3a,b,c), and applied the modeling approach to the murine study in parallel. We compared the normalized interaction networks from the human (Extended Data Fig. 3d) and the murine models (Extended Data Fig. 3e) and identified bacteria displaying strong inhibition against C. difficile. Despite some differences across host species networks, the human model identified two C. difficile-inhibiting OTUs that were conserved in the murine model (Fig. 2e, f), the strongest of which was C. scindens, corroborating our murine correlation-based analyses (Fig. 2c).
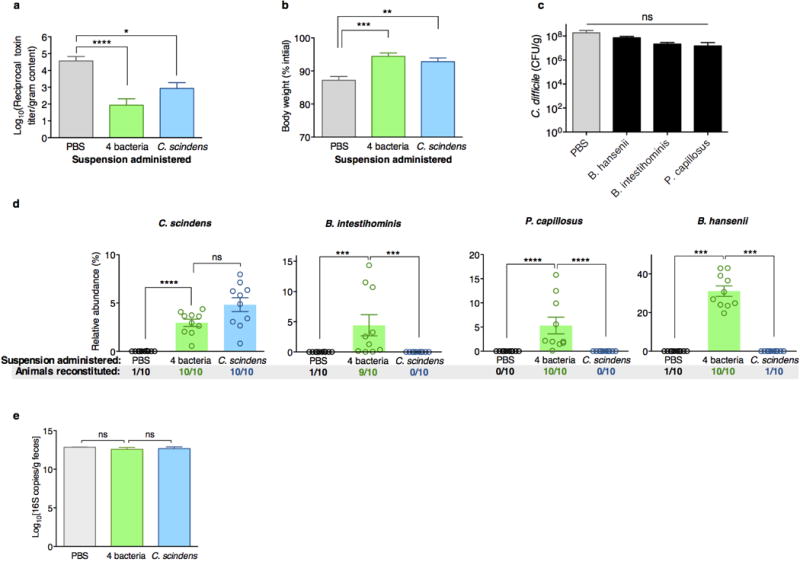
To evaluate causality between intestinal bacteria identified in our analyses and infection resistance, we adoptively transferred resistance-associated bacteria. We cultured a representative consortium of four intestinal bacterial isolates with species-level 16S homology to OTUs associated with C. difficile inhibition in our mouse and human analyses (Extended Data Fig. 4) and, following antibiotic administration, animals (n=10) were administered a suspension containing the 4-bacteria consortium or vehicle (PBS) prior to C. difficile infection. Additionally, since C. scindens had the strongest resistance associations in mice and humans (Fig. 2c and e), we included this bacterium in the consortium and in a third arm alone. Adoptive transfer of the consortium or C. scindens alone ameliorated C. difficile infection (Fig. 3a, b, Extended Data Fig. 5a) as well as associated weight loss (Fig. 3c, Extended Data Fig. 5b) and mortality (Fig. 3d) significantly compared to control. Transfer of the other three isolates individually, however, did not significantly enhance infection resistance (Extended Data Fig. 5c). Engraftment of the transferred bacteria was confirmed (Extended Data Fig. 5d) by 16S sequence homology with the input and the native intestinal bacteria from our initial analyses (Fig. 2), thus fulfilling Koch’s postulates (albeit between a microorganism and a beneficial health outcome). C. scindens abundance correlated significantly with infection resistance (Fig. 3e), suggesting that improving bacterial engraftment efficiency may enhance the protective effects of the adoptive transfer. Importantly, bacteria transfer was precise and engraftment did not alter other aspects of microbiota structure compared to control, including density (Extended Data Fig. 5e) and biodiversity (Figure 3f).
Figure 3. Adoptive transfer of resistance-associated intestinal bacteria following antibiotic exposure increases resistance to C. difficile infection.
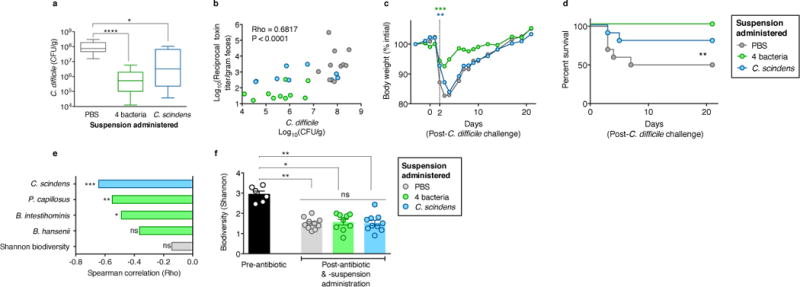
Intestinal burden of C. difficile CFU (a) and toxin (b) 24 hours after C. difficile infection of antibiotic-exposed animals receiving adoptive transfers. Weight loss (c) and mortality (d) of animals post-infection. Correlation of adoptively-transferred bacteria engraftment with C. difficile susceptibility, (e) and microbiota biodiversity (f) pre-infection. ****P<0.0001, **P<0.01, *P<0.05, ns (not significant). Mean (f)), error bars (range (a), s.e.m. (f)).
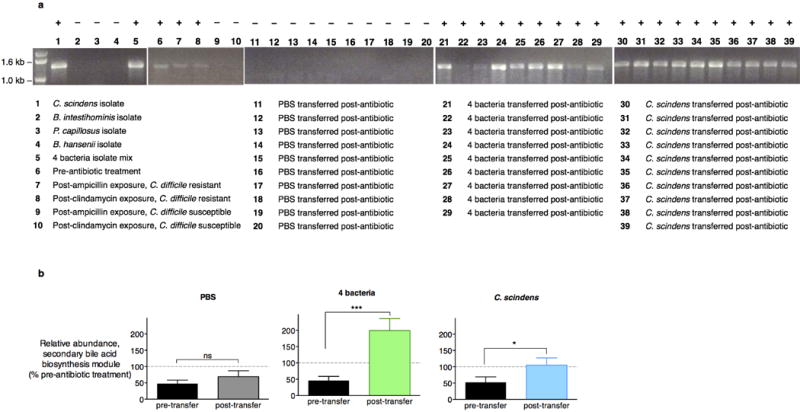
We next interrogated the mechanism of C. scindens-mediated C. difficile inhibition. Some secondary bile acids can impair C. difficile growth in vitro11,12, but the source and contribution of such metabolites to infection resistance in vivo remain unclear. Noting that C. scindens expresses enzymes crucial for secondary bile acid synthesis13 that are uncommon among intestinal bacteria14, we hypothesized that the C. difficile-protective effects of C. scindens may derive from this rare biosynthetic capacity. Analyses of antibiotic-exposed animals (Figs. 1, 2) revealed that recovery of secondary bile acids and secondary bile acid biosynthesis gene family abundance (as predicted using PICRUSt15) correlated with C. difficile resistance (Fig. 4a,b). Targeted microbiome analysis of the secondary bile acid biosynthesis gene family indicated that abundance of the bile acid-inducible (bai) operon genes correlated strongly with resistance to C. difficile infection (Fig. 4c) but bile salt hydrolase (BSH)-encoding gene abundance did not, consistent with reports indicating that BSH-encoding genes are distributed broadly while an extremely small fraction of intestinal bacteria possess a complete secondary bile acid synthesis pathway14. PCR-based assay of baiCD, which encodes the 7α-hydroxysteroid dehydrogenase enzyme critical for secondary bile acid biosynthesis, revealed that animals that had recovered C. difficile resistance following antibiotic exposure harbored a baiCD+ microbiome, whereas susceptible animals did not (Extended Data Fig. 6a).
Figure 4. C. scindens-mediated C. difficile inhibition is associated with secondary bile acid synthesis and dependent on bile endogenous to intestinal content.
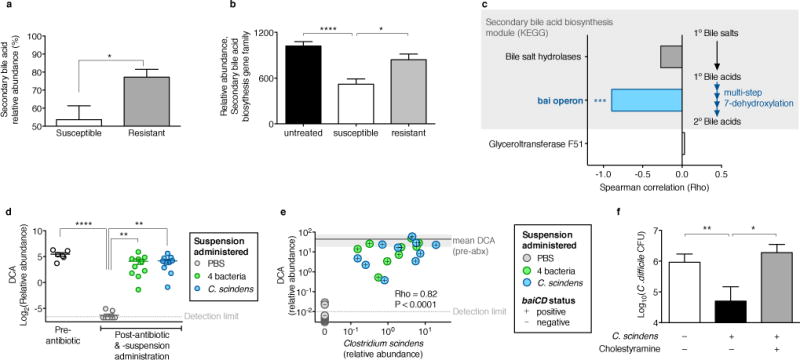
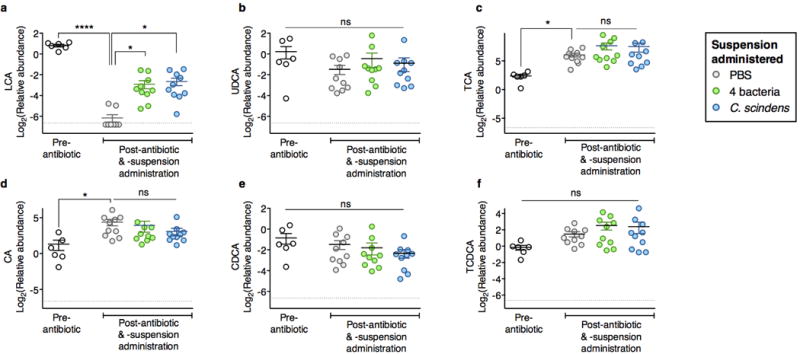
Relative abundance of secondary bile species (a) and biosynthesis gene abundance predicted by PICRUSt (b) in intestinal content from antibiotic-exposed C. difficile susceptible (n=21), resistant (n=47), and pre-antibiotic (n=15) animals. Correlation of C. difficile susceptibility with secondary bile acid biosynthesis gene family abundance in intestinal content (n=6) quantified using shotgun sequencing (c). Intestinal abundance of deoxycholic acid (DCA) following adoptive transfer of bacteria (n=10 per group) (d). Correlation of C. scindens engraftment with DCA abundance and baiCD status in intestinal content of antibiotic-exposed, adoptively transferred animals (n=30) (e). Bile acid-dependent C. scindens-mediated inhibition of C. difficile quantified ex vivo (n=6 per group) (f). ****P<0.0001, ***P<0.001, **P<0.01, *P<0.05. Gylceroltransferase F51, endogenous reference gene (c). Shaded region around mean ‘pre-antibiotic (abx)’ DCA abundance (s.d.) (e).
Recipients of either the consortium or C. scindens harbored baiCD+ microbiomes with restored secondary bile acid biosynthesis gene abundance (predicted by PICRUSt) (Extended Data Fig. 6). Administration of either bacterial suspension also restored relative abundance of the secondary bile acids deoxycholate (DCA) (Fig. 4d) and lithocholate (LCA) (Extended Data Fig. 7a), both of which inhibit C. difficile in a dose-dependent fashion (Extended Data Fig. 8a,b), but abundances of primary bile acids were not significantly altered (Extended Data Fig. 7). Metagenomic inference indicated that consortia recipients harbored microbiomes with greater secondary bile acid biosynthesis gene abundance than C. scindens recipients (Extended Data Fig. 6b), perhaps explaining their superior C. difficile resistance. However, intestinal DCA and LCA abundance was comparable in the two groups pre-infection challenge (Fig. 4d, Extended Data Fig. 7a), suggesting additional mechanisms enhanced colonization resistance in consortia recipients. Indeed, of the four transferred bacteria only C. scindens was baiCD+ (Extended Data Fig. 6a). C. scindens engraftment also correlated strongly with DCA relative abundance and baiCD in recipients, reaching levels observed in antibiotic-naive animals (Fig. 4e), indicating that precise transfer and efficient engraftment of this bacterium could restore physiological levels of secondary bile acid synthesis in antibiotic-exposed animals.
We evaluated bile acid-dependent microbiota-mediated C. difficile inhibition using an ex vivo model. Pre-incubation of intestinal content from antibiotic-naïve animals with cholestyramine, a bile acid sequestrant16, permitted C. difficile growth (Extended Data Fig. 8c,d) comparable to intestinal content from antibiotic-exposed animals. Consistent with in vivo findings, introduction of C. scindens significantly inhibited C. difficile in the intestinal content from antibiotic-exposed animals. This effect was neutralized when intestinal content was pre-incubated with cholestyramine (Fig. 4f), indicating that C. scindens-mediated C. difficile inhibition is dependent upon accessing and modifying endogenous bile salts and recapitulates a natural mechanism of microbiota-mediated infection resistance.
We show that a fraction of the intestinal microbiota as precise as a single bacterial species confers infection resistance by synthesizing C. difficile-inhibiting metabolites from host-derived bile salts. Our use of a human-derived C. scindens isolate to augment murine C. difficile inhibition underscores the conservation of this finding across species and suggests therapeutic and diagnostic applications. The genus Clostridium is phylogenetically complex17,18, highlighting the value of integrating functional genomic and metabolomic interrogation with 16S rRNA profiling when evaluating probiotic candidates. Most bile acid 7-dehydroxylating bacteria are cluster XIVa Clostridia closely related to one another14,19,20 and resistance-associated OTUs we identified, suggesting that bai or 16S gene signatures may serve as specific, functionally meaningful biomarkers for infection resistance. The replenishment of secondary bile acids and/or biosynthesis-competent bacteria (such as C. scindens) may contribute to the therapeutic efficacy of FMT21. Attempts to directly manipulate intestinal bile acids should be performed with caution since some secondary bile acids have been linked to gastrointestinal cancers22. Other bacteria may augment resistance by enhancing 7-dehydroxylating Clostridia or through additional orthogonal mechanisms, such as competition for mucosal carbohydrates23, activation of host immune defenses24,25, or production of antibacterial peptides26. Knowledge of such mechanisms and the ecological context of those microbes responsible will facilitate amplification of microbiota-mediated pathogen resistance in individuals at risk for infection.
Methods
Mouse husbandry
All experiments were performed with C57BL/6J female mice, 6 to 8 weeks old, purchased from Jackson Laboratories and housed in sterile cages with irradiated food and acidified water. Mouse handling and weekly cage changes were performed by investigators wearing sterile gowns, masks, and gloves in a sterile biosafety hood. All animals were maintained in a specific-pathogen-free facility at Memorial Sloan-Kettering Cancer Center Animal Resource Center. Following co-housing for ≥2 weeks, animals (individuals or colonies, as indicated per experiment) were separately-housed and randomly assigned to experimental groups. For experiments involving C. difficile infection, mice were administered 1,000 C. difficile VPI 10463 spores in phosphate-buffered saline (PBS) by oral gavage. All animal experiments were performed at least twice unless otherwise noted. Experiments were performed in compliance with Memorial Sloan-Kettering Cancer Center institutional guidelines and approved by the institution’s IACUC.
Murine C. difficile susceptibility time course experiments
Mice from three separately housed-colonies were kept in the same facility and administered clindamycin (administered by intraperitoneal injection, 200 μg q.d.), ampicillin (administered in drinking water, 0.1 g/L), or enrofloxacin (administered in drinking water, 0.4 g/L) for three days (days -2 through 0). At each time point (days 1, 6, 10, 14, and 21), one mouse from each of the three colonies was randomly selected to be single-housed, infected with C. difficile, and analyzed, yielding triplicate measurements per time point. Individual mice from each colony were isolated and challenged with C. difficile at intervals post-antibiotic cessation indicated, yielding triplicate biological replicates per group, per timepoint. Intestinal content (feces) was sampled prior to infection challenge for multiparallel 16S amplicon sequencing and microbiota structure analysis. C. difficile susceptibility was determined by selective culture and enumeration of colony-forming units (CFU) from intestinal content (cecum and colon) 24 hours post-challenge.
Murine in vivo adoptive transfer experiments
Six colonies of mice (n=30 total) were administered antibiotics as described previously27 and subsequently individually housed and assigned randomly to one of three groups. Two days following antibiotics, groups of individually-housed mice (n=10 per group) received either 1,000,000 CFU of a 4-bacteria suspension (containing equal numbers of Clostridium scindens (ATCC35704), Barnesiella intestihominis (isolated from murine feces in-house), Pseudoflavonifractor capillosus (ATCC29799), and Blautia hansenii (ATCC27752)), a suspension containing 1,000,000 C. scindens, or vehicle (PBS) by gavage. All bacteria were grown under anaerobic conditions in reduced Brain-Heart Infusion media supplemented with yeast extract and cysteine except for B. intestihominis, which was grown in liquid Wilkins-Chalgren media, and resuspended in anaerobic PBS prior to administration to animals. Adoptive transfers of the suspensions were performed once daily for two consecutive days prior to challenge with C. difficile VPI 10463 (1,000 spores in PBS). C. difficile bacteria and cytotoxin was quantified in fecal samples obtained from mice 24 hours after infection challenge. Animals were monitored for 21 days after infection challenge and weight loss was recorded.
Murine ex vivo adoptive transfer experiments
Three individually-housed mice were administered 200 μg of clindamycin by intraperitoneal injection and sacrificed 24 hours later. Intestinal content was harvested from the ilea of sacrificed animals, immediately transferred to an anaerobic chamber, and resuspended in anaerobic PBS. Fractions containing 100 mg of intestinal content from each mouse were distributed and received either C. scindens (100,000 CFU) or vehicle (anaerobic PBS). A third fraction was pre-treated with cholestyramine (1.5 mg) prior to receiving C. scindens. Following transfer, the each suspension was inoculated with vegetative C. difficile (200 CFU), incubated at 37°C for 60 hours, and C. difficile bacteria were quantified by overnight culture on selective media.
Quantitative C. difficile culture and toxin A and B
The quantities of C. difficile CFU and cytotoxin in the intestinal (cecal) contents of animals were determined as described previously2.
Enzymatic assay of secondary bile acid abundance
The relative abundances of primary and secondary bile acids in the intestinal content of sacrificed animals was quantified using an enzymatic assay as described previously28.
Sample collection and DNA extraction
Intestinal microbiota content samples were obtained, snap-frozen, stored, and DNA extracted as described previously29. Briefly, a frozen aliquot (≈100 mg) of each sample was suspended, while frozen, in a solution containing 500 μl of extraction buffer (200 mM Tris, pH 8.0/200 mM NaCl/20 mM EDTA), 200 μl of 20% SDS, 500 μl of phenol:chloroform:isoamyl alcohol (24:24:1), and 500 μl of 0.1-mm-diameter zirconia/silica beads (BioSpec Products). Microbial cells were lysed by mechanical disruption with a bead beater (BioSpec Products) for 2 min, after which two rounds of phenol:chloroform:isoamyl alcohol extraction were performed. DNA was precipitated with ethanol and resuspended in 50 μl of TE buffer with 100μg/ml RNase. The isolated DNA was subjected to additional purification with QIAamp mini spin columns (Qiagen). Specimen collection from patients and analysis of the biospecimen group was approved by the Memorial Sloan-Kettering Cancer Center Institutional Review Board. All subjects provided written consent for specimen collection and analysis.
Quantification 16S copy number density by quantitative RT-PCR
DNA extracted from intestinal content samples (feces) was subjected to quantitative RT-PCR of 16S rRNA using 0.2 μM concentrations of the broad-range bacterial 16S primers 517F (5′-GCCAGCAGCCGCGGTAA-3′) and 798R (5′-AGGGTATCTAATCCT-3′) and the DyNAmo SYBR green qPCR kit (Finnzymes). Standard curves were generated by serial dilution of the PCR blunt vector (Invitrogen) containing one copy of the 16S rRNA gene derived from a member of the Porphyromonadaceae family. The cycling conditions were as follows: 95°C for 10 min, followed by 40 cycles of 95°C for 30 s, 52°C for 30 s, and 72°C for 1 min.
Quantification of baiCD by PCR
DNA extracted from intestinal content samples (feces) were subjected to PCR-based detection of the 7α-HSDH-encoding baiCD gene as described previously30.
16S rRNA gene amplification and multiparallel sequencing
Amplicons of the V4-V5 16S rRNA region were amplified and sequenced using an Illumina MiSeq platform for samples in the in vivo and ex vivo adoptive transfer experiments. For each sample, duplicate 50-μl PCR reactions were performed, each containing 50 ng of purified DNA, 0.2 mM dNTPs, 1.5 mM MgCl2, 1.25 U Platinum Taq DNA polymerase, 2.5 μl of 10X PCR buffer, and 0.2 μM of each primer designed to amplify the V4-V5: 563F (5′-nnnnnnnn-NNNNNNNNNNNN-AYTGGGYDTAAAGNG-3′) and 926R (5′-nnnnnnnn-NNNNNNNNNNNN-CCGTCAATTYHTTTRAGT-3′). A unique 12-base Golay barcode (Ns) precede the primers for sample identification31, and 1–8 additional nucleotides were placed in front of the barcode to offset the sequencing of the primers. Cycling conditions were 94°C for 3 minutes, followed by 27 cycles of 94°C for 50 seconds, 51°C for 30 seconds, and 72°C for 1 minute. 72°C for 5 min is used for the final elongation step. Replicate PCRs were pooled, and amplicons were purified using the Qiaquick PCR Purification Kit (Qiagen). PCR products were quantified and pooled at equimolar amounts before Illumina barcodes and adaptors were ligated on using the Illumina TruSeq Sample Preparation protocol. The completed library was sequenced on an Ilumina Miseq platform following the Illumina recommended procedures. Samples in the murine and human C. difficile susceptibility timecourse experiments were sequenced using the 454 FLX Titanium platform as described previously32. Sequences from allo-HSCT patients were obtained from a previously published study8.
Sequence analysis
Sequences were analyzed using the mothur33 (v.1.33.3) pipeline. Potentially chimeric sequences were removed using the UChime algorithm34. Sequences with distance-based similarity of 97% or greater were grouped into operational taxonomic units (OTUs) using the average neighbor algorithm and classified using the BLAST (megablast) algorithm and the Genbank 16S rRNA reference database, and OTU-based microbial diversity was estimated by calculating the Shannon diversity index. Sequences abundance profiles in each sample were used for downstream statistical and modeling analysis. A phylogenetic tree was inferred using Clearcut35, on the 16s rRNA sequence alignment generated by mothur, unweighted UniFrac7 was run using the resulting tree, and principal coordinate analysis (PCoA) was performed on the resulting matrix of distances between each pair of samples. PICRUSt (version 0.9.1)15 in combination with QIIME (version 1.6.0)36 was used to predict abundances of the secondary bile acid biosynthesis gene family (KEGG pathway ko00121) for a set of 83 samples. Maximum likelihood phylogenetic trees (Kimura model, bootstrap of 100 replicates) were constructed using the MEGA 6.06 package from representative sequences of intestinal bacteria as described37. Raw sequence data from metagenomic shotgun sequencing of six intestinal (ileal) microbiome samples were pre-processed to remove mouse-derived, duplicate, and low-quality reads as well as low-quality bases in accordance with Human Microbiome Project (HMP) protocols38 The remaining reads were mapped against a set of proteins associated the secondary bile acid biosynthesis pathway using RAPSearch 2.0739. For the subsequent analysis only hits with an e-value ≤ 0.1, a minimum alignment length of 30, and a minimum similarity of 50% were considered.
Quantification of secondary of bile acid species
Samples of murine intestinal content (feces, ~30 mg) were homogenized using a handheld homogenizer (Omni International) in 80% aqueous methanol and corrected to a final concentration of 0.5 mg / 10 μl. Samples were then sonicated using a Diagenode sonicator at high power, 6 × 30 sec cycles. 400 μl of this material was removed and 20 μl of internal standard added (25 μM d4-chenodeoxycholic acid in 55 % / 45 % methanol / water (v/v)). A further 1 ml methanol was added to the extract and samples were vortexed at 1,400rpm for 1 hr at 30°C (Thermomixer, Eppendorf). Remaining solid material was removed by centrifugation (21,000 × g for 10 min) and the supernatant transferred to a glass tube. A second extraction was performed using 1.5 ml methanol and combined supernatants were dried under a nitrogen gas stream. Finally samples were re-suspended in 300 μl 55 % / 45 % methanol / water (v/v), filtered through a 3 kDa molecular weight cut-off cartridge (Millipore) and transferred to a MS vial containing a reduced volume glass insert. Bile acids were separated using an Agilent 1290 HPLC and Cogent C18 column (2.1 mm × 150 mm, 2.2 μm; MicroSolv Technology Corporation). Mobile phase A: water + 0.05% formic acid; mobile phase B: acetone + 0.05% formic acid and flow rate: 0.35 ml/min. Injection volume was 5 ul and the LC gradient was from 25% B to 70% B in 25 min. Bile acids were detected using an Agilent 6550 Q-TOF mass spectrometer with JetStream source, operating in negative ionization mode and extended dynamic range. Acquisition was from m/z: 50 – 1100 at 1 spectra/second; gas temperature: 275°C; drying gas 11 l/min; nebulizer: 30 psig; sheath gas: 325°C; sheath gas flow 10 l/min; VCap 4000 V; fragmentor 365 V and Oct 1 RF 750 V. Bile acids (Extended Data Table 2) were identified by their exact mass and confirmed by chromatographic alignment to authentic standards (purchased from Steraloids Inc or Sigma Aldrich). Abundances of the M-H and M+formate ions were then extracted and summed using ProFinder software (Agilent Technologies) and normalized to the internal standard abundance using Mass Profiler Professional software (Agilent Technologies).
Deoxycholate and lithochoate C. difficile inhibition assays
Growth of C. difficile in Brain Heart Infusion (BHI) liquid media supplemented with yeast extract and cysteine, with added deoxycholate (DCA) (0.1%, 0.01%, 0.001%, final concentration, in water vehicle) or lithochoate (LCA) (0.01%, 0.001%, final concentration, in 100% ethanol vehicle), or vehicle alone was monitored by optical density (OD600) using a spectrophotometer.
Statistics
Statistical analyses were performed using the R (v. 3.0.2) and GraphPad Prism (v. 6.0c) software packages. The Mann-Whitney rank sum test (two-tailed) was used for comparisons of continuous variables between two groups with similar variances; the Kruskal-Wallis test with Dunn correction for multiple comparisons was used for comparisons of three groups or more (n≥5 samples per group) with similar variances. In all experiments involving group comparisons at least 6 animals were used per group; for these non-parametric tests, it was calculated that a sample size of 6 per group would be sufficient to detect an effect size of 2 with 90% power (alpha =0.05)40. Data were visualized using bar plots with center values representing the mean and error bars representing standard error of the mean, and box plots representing the median and interquartile range of the upper and lower quartiles and error bars showing the range. Spearman rank correlation tests (two-tailed) were used to find significant correlations between two continuous variables. Following statistical analyses with multiple comparisons we used the Benjamini-Hochberg method to control the false discovery rate. The log-rank test was used to find significant differences in the survival distributions among C. difficile-challenged groups of animals. When possible, investigators were blinded during group allocation and outcome assessment (16S and metagenomic shotgun sequence collection, extraction, quantification, and analysis; microbiota time-series inference modeling; quantification of bile species by enzymatic assay and HPLC-MS; enumeration of C. difficile in animal experiments).
Mouse microbiota time-series inference modeling
In order to determine the network of bacterial–bacteria interactions and extract native resident bacteria with C. difficile inhibitory properties, we applied the Lotka-Volterra dynamics-based framework of Stein et al.10 to the mouse dataset. This inference framework consist of a regularized least-square regression of the observed data points and the known antibiotic signal against the difference of the log-transformed total abundances in time, i.e. , where N is the total number of considered OTUs. This results in coefficients characterizing growth, oriented interactions and susceptibilities of each OTU to the external perturbations. The method requires temporal profiles of total abundances of each of the 36 representatives OTUs, which were obtained by scaling their normalized abundance from the pyrosequencing run (fraction ranging from 0 to 1) by the total amount of bacteria DNA recovered from each gram of stool or intestinal content. The temporal profile of the C. difficile total abundance was obtained from the CFU counts recovered by plating the cecal content after mouse sacrifice. The last time differences Δlnxi (tinoc), were calculated for each mouse as the difference between the total abundance in the intestinal content (feces) on the day after C. difficile inoculation, tinoc, (also day of mouse sacrifice) minus the total abundance in the content (fecss) prior to C. difficile infection or . Similarly the differential profile for C. difficile was evaluated from log-difference in the scaled colony counts for the corresponding fecal and cecal samples. Antibiotic perturbations (ampicillin, clindamycin or enrofloxacin) were modeled as a discrete signal when administered at day -2 (Fig. 1). The inference algorithm was run on a total of 240 samples and the global model was selected with a 3-fold cross-validation scheme on the 75 combined timecourses in order to ensure robustness to the introduction of unseen data10. In particular, the number of data points outnumbers the number of unknowns, i.e. the linear system to be solved is overdetermined, ensuring a sufficient number of constraints by the data for inferring the unknown coefficients.
Allo-HSCT patient microbiota time-series inference modeling
In order to determine if commensal-C. difficile interactions observed in the mouse data were conserved also in humans we applied the same inference-modeling framework to data from 24 Allo-HSTC hospitalized patients. As above, for each of the 36 OTUs, we determined the log-differential in total abundance as the log-difference of the normalized abundance scaled by the corresponding total bacterial DNA per gram of stool at the next sampling event minus the total abundance at the current sampling time. Differential abundance in C. difficile was determined from the qPCR measurements of the C. difficile 16S rRNA gene per gram of feces. Similarly to above, we ran the algorithm on a total of 112 samples and the global model was selected applying a 3-fold cross-validation scheme on the 24 combined timecourses. This choice again yields an overdetermined linear system to be solved.
Extended Data
Extended Data Figure 1. Dynamics of intestinal microbiota structure and C. difficile susceptibility following antibiotic exposure.
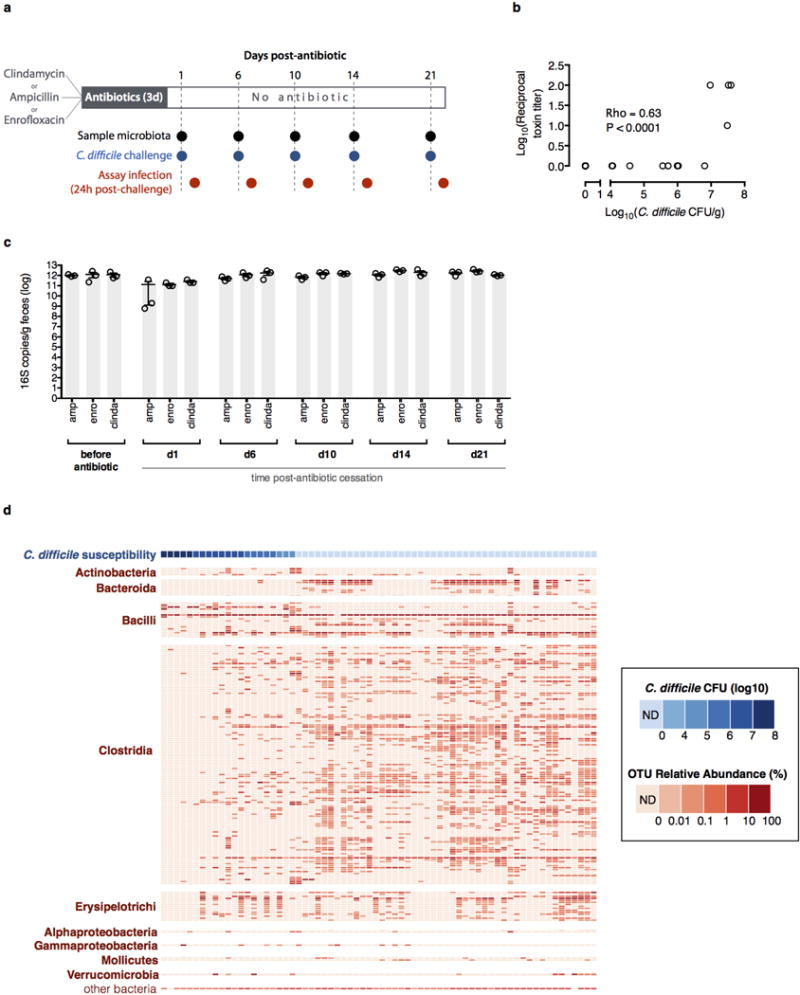
Strategy for determining C. difficile susceptibility duration post-antibiotic exposure (n=3 separately-housed mouse colonies per antibiotic arm) and relating infection resistance to microbiota structure (a). Intestinal bacterial density of animals before and after antibiotic exposure (b). Results were representative of two independent experiments. Center values (mean), error bars (s.e.m.) (b). Relative abundance of bacterial OTUs (≥97% sequence identity, >0.01% relative abundance) sorted by class (red) and corresponding C. difficile susceptibility (blue) among antibiotic-exposed mice (n=68) allowed to recover for variable time intervals prior to C. difficile infection challenge (c). Results were representative of two independent experiments. ND (not detectable).
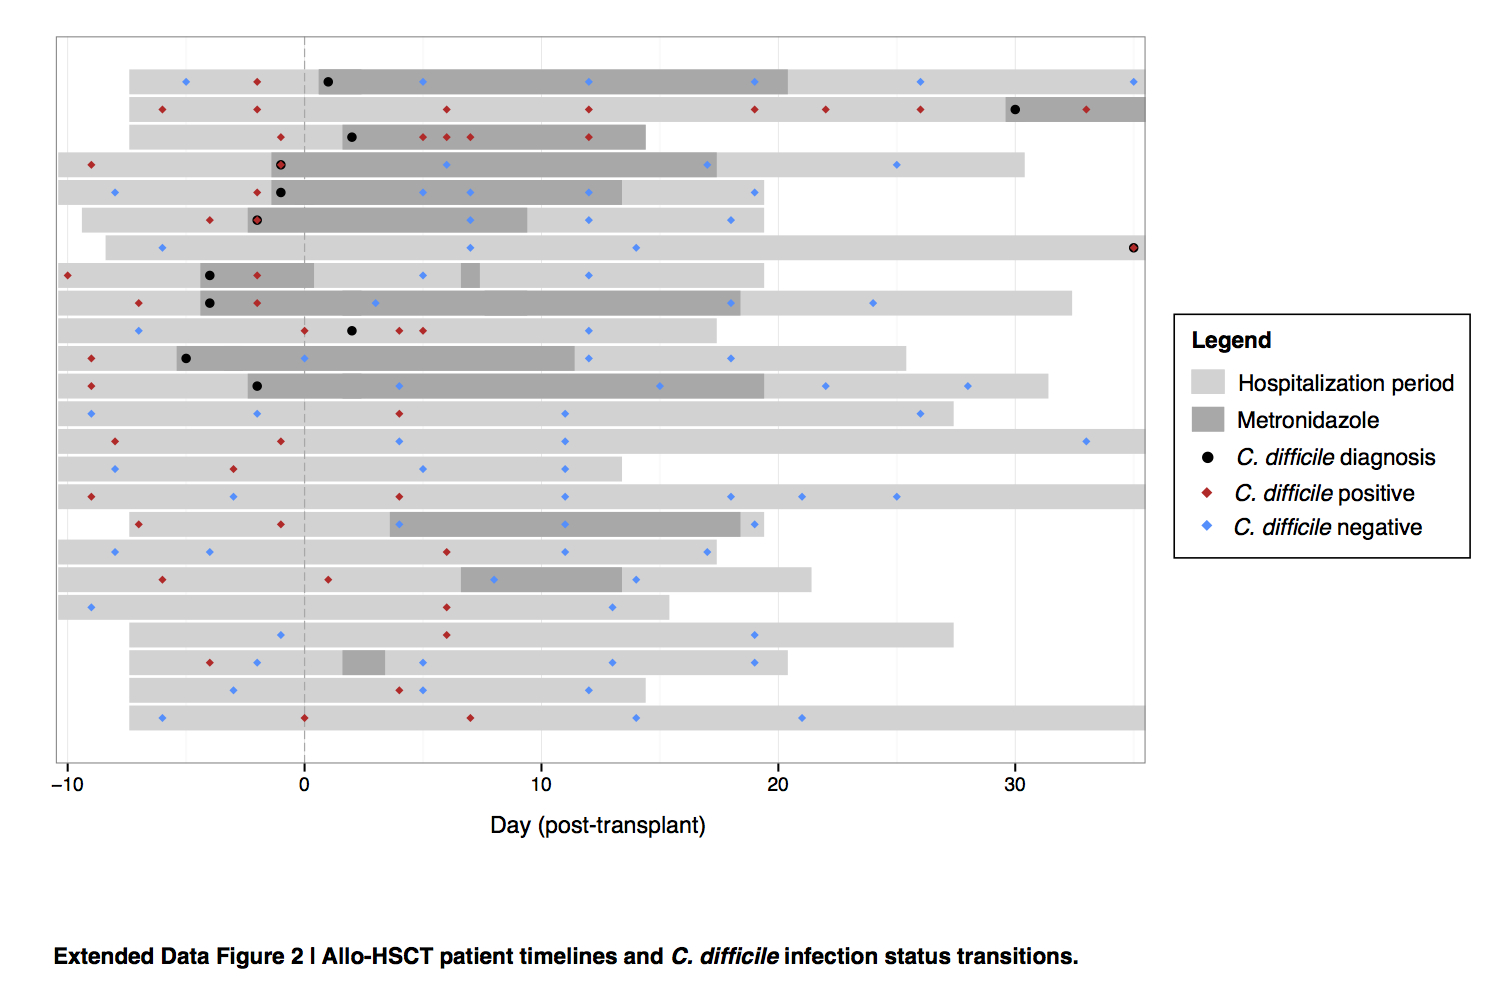
Extended Data Figure 2. Allo-HSCT patient timelines and C. difficile infection status transitions.
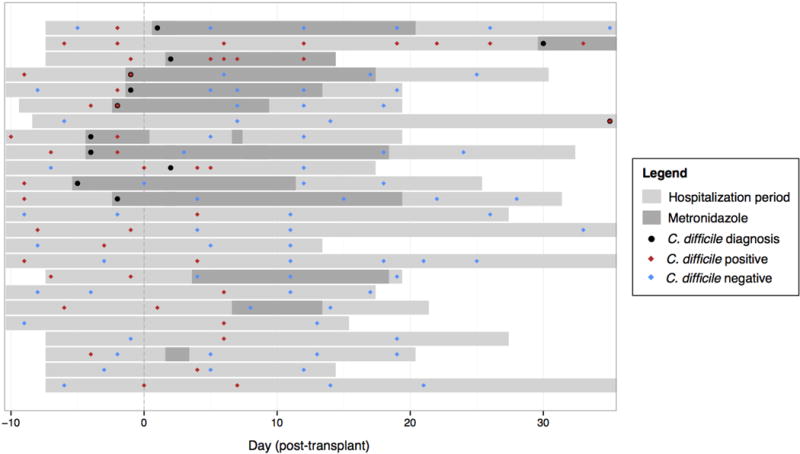
Transitions between C. difficile (tcdB-positive) colonization status in patients receiving allogeneic hematopoietic stem cell transplantation, as measured by C. difficile 16S rRNA abundance during the period of hospitalization (light gray bars). Timepoints when C. difficile colonization was determined to be positive (red diamonds) and negative (blue diamonds), and when C. difficile infection was clinically diagnosed (black dots) and metronidazole was administered (dark gray bars), are displayed relative to the time of transplant per patient.
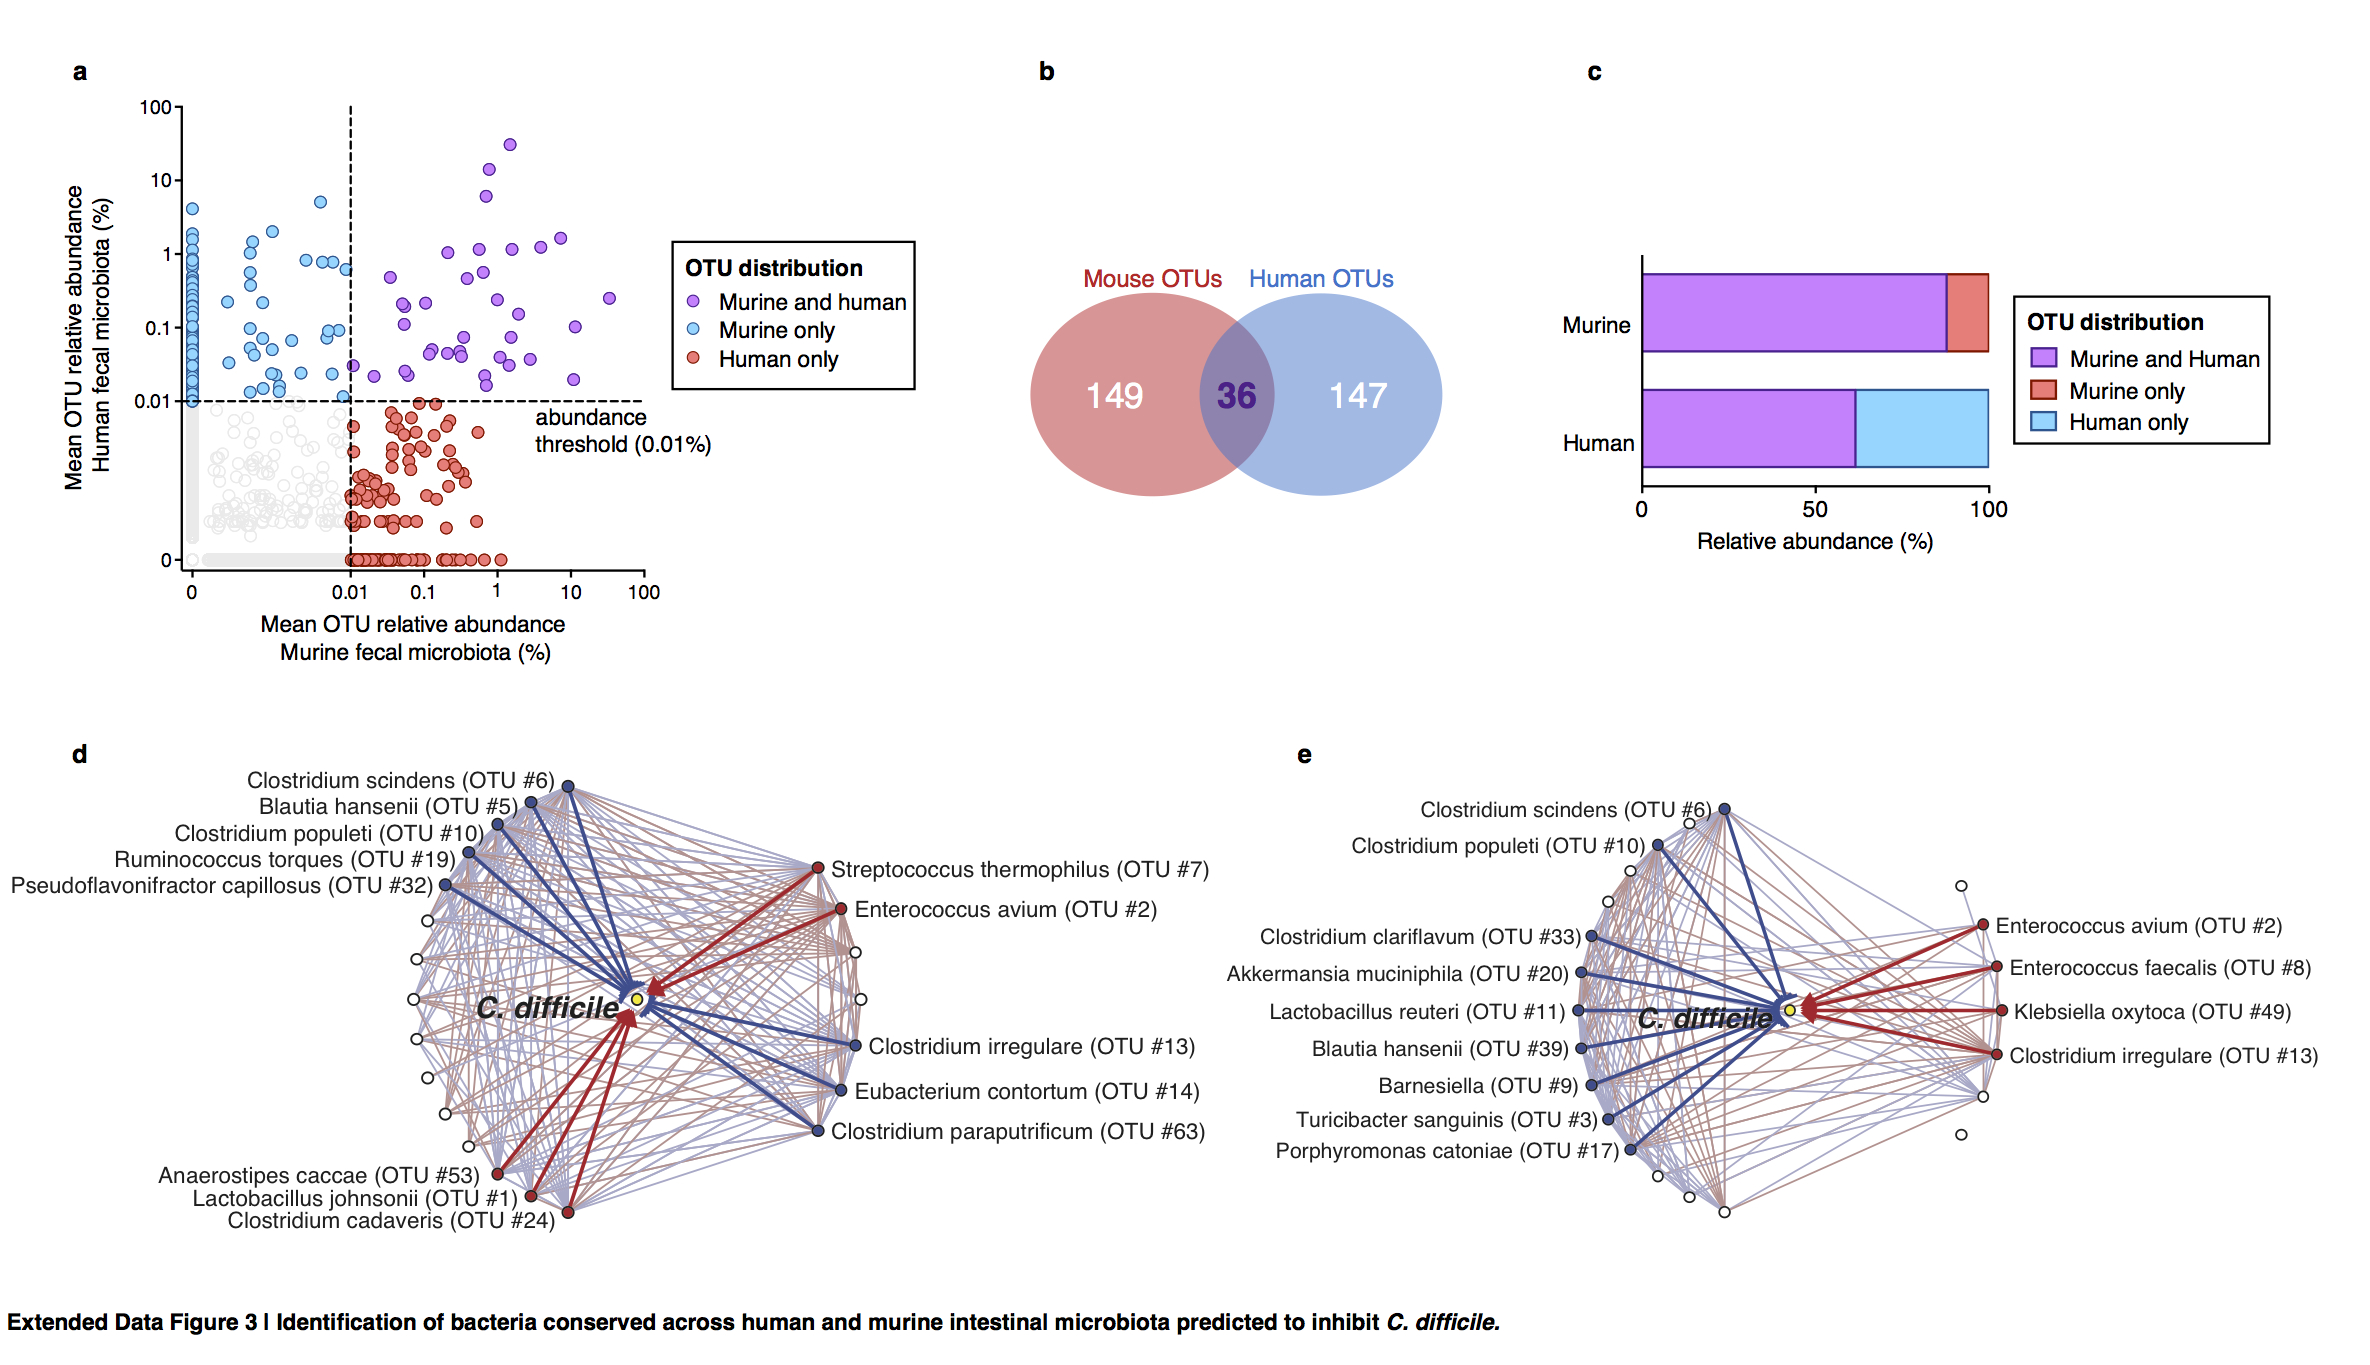
Extended Data Figure 3. Identification of bacteria conserved across human and murine intestinal microbiota predicted to inhibit C. difficile.
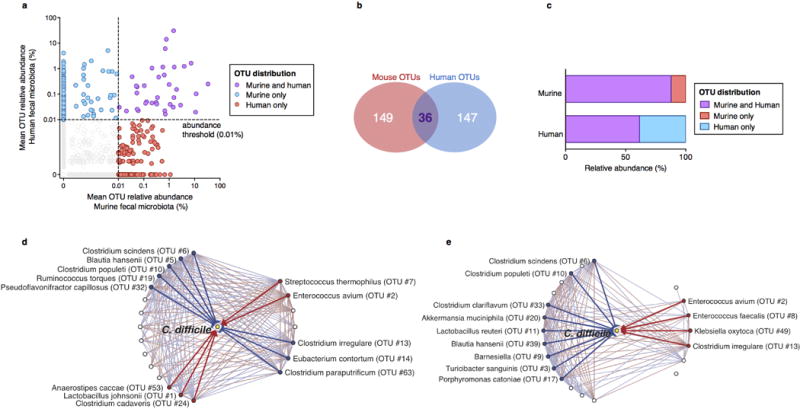
Identification of bacterial OTUs abundant in mice (n=68) and humans (n=24) (a) that account for a minority of OTU membership (b) but the majority of the structure of the intestinal microbiota of both host species following antibiotic exposure (b). Subnetworks of abundant OTUs predicted inhibit (blue) or positively associate with (red) C. difficile in murine (c) and human (d) intestinal microbiota.
Extended Data Figure 4. Phylogenetic distribution of resistance-associated intestinal bacteria and isolates selected for adoptive transfer.
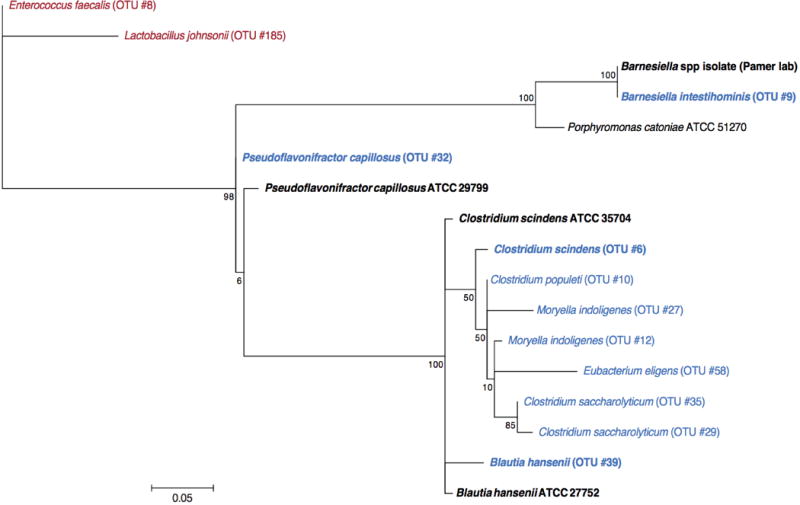
The maximum likelihood phylogenetic tree (Kimura model, bootstrap of 100 replicates) was constructed using the MEGA 6.06 package from representative sequences of intestinal bacteria associated with resistance to C. difficile infection (blue), including cultured representatives subsequently used in adoptive transfer experiments (bold). The tree was rooted using intestinal bacteria associated with susceptibility to infection (red) as an out-group.
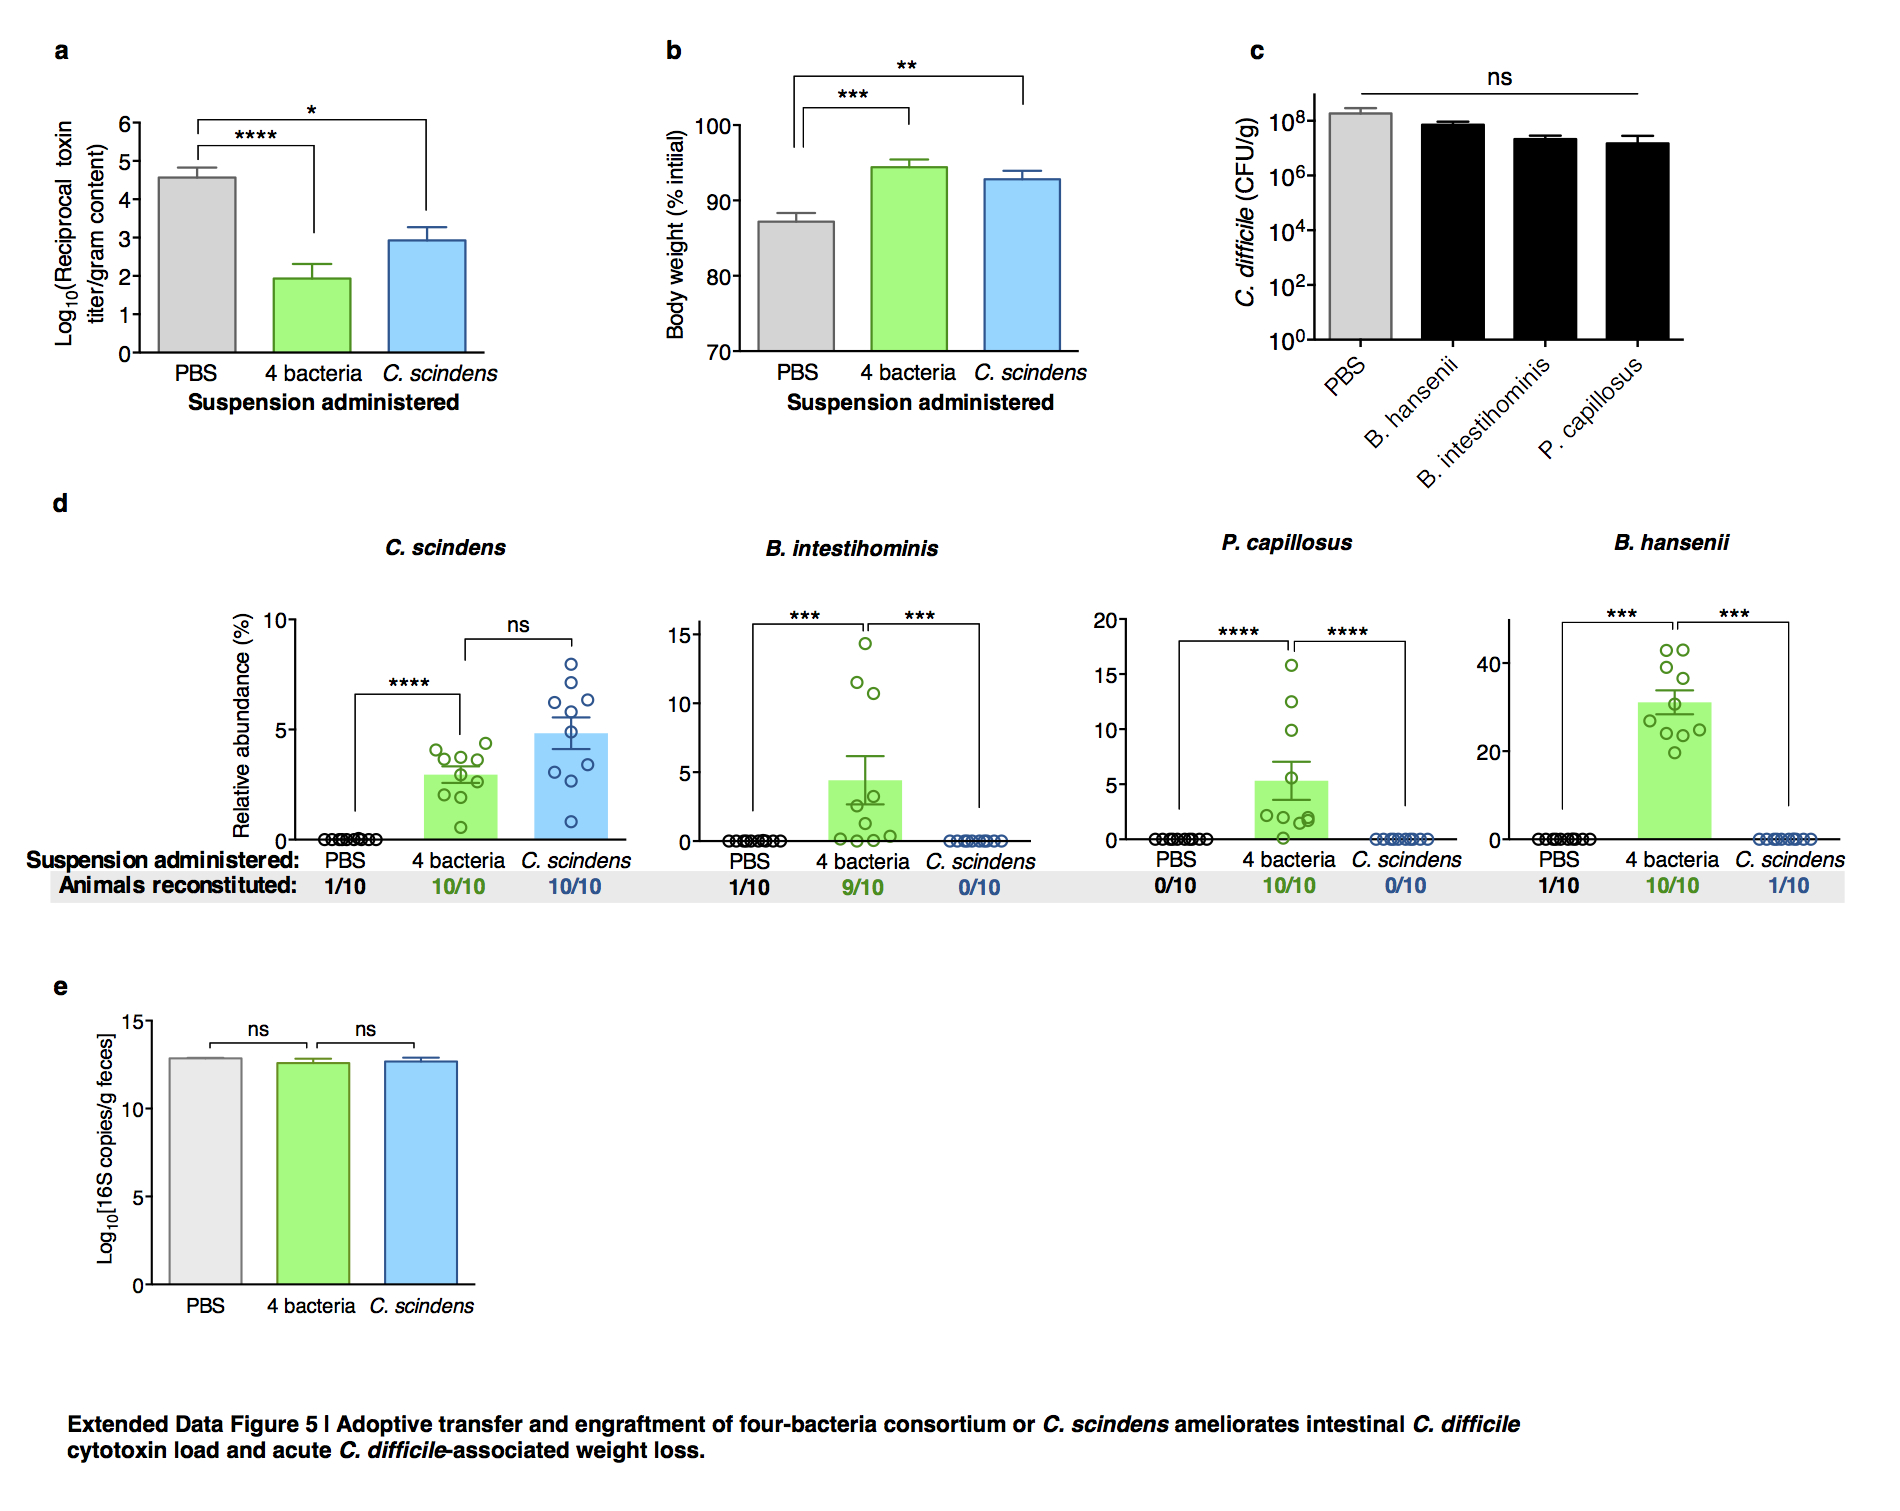
Extended Data Figure 5. Adoptive transfer and engraftment of four-bacteria consortium or C. scindens ameliorates intestinal C. difficile cytotoxin load and acute C. difficile-associated weight loss.
C. difficile toxin load in antibiotic-exposed animals receiving adoptive transfers 24 hours after C. difficile infection challenge (a). Animals weights 48 hours after infection challenge (b) and C. difficile CFU 24 hours after infection challenge (c). Engraftment of bacterial isolates in the intestinal microbiota of antibiotic-exposed animals two days following adoptive transfer of B. intestihominis, P. capillosus, B. hansenii, and/or C. scindens (d). Intestinal bacterial density (feces) from antibiotic-exposed mice administered suspensions containing 4 bacteria, C. scindens, or vehicle (PBS) as measured by quantitative RT-PCR of 16S rRNA genes (e). ****P<0.0001, ***P<0.001, **P<0.01, *P<0.05; Mann-Whitney (two-tailed) (a,b,d,e), Kruskal-Wallis with Dunn correction (c) (n=6–10 per group). Center values (mean), error bars (s.e.m.). Results were representative of at least two independent experiments. Numbers under group columns in (a) denote the number of mice with detectable engraftment of the given bacterium (out of 10 possible separately-housed animals per group) (d).
Extended Data Figure 6. Adoptive transfer of consortia or C. scindens restores baiCD and secondary bile acid biosynthesis gene family abundance.
PCR-based detection of the 7α-HSDH-encoding baiCD gene in bacterial isolates, intestinal microbiomes (feces) of animals prior to antibiotic exposure, and intestinal microbiomes (feces) of animals that, following antibiotic exposure, remained C. difficile-susceptible or recovered resistance to infection spontaneously or following adoptive transfer of bacterial isolates (a). Reconstituted abundance of the secondary bile acid biosynthesis gene family, as predicted by PICRUSt, in antibiotic-exposed animals receiving adoptive transfers (n=10 per group) (b). ***P<0.001, *P<0.05, ns (not significant); Mann-Whitney (two-tailed) (b). Center values (mean), error bars (s.e.m.).
Extended Data Figure 7. Impacts of bacteria adoptive transfers on intestinal abundance of bile acids.
Intestinal abundance of the secondary bile acids lithochoate (LCA) (a), ursodeoxycholate (UDCA) (b), and primary bile acids (c-f) in mice following antibiotic exposure and adoptive transfer of bacteria indicated. ****P<0.0001, *P<0.05, ns (not significant), Kruskal-Wallis test with Dunn’s correction. Center values (mean), error bars (s.e.m.).
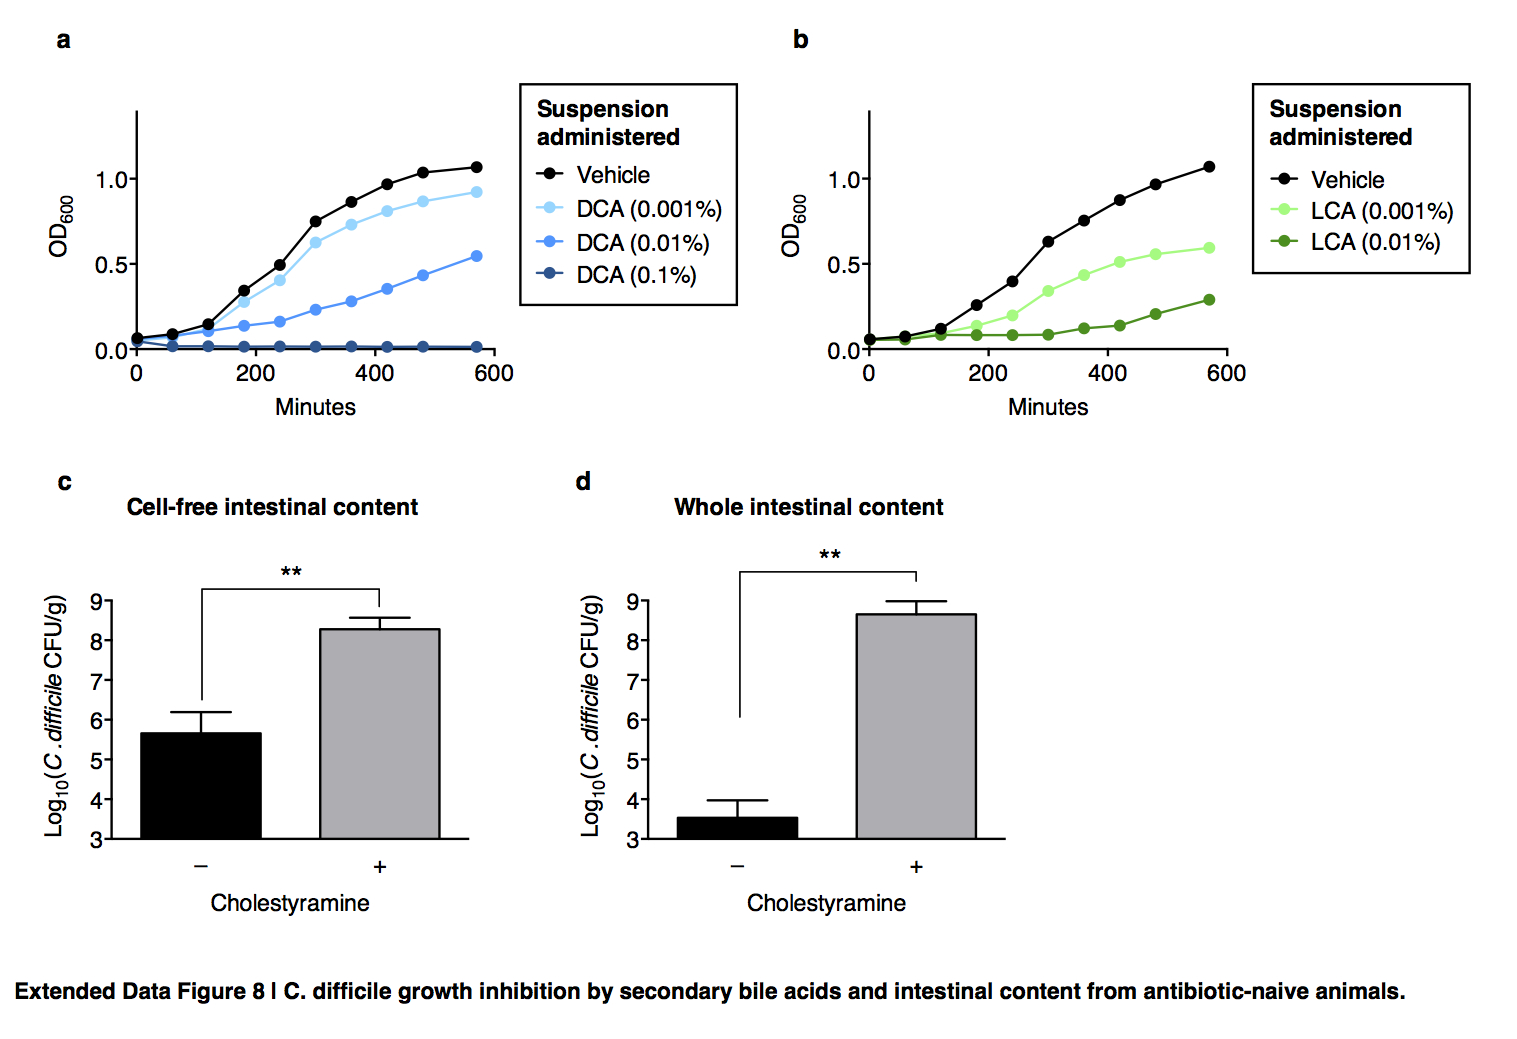
Extended Data Figure 8. C. difficile growth inhibition by secondary bile acids and intestinal content from antibiotic-naive animals.
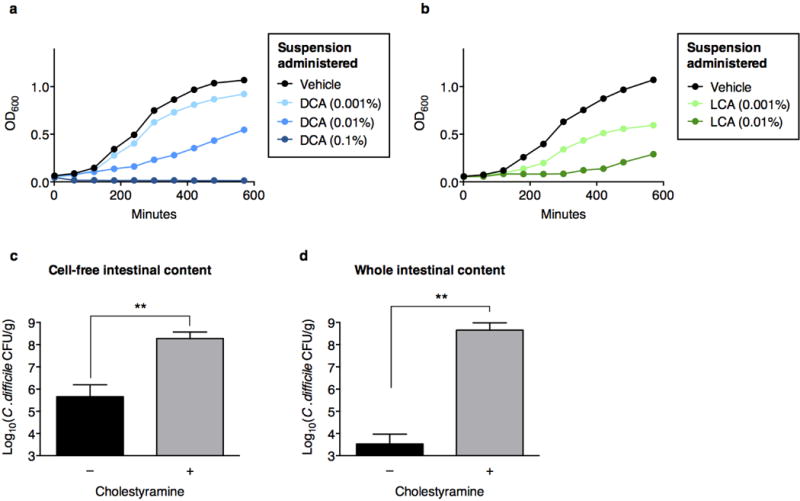
Addition of the secondary bile acids deoxycholate (DCA) (a) or lithochoate (LCA) (b) to culture media inhibits C. difficile. Bile acid-dependent inhibition of C. difficile enumerated by recovery of CFU after inoculation of vegetative C. difficile into cell-free (c) or whole (d) intestinal content harvested from C57BL/6J mice (n=5–6 per group), with or without pre-incubation with cholestyramine. **P<0.01, Mann-Whitney (two-tailed) (c,d).
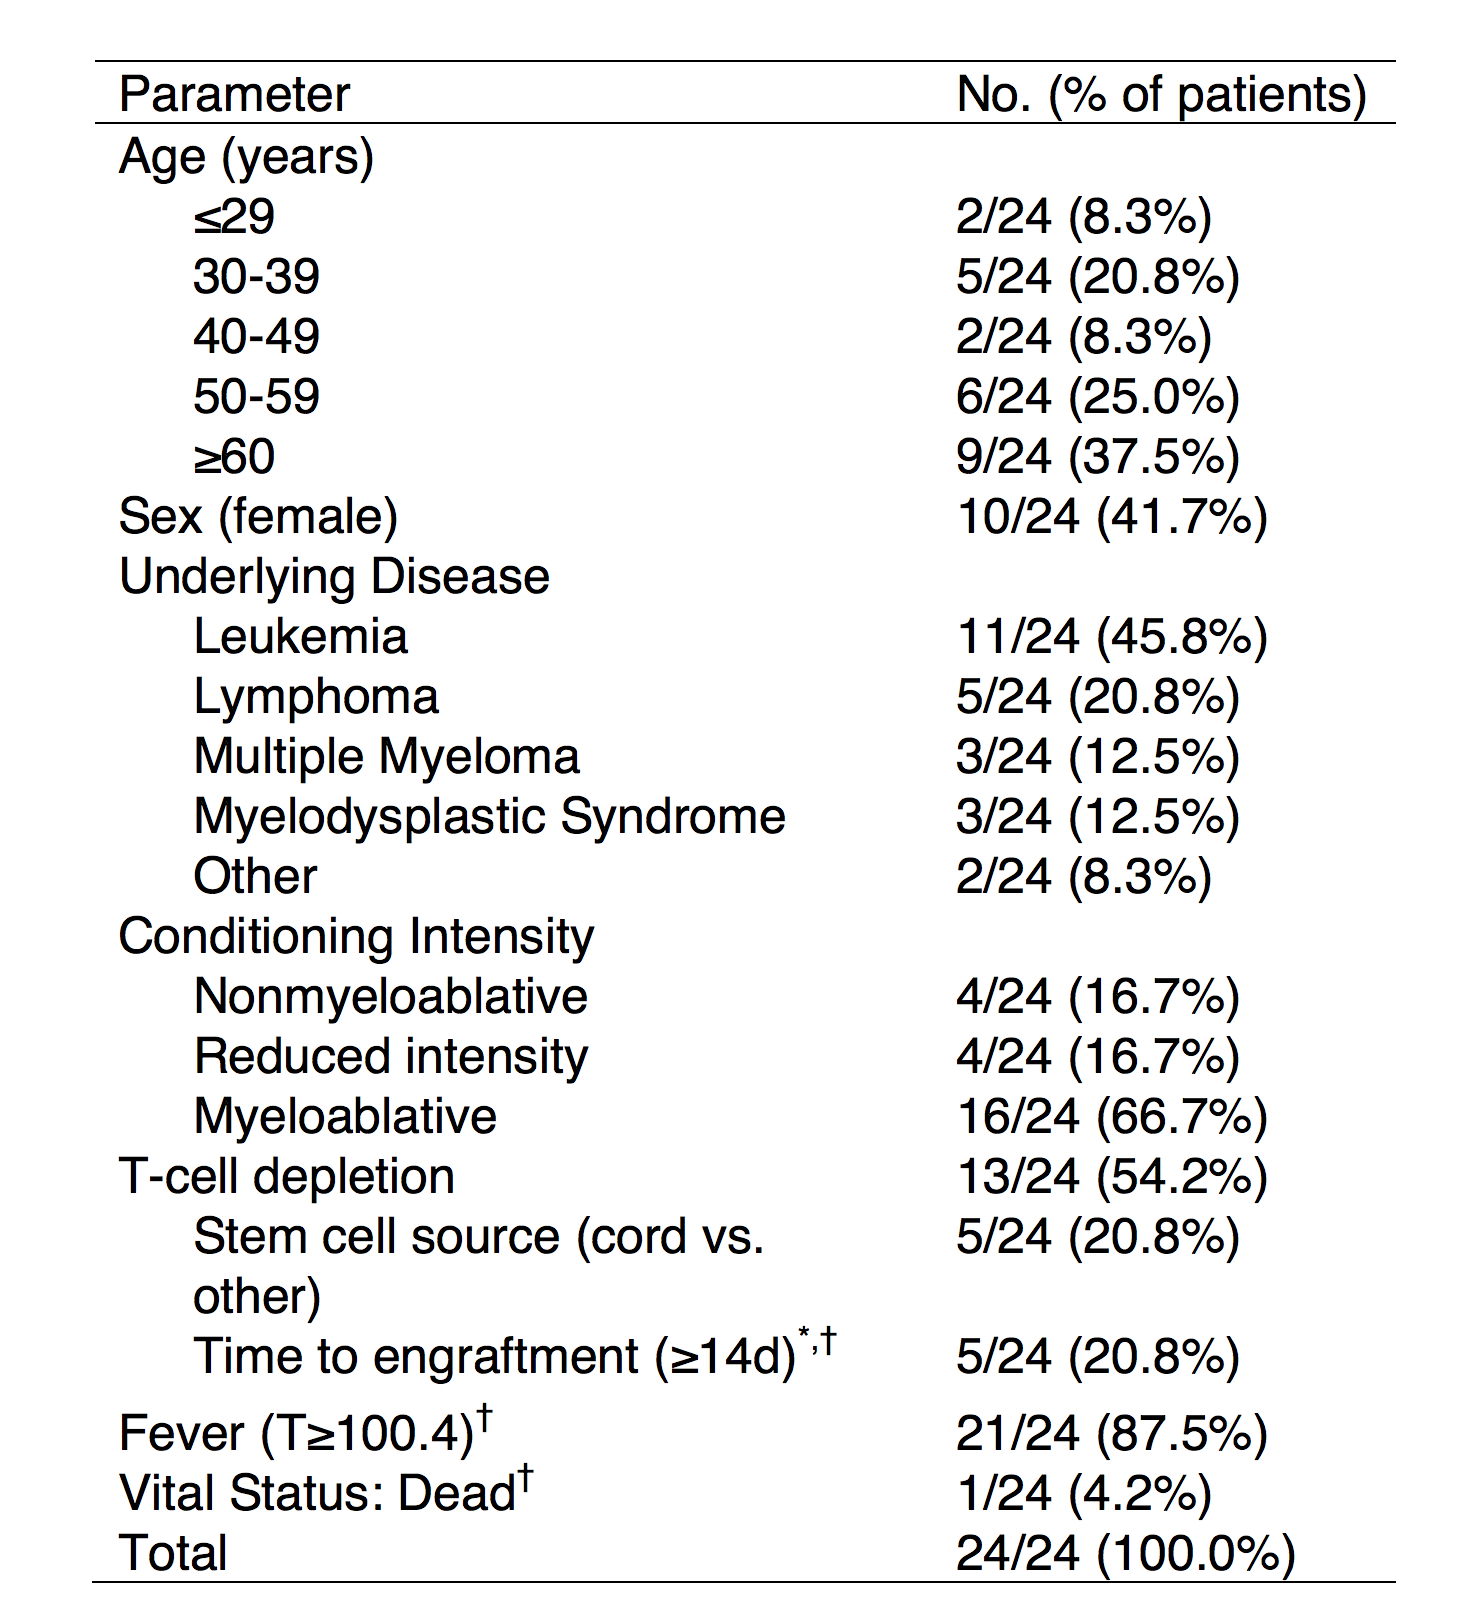
Extended Data Table 1.
Characteristics of patients and transplant course.
| Parameter | No. (% of patients) |
|---|---|
| Age (years) | |
| ≤29 | 2/24 (8.3%) |
| 30–39 | 5/24 (20.8%) |
| 40–49 | 2/24 (8.3%) |
| 50–59 | 6/24 (25.0%) |
| ≥60 | 9/24 (37.5%) |
| Sex (female) | 10/24 (41.7%) |
| Underlying Disease | |
| Leukemia | 11/24 (45.8%) |
| Lymphoma | 5/24 (20.8%) |
| Multiple Myeloma | 3/24 (12.5%) |
| Myelodysplastic Syndrome | 3/24 (12.5%) |
| Other | 2/24 (8.3%) |
| Conditioning Intensity | |
| Nonmyeloablative | 4/24 (16.7%) |
| Reduced intensity | 4/24 (16.7%) |
| Myeloablative | 16/24 (66.7%) |
| T-call depletion | 13/24 (54.2%) |
| Stem cell source (cord vs. other) | 5/24 (20.8%) |
| Time to engraftment (≥l4d)a,b | 5/24 (20.8%) |
| Fever (T≥100.4)b | 21/24 (87.5%) |
| Vital Status: Deadb | 1/24 (4.2%) |
| Total | 24/24 (100.0%) |
Engraftment was defined as an absolute neutrophil count of >500 cells/μL for 3 consecutive days.
Assessed during inpatient allogeneic hematopoietic stem cell transplantation hospitalization (from 15 days before transplant to 35 days after transplant).
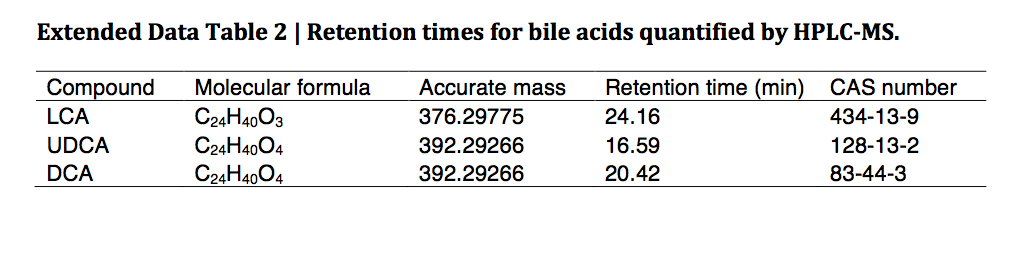
Extended Data Table 2.
Retention times for bile acids quantified by HPLC-MS.
| Compound | Molecular formula | Accurate mass | Retention time (min) | CAS number |
|---|---|---|---|---|
| LCA | C24H40O3 | 376.29775 | 24.16 | 434–13–9 |
| UDCA | C24H40O4 | 392.29266 | 16.59 | 128–13–2 |
| DCA | C24H40O4 | 392.29266 | 20.42 | 83–44–3 |
Supplementary Material
Acknowledgments
E.G.P. receives funding from US National Institutes of Health (NIH) grants RO1 AI42135 and AI95706, and from the Tow Foundation. C.G.B. was supported by a Medical Scientist Training Program grant from the National Institute of General Medical Sciences of the NIH (award number T32GM07739, awarded to the Weill Cornell/Rockefeller/Sloan-Kettering Tri-Institutional MD-PhD Program).
Footnotes
Author Contributions
C.G.B. and E.G.P. designed the experiments and wrote the manuscript with input from co-authors. C.G.B. performed animal experiments and most analyses. V.B., R.R.S., J.B.X., C.S. and C.G.B. performed microbiota time-series inference modeling and analysis. P.T.M. and C.G.B designed and performed ex vivo experiments. L.L., A.G., A.V. D.N., and M.K. performed 16S amplicon quantitation and multiparallel sequencing (454, MiSeq) and contributed to data analysis. M.R.M.vDB., R.R.J., Y.T., E.L., C.G.B., and E.G.P. assessed clinical parameters and supervised patient cohort analysis. N.C.T. and C.G.B. performed metagenomic shotgun sequencing analysis. J.C. and H.L. developed the metabolomics analysis platform and performed bile acid species quantitation.
Author Information
Study sequence data are deposited in NCBI Sequence Read Archive ID SRP045811.
References
- 1.Buffie CG, Pamer EG. Microbiota-mediated colonization resistance against intestinal pathogens. Nat Rev Immunol. 2013;13:790–801. doi: 10.1038/nri3535. [DOI] [PMC free article] [PubMed] [Google Scholar]
- 2.Buffie CG, Jarchum I, Equinda M, Lipuma L, et al. Profound alterations of intestinal microbiota following a single dose of clindamycin results in sustained susceptibility to Clostridium difficile-induced colitis. Infect Immun. 2012;80:62–73. doi: 10.1128/IAI.05496-11. [DOI] [PMC free article] [PubMed] [Google Scholar]
- 3.Rupnik M, Wilcox MH, Gerding DN. Clostridium difficile infection: new developments in epidemiology and pathogenesis. Nat Rev Microbiol. 2009;7:526–536. doi: 10.1038/nrmicro2164. [DOI] [PubMed] [Google Scholar]
- 4.van Nood E, Vrieze A, Nieuwdorp M, Fuentes S, et al. Duodenal infusion of donor feces for recurrent Clostridium difficile. N Engl J Med. 2013;368:407–415. doi: 10.1056/NEJMoa1205037. [DOI] [PubMed] [Google Scholar]
- 5.Cimermancic P, Medema MH, Claesen J, Kurita K, et al. Insights into secondary metabolism from a global analysis of prokaryotic biosynthetic gene clusters. Cell. 2014;158:412–421. doi: 10.1016/j.cell.2014.06.034. [DOI] [PMC free article] [PubMed] [Google Scholar]
- 6.Chang JY, Antonopoulos DA, Kalra A, Tonelli A, et al. Decreased diversity of the fecal Microbiome in recurrent Clostridium difficile-associated diarrhea. J Infect Dis. 2008;197:435–438. doi: 10.1086/525047. [DOI] [PubMed] [Google Scholar]
- 7.Lozupone C, Knight R. UniFrac: a new phylogenetic method for comparing microbial communities. Appl Environ Microbiol. 2005;71:8228–8235. doi: 10.1128/AEM.71.12.8228-8235.2005. [DOI] [PMC free article] [PubMed] [Google Scholar]
- 8.Taur Y, Xavier JB, Lipuma L, Ubeda C, et al. Intestinal domination and the risk of bacteremia in patients undergoing allogeneic hematopoietic stem cell transplantation. Clin Infect Dis. 2012;55:905–914. doi: 10.1093/cid/cis580. [DOI] [PMC free article] [PubMed] [Google Scholar]
- 9.Kinnebrew MA, Lee YJ, Jenq RR, Lipuma L, et al. Early Clostridium difficile Infection during Allogeneic Hematopoietic Stem Cell Transplantation. PLoS One. 2014;9:e90158. doi: 10.1371/journal.pone.0090158. [DOI] [PMC free article] [PubMed] [Google Scholar]
- 10.Stein RR, Bucci V, Toussaint NC, Buffie CG, et al. Ecological modeling from time-series inference: insight into dynamics and stability of intestinal microbiota. PLoS Comput Biol. 2013;9:e1003388. doi: 10.1371/journal.pcbi.1003388. [DOI] [PMC free article] [PubMed] [Google Scholar]
- 11.Wilson KH. Efficiency of various bile salt preparations for stimulation of Clostridium difficile spore germination. J Clin Microbiol. 1983;18:1017–1019. doi: 10.1128/jcm.18.4.1017-1019.1983. [DOI] [PMC free article] [PubMed] [Google Scholar]
- 12.Sorg JA, Sonenshein AL. Bile salts and glycine as cogerminants for Clostridium difficile spores. J Bacteriol. 2008;190:2505–2512. doi: 10.1128/JB.01765-07. [DOI] [PMC free article] [PubMed] [Google Scholar]
- 13.Kang DJ, Ridlon JM, Moore DR, Barnes S, Hylemon PB. Clostridium scindens baiCD and baiH genes encode stereo-specific 7alpha/7beta-hydroxy-3-oxo-delta4-cholenoic acid oxidoreductases. Biochim Biophys Acta. 2008;1781:16–25. doi: 10.1016/j.bbalip.2007.10.008. [DOI] [PMC free article] [PubMed] [Google Scholar]
- 14.Ridlon JM, Kang DJ, Hylemon PB. Bile salt biotransformations by human intestinal bacteria. J Lipid Res. 2006;47:241–259. doi: 10.1194/jlr.R500013-JLR200. [DOI] [PubMed] [Google Scholar]
- 15.Langille MG, Zaneveld J, Caporaso JG, McDonald D, et al. Predictive functional profiling of microbial communities using 16S rRNA marker gene sequences. Nat Biotechnol. 2013;31:814–821. doi: 10.1038/nbt.2676. [DOI] [PMC free article] [PubMed] [Google Scholar]
- 16.Out C, Groen AK, Brufau G. Bile acid sequestrants: more than simple resins. Curr Opin Lipidol. 2012;23:43–55. doi: 10.1097/MOL.0b013e32834f0ef3. [DOI] [PubMed] [Google Scholar]
- 17.Collins MD, Lawson PA, Willems A, Cordoba JJ, et al. The phylogeny of the genus Clostridium: proposal of five new genera and eleven new species combinations. Int J Syst Bacteriol. 1994;44:812–826. doi: 10.1099/00207713-44-4-812. [DOI] [PubMed] [Google Scholar]
- 18.Yutin N, Galperin MY. A genomic update on clostridial phylogeny: Gram-negative spore formers and other misplaced clostridia. Environ Microbiol. 2013;15:2631–2641. doi: 10.1111/1462-2920.12173. [DOI] [PMC free article] [PubMed] [Google Scholar]
- 19.Kitahara M, Takamine F, Imamura T, Benno Y. Assignment of Eubacterium sp. VPI 12708 and related strains with high bile acid 7alpha-dehydroxylating activity to Clostridium scindens and proposal of Clostridium hylemonae sp. nov., isolated from human faeces. Int J Syst Evol Microbiol. 2000;50(Pt 3):971–978. doi: 10.1099/00207713-50-3-971. [DOI] [PubMed] [Google Scholar]
- 20.Wells E, Hylemon B. Identification Characterization of a Bile Acid 7alpha-Dehydroxylation Operon in Clostridium sp. Strain TO-931, a Highly Active 7alpha-Dehydroxylating Strain Isolated from Human Feces. Applied and Environmental Microbiology. 2000;66:1107–1113. doi: 10.1128/aem.66.3.1107-1113.2000. [DOI] [PMC free article] [PubMed] [Google Scholar]
- 21.Weingarden AR, Chen C, Bobr A, Yao D, et al. Microbiota transplantation restores normal fecal bile acid composition in recurrent Clostridium difficile infection. Am J Physiol Gastrointest Liver Physiol. 2014;306:G310–G319. doi: 10.1152/ajpgi.00282.2013. [DOI] [PMC free article] [PubMed] [Google Scholar]
- 22.Bernstein H, Bernstein C, Payne CM, Dvorakova K, Garewal H. Bile acids as carcinogens in human gastrointestinal cancers. Mutat Res. 2005;589:47–65. doi: 10.1016/j.mrrev.2004.08.001. [DOI] [PubMed] [Google Scholar]
- 23.Ng KM, Ferreyra JA, Higginbottom SK, Lynch JB, et al. Microbiota-liberated host sugars facilitate post-antibiotic expansion of enteric pathogens. Nature. 2013;502:96–99. doi: 10.1038/nature12503. [DOI] [PMC free article] [PubMed] [Google Scholar]
- 24.Jarchum I, Liu M, Shi C, Equinda M, Pamer EG. Critical role for MyD88-mediated neutrophil recruitment during Clostridium difficile colitis. Infect Immun. 2012;80:2989–2996. doi: 10.1128/IAI.00448-12. [DOI] [PMC free article] [PubMed] [Google Scholar]
- 25.Jarchum I, Liu M, Lipuma L, Pamer EG. Toll-like receptor 5 stimulation protects mice from acute Clostridium difficile colitis. Infect Immun. 2011;79:1498–1503. doi: 10.1128/IAI.01196-10. [DOI] [PMC free article] [PubMed] [Google Scholar]
- 26.Rea MC, Sit CS, Clayton E, O’Connor PM, et al. Thuricin CD, a posttranslationally modified bacteriocin with a narrow spectrum of activity against Clostridium difficile. Proc Natl Acad Sci U S A. 2010;107:9352–9357. doi: 10.1073/pnas.0913554107. [DOI] [PMC free article] [PubMed] [Google Scholar]
Supplementary references (Methods)
- 27.Chen X, Katchar K, Goldsmith JD, Nanthakumar N, et al. A mouse model of Clostridium difficile-associated disease. Gastroenterology. 2008;135:1984–1992. doi: 10.1053/j.gastro.2008.09.002. [DOI] [PubMed] [Google Scholar]
- 28.Giel JL, Sorg JA, Sonenshein AL, Zhu J. Metabolism of bile salts in mice influences spore germination in Clostridium difficile. PLoS One. 2010;5:e8740. doi: 10.1371/journal.pone.0008740. [DOI] [PMC free article] [PubMed] [Google Scholar]
- 29.Ubeda C, Taur Y, Jenq RR, Equinda MJ, et al. Vancomycin-resistant Enterococcus domination of intestinal microbiota is enabled by antibiotic treatment in mice and precedes bloodstream invasion in humans. J Clin Invest. 2010;120:4332–4341. doi: 10.1172/JCI43918. [DOI] [PMC free article] [PubMed] [Google Scholar]
- 30.Wells JE, Williams KB, Whitehead TR, Heuman DM, Hylemon PB. Development and application of a polymerase chain reaction assay for the detection and enumeration of bile acid 7α-dehydroxylating bacteria in human feces. Clinica Chimica Acta. 2003;331:127–134. doi: 10.1016/s0009-8981(03)00115-3. [DOI] [PubMed] [Google Scholar]
- 31.Caporaso JG, Lauber CL, Walters WA, Berg-Lyons D, et al. Ultra-high-throughput microbial community analysis on the Illumina HiSeq and MiSeq platforms. ISME J. 2012;6:1621–1624. doi: 10.1038/ismej.2012.8. [DOI] [PMC free article] [PubMed] [Google Scholar]
- 32.Ubeda C, Bucci V, Caballero S, Djukovic A, et al. Intestinal microbiota containing Barnesiella cures vancomycin-resistant Enterococcus faecium colonization. Infect Immun. 2013;81:965–973. doi: 10.1128/IAI.01197-12. [DOI] [PMC free article] [PubMed] [Google Scholar]
- 33.Schloss PD, Westcott SL, Ryabin T, Hall JR, et al. Introducing mothur: open-source, platform-independent, community-supported software for describing and comparing microbial communities. Appl Environ Microbiol. 2009;75:7537–7541. doi: 10.1128/AEM.01541-09. [DOI] [PMC free article] [PubMed] [Google Scholar]
- 34.Edgar RC, Haas BJ, Clemente JC, Quince C, Knight R. UCHIME improves sensitivity and speed of chimera detection. Bioinformatics. 2011;27:2194–2200. doi: 10.1093/bioinformatics/btr381. [DOI] [PMC free article] [PubMed] [Google Scholar]
- 35.Sheneman L, Evans J, Foster JA. Clearcut: a fast implementation of relaxed neighbor joining. Bioinformatics. 2006;22:2823–2824. doi: 10.1093/bioinformatics/btl478. [DOI] [PubMed] [Google Scholar]
- 36.Caporaso JG, Kuczynski J, Stombaugh J, Bittinger K, et al. QIIME allows analysis of high-throughput community sequencing data. Nat Methods. 2010;7:335–336. doi: 10.1038/nmeth.f.303. [DOI] [PMC free article] [PubMed] [Google Scholar]
- 37.Hall BG. Building phylogenetic trees from molecular data with MEGA. Mol Biol Evol. 2013;30:1229–1235. doi: 10.1093/molbev/mst012. [DOI] [PubMed] [Google Scholar]
- 38.Human Microbiome Project Consortium Structure, function and diversity of the healthy human microbiome. Nature. 2012;486:207–214. doi: 10.1038/nature11234. [DOI] [PMC free article] [PubMed] [Google Scholar]
- 39.Zhao Y, Tang H, Ye Y. RAPSearch2: a fast and memory-efficient protein similarity search tool for next-generation sequencing data. Bioinformatics. 2012;28:125–126. doi: 10.1093/bioinformatics/btr595. [DOI] [PMC free article] [PubMed] [Google Scholar]
- 40.Cohen J. Statistical power analysis for the behavioral sciences. Routledge; Hillsdale, NJ: 1988. [Google Scholar]
Associated Data
This section collects any data citations, data availability statements, or supplementary materials included in this article.