

Abstract
Objective
Leptin acts via its receptor (LepRb) on multiple subpopulations of LepRb neurons in the brain, each of which controls specific aspects of energy balance. Despite the importance of LepRb-containing neurons, the transcriptome and molecular identity of many LepRb subpopulations remain undefined due to the difficulty of studying the small fraction of total cells represented by LepRb neurons in heterogeneous brain regions. Here we sought to examine the transcriptome of LepRb neurons directly and identify markers for functionally relevant LepRb subsets.
Methods
We isolated mRNA from mouse hypothalamic and brainstem LepRb cells by Translating Ribosome Affinity Purification (TRAP) and analyzed it by RNA-seq (TRAP-seq).
Results
TRAP mRNA from LepRb cells was enriched for markers of peptidergic neurons, while TRAP-depleted mRNA from non-LepRb cells was enriched for markers of glial and immune cells. Genes encoding secreted proteins that were enriched in hypothalamic and brainstem TRAP mRNA revealed subpopulations of LepRb neurons that contained neuropeptide-encoding genes (including prodynorphin, Pdyn) not previously used as functional markers for LepRb neurons. Furthermore, Pdyncre-mediated ablation of Leprflox in Pdyn-expressing neurons (LepRbPdynKO mice) blunted energy expenditure to promote obesity during high-fat feeding.
Conclusions
TRAP-seq of CNS LepRb neurons defines the LepRb neuron transcriptome and reveals novel markers for previously unrecognized subpopulations of LepRb neurons.
Keywords: Leptin, Hypothalamus, Brainstem, Neuropeptides, Dynorphin
1. Introduction
1.1. Leptin
The hormone leptin, which is produced by adipocytes to signal the repletion of fat stores, acts via the leptin receptor (LepRb) to modulate food intake and energy expenditure [1–3]. Leptin action is also crucial for the control of glucose homeostasis and other metabolic parameters [4,5]. Moreover, leptin controls energy balance and metabolism by acting on LepRb expressing neurons in the central nervous system [6–9]. Given the centrality of leptin action to the control of body weight and metabolism, it is crucial to understand mechanisms of leptin action, including the roles for each set of LepRb neurons, since these represent points of potential therapeutic intervention.
1.2. LepRb neurons
Anatomically and molecularly distinct subpopulations of LepRb neurons each play specific roles in leptin action [10]. Although hypothalamic LepRb populations have historically been the best characterized, the brainstem also contains several substantial populations of LepRb neurons, including populations in the ventral tegmental area (VTA), dorsal and linear raphe nuclei (DR, LR), Edinger-Westphal nucleus (EW), periaqueductal gray matter (PAG), parabrachial nucleus (PBN), and nucleus of the solitary tract (NTS) [11–14]. Only a few neuropeptides expressed in brainstem LepRb neurons have been identified, however, and (with few exceptions) brainstem LepRb neurons remain largely uncharacterized [15–17].
1.3. Known subsets of hypothalamic LepRb neurons
Hypothalamic LepRb neurons, including those that contain Nos1 or Vgat, play major roles in the control of energy balance and metabolism, but represent large, heterogeneous and dispersed sets of cells that are not well-suited to circuit-level analysis [8,18,19]. Smaller, circumscribed sets of LepRb neurons that reside in the hypothalamic arcuate nucleus (ARC) and express either Pomc and Cartpt or Agrp and Npy contribute to the control of energy balance and glucose homeostasis [20]. The modest effects observed upon manipulation of LepRb in these neurons suggest important roles for other hypothalamic LepRb neurons in leptin action, however [21–24]. Similarly, SF1/PACAP-containing ventromedial hypothalamic nucleus (VMH) neurons and the Prlh-expressing subset of dorsomedial hypothalamic (DMH) LepRb neurons participate in the control of energy expenditure, but only modestly contribute to the overall regulation of body weight by leptin [25–27]. A subgroup of lateral hypothalamic (LHA) LepRb neurons that express neurotensin (Nts) modulates the mesolimbic dopamine system but also contributes only a small amount to the control of energy balance and metabolism by leptin [28–30]. Even taken together, these known subpopulations of hypothalamic LepRb neurons constitute only a fraction of total hypothalamic LepRb neurons and fail to explain the totality (or even the majority) of leptin action on feeding, metabolic control, and body weight regulation. Thus, additional, uncharacterized, groups of hypothalamic and brainstem LepRb neurons contribute importantly to overall leptin action.
1.4. Challenges inherent to studying gene expression in LepRb neurons
To identify, manipulate, and understand the function of potentially important but currently unrecognized subpopulations of LepRb neurons, it is necessary to identify other genes, including neurotransmitters, expressed in these cells. Since LepRb-expressing neurons comprise only a fraction of the cells within the nuclei in which they reside, it has not been possible to disentangle the transcriptome of LepRb cells from that of other cells within these areas [11,12,31,32]. Fluorescent cell sorting can isolate labeled cells from complex populations, but this approach is suboptimal for LepRb neurons, since hypothalamic and brainstem neurons survive isolation procedures poorly at ages when fluorescent markers for LepRb neurons are robustly expressed. We thus set out to examine the transcriptome of LepRb neurons by expressing an enhanced green fluorescent protein-tagged ribosomal subunit (eGFP-L10a) selectively in LepRb neurons to enable immunopurification of ribosomes and their associated mRNA.
2. Materials and methods
2.1. Animals
Rosa26eGFP-L10a mice were generated as previously described in Ref. [33]. The generation of Leprcre mice has also been previously described in Ref. [34]. Leprcre mice were crossed to RosaeGFP-L10a mice to generate Leprcre/+;Rosa26eGFP-L10a/+ mice, which were subsequently intercrossed to generate double homozygous Leprcre/cre;RosaeGFP-L10a/eGFP-L10a (LepRbeGFP-L10a) study animals. Pdyncre mice [33] or Tac1cre mice (Tac1tm1.1(cre)Hze/J, Jackson Laboratory Stock # 021877) were crossed to Rosa26eYFP mice (Gt(ROSA)26Sortm1(EYFP)Cos/J, Jackson Laboratory, Stock # 006148) to generate PdyneYFP or Tac1eYFP mice for study. Leprflox mice were as described previously in Ref. [35]. Pdyncre/+ mice were bred to Leprflox/flox animals, producing Pdyncre/+;Leprflox/+ mice, which were bred to Leprflox/+ mice to generate Pdyncre/+;Leprflox/flox (LeprPdynKO) mice and littermate control (Pdyncre/+;Lepr+/+, Lepr+/+, and Leprflox/flox) mice for study. All procedures were approved by the University of Michigan University Committee on the Use and Care of Animals in accordance with AAALAC and NIH guidelines. Animals were bred at the University of Michigan and maintained in a 12 h light/12 h dark cycle with ad libitum access to food and water.
2.2. Immunoprecipitation of ribosomes (TRAP)
Adult homozygous LepRbeGFP-L10a mice were anesthetized and their brains removed to a mouse coronal brain matrix (1 mm sections) to isolate the hypothalamus or brainstem; material from multiple animals was pooled to produce each sample. For hypothalamic dissections, a 3 × 3 × 3 mm block was dissected from the ventral diencephalon immediately caudal to the optic chiasm. For brainstem dissections, serial 1 mm sections were removed and individual LepRb-containing nuclei (including the EW, DR, LR, PAG, PBN and NTS) were dissected by hand and pooled. Messenger RNA was isolated from eGFP-tagged ribosomes, as well as from the eGFP-depleted fraction, as previously described in Ref. [36]. RNA was assessed for quality using the TapeStation (Agilent, Santa Clara, CA). Samples with RINs (RNA Integrity Numbers) of 8 or greater were prepped using the Illumina TruSeq mRNA Sample Prep v2 kit (Catalog #s RS-122-2001, RS-122-2002) (Illumina, San Diego, CA), and 0.1–3 μg of total RNA was converted to mRNA using a polyA purification. The mRNA was fragmented via chemical fragmentation and copied into first strand cDNA using reverse transcriptase and random primers. The 3′ ends of the cDNA were adenylated, and 6-nucleotide-barcoded adapters ligated. The products were purified and enriched by PCR to create the final cDNA library. Final libraries were checked for quality and quantity by TapeStation (Agilent) and qPCR using Kapa's library quantification kit for Illumina Sequencing platforms (catalog # KK4835) (Kapa Biosystems, Wilmington, MA). They were clustered on the cBot (Illumina) and sequenced 4 samples per lane on a 50 cycle single end run on a HiSeq 2000 (Illumina) using version 2 reagents according to manufacturer's protocols.
2.3. RNA-seq analysis
50 bp single-end reads underwent QC analysis prior to alignment to mouse genome build mm9 using TopHat and Bowtie alignment software [37]. Differential expression was determined using Cufflinks Cuffdiff analysis, with thresholds for differential expression set to fold change >1.5 or <0.66 and a false discovery rate of ≤0.05 [38]. Lists of differentially expressed genes were then queried against the Uniprot Database to identify secreted proteins [39].
2.4. Leptin treatment, colchicine treatment, and immunohistochemistry
LepRbeGFP-L10a mice had food removed at the onset of the light cycle. Animals were treated 4 h later with metreleptin (5 mg/kg, i.p.) (a generous gift from AstraZenica, Inc.) or vehicle and were subjected to perfusion 1.5 h after leptin treatment. Treatment with ICV colchicine (10 μg) to concentrate neuropeptides in the soma for some experiments was for 2 days prior to perfusion.
For perfusion, mice were anesthetized with a lethal dose of intraperitoneal pentobarbital and transcardially perfused with phosphate buffered saline followed by 10% neutral buffered formalin. Brains were removed, post-fixed overnight, and dehydrated in 30% sucrose before coronal sectioning (30 μm) using a freezing microtome (Leica). Immunostaining was performed as previously described in Ref. [40] using primary antibodies for pSTAT3 (Cell Signaling #9145, rabbit, 1:250), GFP (Aves Labs #GFP1020, chicken, 1:1000), VIP (Phoenix #H06416, rabbit, 1:1000), and CRF (Phoenix #H01906, rabbit, 1:500). All antibodies were reacted with species-specific Alexa Fluor-488 or -568 conjugated (Invitrogen, 1:200) secondary antibodies or processed via avidin-biotin/diaminobenzidine (DAB) method (ABC kit, Vector Labs; DAB reagents, Sigma), and imaged as previously described in Ref. [41]. DAB images were pseudocolored using Photoshop software.
2.5. Phenotyping of LepRbPdynKO and control mice
LepRbPdynKO and control littermates were weaned into individual housing at 21 days and fed either chow (Purina Lab Diet 5001) or high fat diet (Research Diets D12492, 60% kcal from fat). Body weight was monitored weekly. A fasted (24 h) blood glucose sample was taken at 12–14 weeks of age. Analysis of body fat and lean mass was performed between 12 and 14 weeks of age using an NMR-based analyzer (Minispec LF90II, Bruker Optics). We also analyzed a subset of mice (13–16 weeks old) for oxygen consumption (VO2), food intake, and locomotor activity using the Comprehensive Laboratory Animal Monitoring System (CLAMS, Columbus Instruments). Insulin was assessed using a double-antibody radioimmunoassay using an 125I-Human insulin tracer (EMD Millipore), a rat insulin standard (Novo), a guinea pig anti-rat insulin first antibody (EMD Millipore), and a sheep anti-guinea pig gamma globulin-PEG second antibody (MDRTC). Leptin was assayed by commercial ELISA (EMD Millipore). No significant differences were detected between the control (Pdyncre/+Lepr+/+, and Leprflox/flox) groups at the conclusion of the study and thus the data from these groups was combined for subsequent analysis.
2.6. Statistics
Physiological data are reported as mean ± SEM. Statistical analysis of physiological data was performed using Prism (version 6.0) software. Unpaired t-tests were used to compare results between groups of two. Body weight gain between genotypes was analyzed by two-way ANOVA. p < 0.05 was considered statistically significant.
3. Results
3.1. LepRbeGFP-L10a mice for profiling LepRb neurons
We generated Leprcre;Rosa26eGFP-L10a (LepRbeGFP-L10a) animals that express eGFP-L10a in LepRb neurons (Figure 1A). To confirm the expression of eGFP-L10a in LepRb neurons in the hypothalamus and brainstem of these animals, we examined eGFP-L10a and its colocalization with phosphorylated STAT3 (pSTAT3; a marker of LepRb signaling) in brain sections from leptin-treated animals. As for other LepRb reporter strains [11,12,40], eGFP-immunoreactivity (-IR) and pSTAT3-IR colocalized in hypothalamic and brainstem regions known to contain LepRb (Figure 1B–G).
Figure 1.
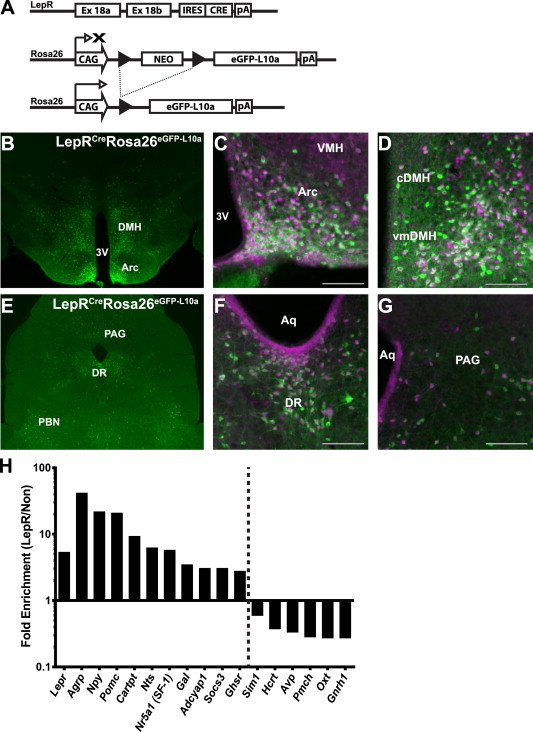
LepRbeGFP-L10a mice for TRAP-seq of LepRb neurons. (A) Leprcre mediates the excision of the transcription-blocking cassette from Rosa26eGFP-L10a in LepRb cells, promoting the expression of eGFP-L10a in these cells. (B,E) Representative images of GFP-IR (green) in the hypothalamus (B) and midbrain (E) of LepRbeGFP-L10a mice. (C,D,F,G) Representative images of pSTAT3- (purple) and GFP-IR (green) in the indicated hypothalamic and brainstem nuclei of LepRbeGFP-L10a mice following leptin treatment (5 mg/kg, i.p., 90 min). Shown are the ARC (C), DMH (D), DR (F), and PAG (G). Scale bar = 100 μm. (H) Fold enrichment in TRAP relative to TRAP-depleted RNA subjected to RNA-Seq for transcripts known to be expressed in LepRb neurons (left of the dotted line) and to be excluded from LepRb neurons (right of the dotted line). Data represent 5 replicates, each from pooled hypothalami from 4 to 6 mice. Enrichment values for all genes shown were significant following correction for false discovery rate (p < 0.05). IRES, internal ribosomal entry site; black arrow heads, LoxP sites; pA, polyadenylation signal; CAG, cytomegalovirus enhancer, chicken beta-actin promoter, rabbit beta-globin splice acceptor; NEO, neomycin selection cassette; DMH, dorsomedial hypothalamic nucleus; Arc, arcuate nucleus; VMH, ventromedial hypothalamic nucleus; cDMH, compact zone of the DMH; vmDMH, ventromedial DMH; PAG, periaqueductal gray; DR, dorsal raphe nucleus.
3.2. TRAP-seq analysis of hypothalamic and brainstem LepRb neurons
We performed anti-eGFP TRAP on hypothalamic extracts from LepRbeGFP-L10a mice and utilized the resultant mRNA (as well as TRAP-depleted supernatant RNA) to generate multiplexed libraries for sequencing on the Illumina HiSeq2000 platform. We sequenced five independent samples, each containing material from the pooled hypothalami of 4–6 LepRbeGFP-L10a mice. To validate the derivation of TRAP mRNA from LepRb neurons, we examined the enrichment of genes known to be expressed (or not expressed) in LepRb neurons in TRAP-derived relative to TRAP-depleted sequences (Figure 1H). TRAP-depleted material was chosen as the reference data for normalization in order to increase the power of the enrichment analysis by depleting transcripts from LepRb neurons from this reference material. This analysis confirmed the enrichment of all examined markers of neurons known to express LepRb (including Lepr, Pomc, and Agrp) [25,26,29,30,42–46] in TRAP mRNA relative to depleted supernatant. Furthermore, transcripts known to be expressed exclusively in non-LepRb neurons (e.g., Pmch, Hcrt, Oxt, Gnrh1) [40,47,48] were enriched in the TRAP-depleted samples relative to TRAP mRNA. Thus, TRAP-seq identified genes preferentially expressed in LepRb cells by comparison to TRAP-depleted (predominantly non-LepRb) samples.
The quantification of gene expression by next generation RNA sequencing not only permits the comparison of relative expression between two conditions but also defines the level of expression for each mRNA species since the frequency with which each sequence is detected reflects its abundance within the overall sample. In addition to revealing expression levels, these frequency data also enhance the statistical power of relative expression analysis compared to the single observation derived from each sample subjected to microarray analysis, permitting us to identify >1100 genes significantly enriched (>1.5-fold) in hypothalamic LepRb (TRAP) mRNA relative to non-LepRb (TRAP-depleted) mRNA (Supplemental Table 1).
Although brainstem LepRb neurons constitute a significant percentage of all LepRb neurons, even less is known about these cells than for hypothalamic LepRb neurons. We thus also dissected brainstem tissue from LepRbeGFP-L10a mice and performed TRAP-seq on two independent samples, each derived from the brainstems of 6–8 animals. We chose to sequence only two samples due to the increased number of animals required to prepare brainstem material, since the list of enriched transcripts in the hypothalamus was essentially the same for n = 2 and n = 4 samples (data not shown). This analysis revealed ∼900 genes that were significantly enriched in brainstem LepRb RNA relative to non-LepRb RNA (Supplemental Table 2). Our analysis of the non-LepRb (TRAP-depleted) and LepRb (TRAP) mRNA also defined genes that were enriched in non-LepRb cells of the hypothalamus (∼1800 genes) and brainstem (∼900 genes) relative to LepRb cells (Supplemental Tables 3 and 4).
To understand the common properties of brain cells that express LepRb (as well as of those that do not contain LepRb), we identified genes enriched in both hypothalamic and brainstem TRAP (and TRAP-depleted) mRNA (Supplemental Tables 5 and 6). To characterize the types of cells contributing to TRAP- and TRAP-depleted mRNA, we plotted fold enrichment for hypothalamic and brainstem-derived mRNA to reveal the genes most highly enriched in common between the two sites (Figure 2). The genes most highly enriched in hypothalamic and brainstem TRAP mRNA included a number of neuropeptides (Npw, Ucn, Prok2, Ghrh, Cartpt, Tac1) and markers of dopaminergic (DA) neurons (Slc6a3, Th), as well as some markers for subsets of vasculature-associated cells (Flt1, Abcb1a). Some cell surface receptors and intracellular signaling proteins known to be expressed in neurons important for the control of metabolism (Mc3r, Gucy2c, Foxa2, Atg7) also were enriched in hypothalamic and brainstem LepRb cells. These findings are consistent with the predominant expression of LepRb in peptidergic and DA neurons, as well as in a subset of vasculature-associated cells, in the hypothalamus and brainstem.
Figure 2.
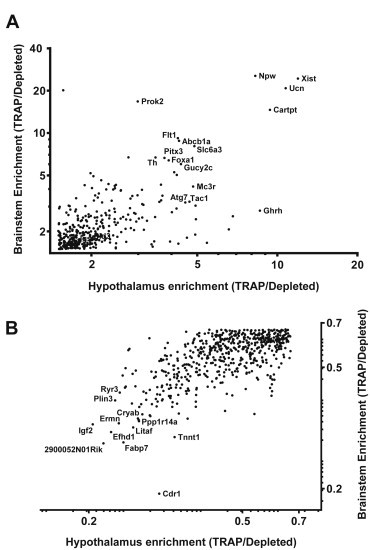
A subset of proteins are enriched or de-enriched in both hypothalamic and brainstem LepRb neurons. (A) Transcripts enriched (expression in TRAP/Depleted >1.5) in both the hypothalamic and the brainstem TRAP derived fraction were plotted against each other to reveal the transcripts mostly highly enriched in both brain areas. (B) Transcripts de-enriched in the TRAP-derived fraction relative to background (TRAP/Depleted <0.66) for both areas were also identified and plotted. Poorly expressed transcripts (<1 fragments per kilobase of exon per millions reads mapped (FPKM)) in the TRAP-derived fraction (A, 88 of 437 genes) or TRAP-depleted fraction (B, 233 of 739 gene) of either brain area were excluded from the graph. All genes shown were differentially expressed between the TRAP and depleted fractions (p < 0.05) as determined by CuffDiff analysis.
In contrast, the transcripts most highly enriched in TRAP-depleted (non-LepRb) mRNA relative to TRAP mRNA from both hypothalamus and brainstem included markers for glial cell types (Igf2, Fabp7, Cryab, Ermn), immune cells (Litaf), and neural progenitor cells (Efhd1, Cdr1, Ppp1r14a). Thus, while some studies have suggested that a variety of non-neuronal cells express LepRb and respond directly to leptin [49,50], TRAP mRNAs from LepRbeGFP-L10a animals are enriched for transcripts from differentiated neurons (especially peptidergic and DA neurons) and vasculature-associated cells relative to these other cell types.
3.3. TRAP-seq identifies novel subpopulations of hypothalamic and brainstem LepRb neurons
The mRNA species that are both highly expressed and highly enriched in LepRb cells presumably represent the most functionally relevant genes within a specific class of proteins. Thus, to identify the neuropeptides most likely to be functionally relevant in LepRb neurons, we examined expression level and fold enrichment for TRAP-enriched transcripts that encode secreted proteins as defined by gene-ontology (GO) analysis on the UniPROT platform [39] (Figure 3).
Figure 3.
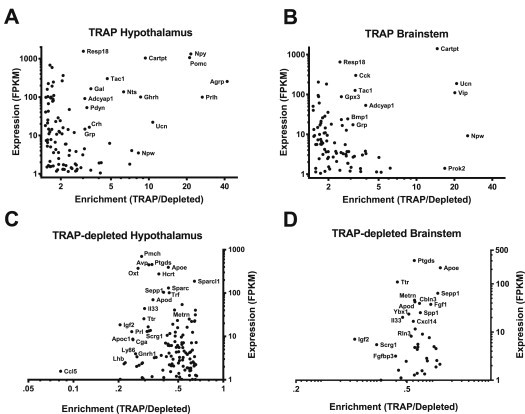
Secreted protein-encoding transcripts enriched or de-enriched in hypothalamic and brainstem LepRb neurons. Transcripts enriched >1.5-fold in the TRAP-derived fraction of the hypothalamus (A) or brainstem (B) were queried against the UniprotKB database to identify secreted proteins expressed in LepRb neurons of these areas. De-enriched (TRAP/depleted <0.66) transcripts from the hypothalamus (C) or brainstem (D) were similarly assayed. Following gene ontology analysis, genes were individually verified in the literature to confirm appropriate classification and sorted by expression level, as expressed in fragments per kilobase of exon per million reads mapped (FPKM), in the LepRb fraction. Transcripts expressed <1 FPKM in the LepRb fraction were excluded from the graph. All genes shown were differentially expressed between the TRAP and depleted fractions (p < 0.05) as determined by CuffDiff analysis.
The secreted protein-encoding transcripts that were enriched in hypothalamic LepRb neurons included peptides that define known subpopulations of hypothalamic LepRb neurons (e.g., Pomc, Agrp, Prlh, Nts, Gal) (Figure 3A). In addition to revealing the enrichment of Resp18 (a marker of peptide-secreting cells), this analysis also identified a number of highly expressed and enriched neuropeptide-encoding genes not previously examined as potential markers for subpopulations of LepRb neurons, including tachykinin-1 (Tac1), prodynorphin (Pdyn), corticotrophin releasing hormone (Crh), and growth hormone releasing hormone (Ghrh).
The genes that encode secreted proteins that were highly expressed and enriched in brainstem LepRb neurons included two neuropeptide-encoding transcripts previously shown to be expressed in brainstem LepRb cells, Ucn and Cck [16,17,51] (Figure 3B). Our analysis also revealed the expression of a number of additional neuropeptides (including Tac1 and vasoactive intestinal peptide (Vip)) that were highly expressed and enriched in brainstem LepRb neurons.
Analysis of the transcripts encoding secreted proteins from TRAP-depleted (non-LepRb) mRNA in the hypothalamus revealed genes that encode neuropeptides found exclusively in non-LepRb neurons (e.g., Pmch, Oxt, Avp, Hcrt, Ghrh1) and in pituitary gonadotrophs and lactotrophs (Lh, Cga, Prl) (presumably derived from pituitary material that contaminated the hypothalamic tissue). In both hypothalamus and brainstem, TRAP-depleted transcripts encoding secreted proteins were also enriched for markers for glial (Apoe, Apod, Apoc1, Ttr, Igf2, Ptgds, Scrg1, Metrn, Sparc) and immune (Il33, Ly86) cells (Figure 3C,D). These findings are consistent with the data above (Figure 2B), which suggest the failure to recover mRNA from many non-neuronal cell types by LepRb specific TRAP.
3.4. Confirmation of novel neuropeptide-expressing subpopulations of LepRb neurons
To confirm the expression of Pdyn and Tac1 in LepRb neurons, we crossed PdynIRES-Cre and Tac1IRES-Cre mice onto the cre-inducible Rosa26eYFP background, generating animals that express eYFP in Pdyn and Tac1 cells (PdyneYFP and Tac1eYFP mice, respectively) to examine their potential expression of LepRb (Figure 4; Supplemental Figure 1). This analysis revealed the colocalization of leptin-stimulated pSTAT3-IR with Pdyn and Tac1 in largely distinct sets of hypothalamic neurons: LepRbPdyn cells lie primarily in the ARC, VMH, and DMH; few LepRbPdyn cells were found in the LHA or ventral premammillary nucleus (PMv) (Figure 4A–G). In the ARC, approximately 40% of LepRbDyn cells also contain POMC (data not shown). In contrast, hypothalamic LepRbTac1 cells were detected primarily in the LHA and PMv; fewer LepRbTac1 cells were found in the DMH, and LepRbTac1 neurons were absent from the ARC and VMH (Supplemental Figure 1). We also found that leptin-stimulated pSTAT3-IR and eYFP in Tac1eYFP mice colocalized in two brainstem areas: the NTS and the ventral lateral PAG.
Figure 4.
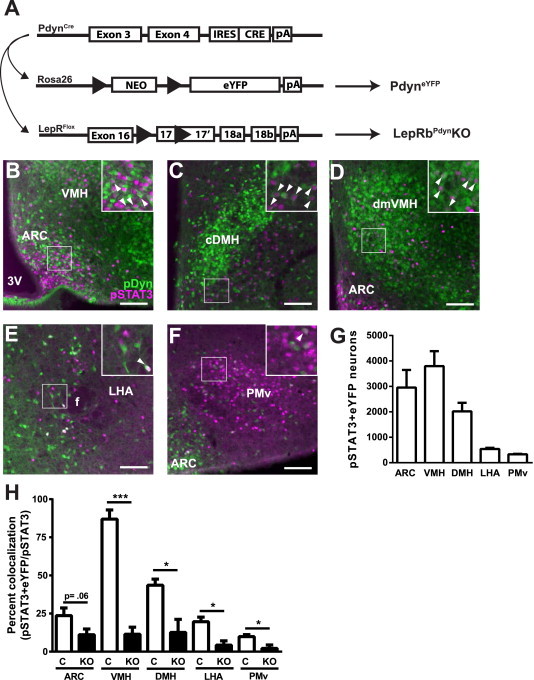
Pdyn expression defines a distinct subpopulation of LepRb neurons. (A) Pdyncre mediates the excision of the transcription-blocking cassette from Rosa26eYFP in LepRb cells, promoting the expression of eYFP in these cells. Pdyncre can also mediate the excision of exon 17 from LepRflox mice resulting in the ablations of LepRb from Pdyn cells (LepRbPdynKO mice). (B–F) Representative images showing colocalization of pSTAT3- (purple) and GFP-IR (green; detects eYFP) in the ARC (B), VMH (C), DMH (D), LHA (E), and PMv (F), of PdyneYFP mice following leptin treatment (5 mg/kg, i.p., 90 min). (G) Cells containing both Pdyn (eYFP-IR) and LepRb (pSTAT3-IR) were quantified in the hypothalamic regions shown (plotted as mean ± SEM). (H) Colocalization of pSTAT3 and Pdyn was reduced in LepRbPdynKO mice on the reporter background relative to control (C) PdyneYFP mice (mean ± SEM is shown; *p < 0.05 by t-test). Arrows indicate double labeled cells. Scale bar = 100 μm. Cell counts were performed on serial sections (1:4) from n = 3 control and n = 2 LepRbPdynKO mice treated with leptin (5 mg/kg, i.p., 90 min). For (G), cell counts were multiplied by 4 to approximate total hypothalamic cell numbers. NEO, neomycin selection cassette; black arrow heads, LoxP sites; pA, polyadenylation site.
Additionally, immunostaining for CRH or VIP peptide and eYFP in brain sections from colchicine-treated Leprcre;Rosa26eYFP (LepRbeYFP) reporter mice revealed that LHA LepRb neurons contain CRH-IR (Supplemental Figure 2), and VIP-IR colocalized with LepRb in the brainstem DR and PAG nuclei of colchicine-treated LepRbeYFP mice (Supplemental Figure 3).
3.5. Function of LepRbPdyn neurons
We hypothesized that TRAP-seq would identify physiologically relevant markers of LepRb subpopulations. We chose to examine the potential function of LepRbPdyn neurons, since leptin and nutritional status modulate Pdyn expression and activity (by the criterion of c-Fos accumulation) of Pdyn neurons, and since Pdyn expression overlaps with POMC cells in the ARC [52–54]. To examine the role for LepRbPdyn neurons in leptin action, we generated Pdyncre/+;Leprflox/flox (LepRbPdynKO) animals (Figure 4A) along with Pdyncre;Lepr+/+ and Leprflox/flox (control) littermates. Leptin-stimulated pSTAT3-IR was largely ablated from Pdyn-expressing neurons in the VMH and DMH (along with the small populations of LepRbPdyn cells in the LHA and PMv) of LepRbPdynKO mice and was reduced approximately 50% in ARC LepRbPdyn neurons (Figure 4H). The reason underlying the incomplete penetrance of Pdyncre-mediated excision of Leprflox in ARC LepRbPdyn cells is unclear, but similar idiosyncratic deletion patterns have been observed with other combinations of cre/flox alleles, including for Leprflox [51]. Thus, LepRbPdynKO mice display LepRb ablation from most hypothalamic LepRbPdyn cells; roughly 7200 total neurons display LepRb disruption in these mice, ∼50% of which lie in the VMH; most of the remainder are distributed between the ARC and DMH (∼20% of the total disrupted LepRb neurons each).
We detected no alterations in body weight or body composition for chow-fed LepRbPdynKO male mice compared to controls (Figure 5A,B). Weekly chow intake was also unchanged (data not shown). Body weight and chow intake were also unchanged in female LepRbPdymKO mice compared to controls (data not shown), however LepRbPdymKO females had increased adiposity on a chow diet compared to controls (8.1% vs 6.7%, p = 0.02). 24-h fasting induced weight loss was not different between LepRbPdynKO mice or controls of either sex (data not shown). Also consistent with an underlying defect in energy homeostasis in LepRbPdynKO mice, male LepRbPdynKO mice gained significantly more weight and adiposity than controls when challenged with 9 weeks of high fat diet (HFD) (Figure 5A,B). As expected, based upon their increased fat mass, circulating leptin concentrations were higher in LepRbPdynKO mice (Figure 5C). While insulin concentrations trended up in ad libitum-fed LepRbPdynKO mice, this increase was not significant; fasted glucose levels were not different (Figure 5D,E). While food intake assessed over three days in CLAMS was similar between high fat-fed LepRbPdynKO mice and controls (Figure 5F, 24 h data shown), calorimetry revealed decreased energy expenditure (VO2) in the HFD-fed LepRbPdynKO mice compared to controls (Figure 5G,H). While we did not have sufficient numbers of animals to analyze the data by ANCOVA, the finding that VO2 was decreased in the LepRbPdynKO mice compared to controls whether the data were normalized to body weight or not reinforces the conclusion of diminished energy expenditure in the LepRbPdynKO mice. Thus, leptin action via the Pdyncre-sensitive LepRbPdyn neurons promotes energy expenditure, rather than controlling food intake, to modulate overall energy balance. Furthermore, these data confirm the identification of functionally relevant population of LepRb neurons by TRAP-seq.
Figure 5.
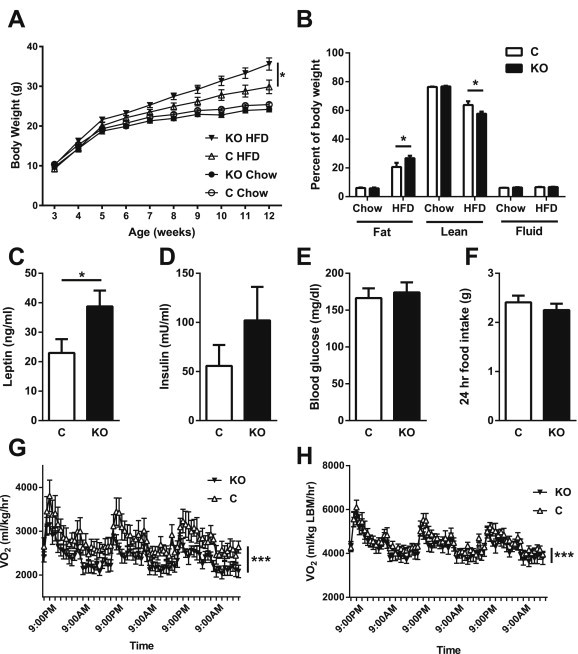
Leptin regulation of Pdyn neurons is required for normal energy homeostasis in DIO mice. Male LepRbPdynKO (KO) and littermate controls (C) were placed on chow or high fat diets, and body weight measured weekly (A) (mean ± SEM is shown; *p < 0.05 by ANOVA). At 12–14 weeks of age, animals underwent body composition analysis by NMR spectroscopy (B). Serum from HFD-fed control and LepRbPdynKO mice was assayed for leptin (C) or insulin (D). Blood glucose was measured following a 24 h fast (E) in the HFD cohort. (B–E) mean ± SEM is shown; *p < 0.05 by t-test. (F–H) A subset of HFD-fed control and LepRbPdynKO mice were assessed in CLAMS metabolic cages for 3 days following body composition analysis. Food intake (F) was measured on the final day. VO2 was also measured and is presented normalized to total body mass (G) and lean body mass (H) (Mean ± SEM is shown; ***p < .0001 by ANOVA). HFD, high fat diet (Research diets, 60% kcal from fat). Black triangles = HFD fed LepRbPdynKO; white triangles = HFD fed controls; black circles = chow fed LepRbPdynKO; white circles = chow fed controls. Black bars = LepRbPdynKO; white bars = controls. N = 8–14 for chow and HFD cohorts. N = 6–7 animals per genotype for VO2 measurements.
4. Discussion
We examined gene expression in brain LepRb neurons, revealing over 1100 mRNAs that are enriched in hypothalamic LepRb cells and approximately 900 genes whose expression is enriched in brainstem LepRb cells. These LepRb enriched transcripts encode a variety of neuropeptides and other classes of proteins found primarily in peptidergic neurons (along with genes characteristic of DA neurons and an uncharacterized set of cells that express vascular markers). Most of these genes were not previously known to be expressed/enriched in LepRb neurons. Translational profiling of these cells thus revealed markers for previously unrecognized subpopulations of LepRb neurons, as well as genes of many classes that are likely to be important for the function of LepRb cells (and thus, for the control of body weight and metabolism). We have demonstrated that one of these populations (LepRbPdyn cells, contained primarily in the VMH, DMH and ARC) plays a crucial role in leptin-regulated energy balance through the control of metabolic rate/energy expenditure.
4.1. Validity of LepRb-specific TRAP-seq
The enrichment of genes encoding known LepRb-expressed mRNAs in our TRAP samples (e.g., Pomc, Agrp, Prlh, Nts, Gal, etc.) [25,26,29,30,42–46], together with our verification that many TRAP-enriched transcripts not previously known to be expressed in LepRb neurons colocalized with LepRb neurons, demonstrates the accuracy/specificity of the TRAP-seq method for cell type-specific transcriptome analysis. Although Pdyn expression and the activity of Pdyn neurons have previously been shown to be regulated by leptin [52,54], this regulation has never been shown to be cell-autonomous. Furthermore, while some ARC LepRbPdyn neurons contain POMC, LepRbTac1 and LepRbCRH neurons were absent from the ARC and thus distinct from both POMC and AgRP cells. Hence, TRAP-seq not only revealed previously unknown neuropeptide transmitters employed by discrete populations of LepRb neurons, but also defined markers for previously unrecognized subsets of LepRb cells.
4.2. Limitations of TRAP-seq
Markers for some previously defined sets of hypothalamic LepRb neurons [18,19], such as Nos1 (∼1.5-fold enriched) and Slc32a1 (vGat; ∼1.2-fold enriched), were poorly enriched. This presumably reflects the wide expression of Nos1 and Slc32a1 throughout the hypothalamus in both LepRb and non-LepRb neurons. Thus, TRAP-seq more robustly reveals the enrichment of genes with restricted expression (e.g., neuropeptides) than it does widely expressed genes, since the fold enrichment of narrowly expressed genes in TRAP mRNA is enhanced by comparison to the relative dilution of these genes within the tissue as a whole. Hence, the mRNAs that can be unambiguously assigned to the LepRb neuron transcriptome are biased toward genes more highly expressed in LepRb cells than other cells in the tissue, and this method is less sensitive for widely expressed transcripts that are also found in some LepRb neurons. The genes that are highly enriched in TRAP mRNA, however, often represent the best markers for circumscribed, functionally related, populations of cells that are tractable for circuit analysis.
The majority of LepRb enriched mRNA species represent genes likely to be specific for neurons (along with some cells that express vascular markers, including receptors Tie1, Tek and Eltd1, consistent with reports of LepRb expression in cells associated with the blood–brain barrier [55]). Conversely, genes enriched in non-LepRb relative to LepRb mRNA not only contain markers for known non-LepRb neurons but also for a variety of non-neuronal cell types, including glial and immune cells. This finding contrasts with reports of LepRb expression in subsets of these non-neuronal cell types [49,50]. It remains possible that some cell types (including other neurons) might express low levels of LepRb, however, if cre expression from Leprcre and/or reporter expression from Rosa26eGFP-L10a is too low to detect in such cells. Thus, our analysis is necessarily biased towards those cell populations of which have active expression at both the Lepr and Rosa26 locus. In either case, our TRAP-seq analysis appears to be specific, if not perfectly sensitive, for neurons (and some vasculature-associated cells) that contain LepRb.
4.3. Hypothalamic and brainstem LepRb neurons
Interestingly, while some genes were enriched in both hypothalamic and brainstem LepRb neurons, many highly enriched neuropeptide encoding mRNAs were found in LepRb neurons from only one region. Indeed, while a few neuropeptide encoding genes enriched in brainstem LepRb neurons (including Tac1 and Cartpt) were also found in populations of hypothalamic LepRb cells, brainstem and hypothalamic LepRb neurons contain relatively distinct sets of highly expressed neuropeptide transmitters, as most neuropeptide encoding genes that are enriched in hypothalamic LepRb neurons are absent from brainstem LepRb cells. Similarly, Cck [16,51] and Vip are enriched and expressed in brainstem, but not hypothalamic, LepRb neurons. These findings support the concept of discrete functions for individual groups of LepRb neurons and their uniquely expressed gene products [10].
4.4. Function of LepRbPdyn neurons
Of the novel subsets of LepRb neurons that we identify here, we investigated the role for leptin action on LepRbPdyn neurons. LepRb ablation from LepRbPdyn neurons in LepRbPdynKO mice decreased energy expenditure to increase adiposity during exposure to HFD. Thus, the Pdyncre sensitive LepRb neurons promote energy expenditure in response to leptin. Approximately half of the LepRbPdyn cells from which LepRb was ablated in LepRbPdynKO mice lie in the VMH, and almost all VMH LepRb neurons contain Pdyn. It is technically challenging to assess the degree of colocalization between the LepRbPdyn and LepRbSF-1 populations; both appear to comprise ∼80% of all VMH LepRb neurons, suggesting a minimum of 60% of VMH LepRb neurons are affected in both models [25,26]. The consistent phenotype observed between these two models of VMH LepRb ablation, however, both serve to highlight the known role for the VMH in the control of energy expenditure, including in response to leptin [25,26]. Non-VMH LepRbPdyn cells (primarily in the ARC and DMH) also may contribute to the modulation of energy expenditure, but they do not appear to play major additional roles in the control of energy balance.
4.5. Neuropeptides in LepRb neurons
In addition to providing markers for LepRb subpopulations, the products of transcripts enriched in LepRb neurons are likely to play important functional roles in LepRb neurons. While the contribution of POMC and AgRP peptides to leptin action has been well described, the metabolic functions of the majority of the neuropeptides identified by TRAP-seq (including dynorphin) are as yet undetermined. Furthermore, not only do LepRb-expressed neuropeptides presumably contribute to the effects of leptin on neurotransmission but also the GPCRs, transcriptional regulators, signaling proteins, and other classes of proteins enriched in LepRb neurons likely contribute to the function of these cells and thus to the control of energy balance and metabolism. Some of these LepRb enriched gene products may constitute potential targets for therapeutic intervention in obesity and diabetes.
4.6. Conclusions
Overall, by elucidating the transcriptome of brainstem and hypothalamic LepRb neurons, our TRAP-seq analysis reveals markers for numerous subpopulations of LepRb neurons, along with genes likely to contribute importantly to central leptin action. In the future it will be important to define the roles in leptin action and metabolic control for new subpopulations of LepRb neurons and for a variety of gene products that are highly enriched in LepRb neurons. The LepRb expressed genes defined by our TRAP-seq analysis thus provide an important resource for these and other future investigations.
Author contributions
MA, CP, and DO researched data, wrote and edited manuscript; MH, MK, and BL reviewed/edited manuscript. MM wrote and edited manuscript.
Acknowledgments
We thank Astra-Zenica, Inc. for the generous gift of leptin, members of the Myers lab for helpful discussions, and the Michigan Sequencing and Bioinformatics Cores (including Jim Cavalcoli and Rich MacEachin) for invaluable assistance. Research support was provided by the Michigan Diabetes Research Center (NIH P30 DK020572, including the Animal Phenotyping and Clinical Cores, and a pilot project to DPO), the American Diabetes Association, the Marilyn H. Vincent Foundation (MGM) and the NIH (MGM: DK056731; MBA: DK097861). MGM is the guarantor of the manuscript.
Contributor Information
Martin G. Myers, Jr., Email: mgmyers@umich.edu.
David P. Olson, Email: dpolson@umich.edu.
Conflict of interest
The authors declare that they have no conflicts of interest relevant to this manuscript.
Appendix A. Supplementary data
The following are the supplementary data related to this article:
References
- 1.Friedman J.M., Halaas J.L. Leptin and the regulation of body weight in mammals. Nature. 1998;395(6704):763–770. doi: 10.1038/27376. [DOI] [PubMed] [Google Scholar]
- 2.Bates S.H., Myers M.G., Jr. The role of leptin receptor signaling in feeding and neuroendocrine function. Trends in Endocrinology & Metabolism. 2003;14(10):447–452. doi: 10.1016/j.tem.2003.10.003. [DOI] [PubMed] [Google Scholar]
- 3.Ahima R.S., Prabakaran D., Mantzoros C.S., Qu D., Lowell B.B., Maratos-Flier E. Role of leptin in the neuroendocrine response to fasting. Nature. 1996;382:250–252. doi: 10.1038/382250a0. [DOI] [PubMed] [Google Scholar]
- 4.Myers M.G., Jr., Olson D.P. Central nervous system control of metabolism. Nature. 2012;491(7424):357–363. doi: 10.1038/nature11705. [DOI] [PubMed] [Google Scholar]
- 5.Schwartz M.W., Seeley R.J., Tschop M.H., Woods S.C., Morton G.J., Myers M.G. Cooperation between brain and islet in glucose homeostasis and diabetes. Nature. 2013;503(7474):59–66. doi: 10.1038/nature12709. [DOI] [PMC free article] [PubMed] [Google Scholar]
- 6.de Luca C., Kowalski T.J., Zhang Y., Elmquist J.K., Lee C., Kilimann M.W. Complete rescue of obesity, diabetes, and infertility in db/db mice by neuron-specific LEPR-B transgenes. Journal of Clinical Investigation. 2005;115(12):3484–3493. doi: 10.1172/JCI24059. [DOI] [PMC free article] [PubMed] [Google Scholar]
- 7.Cohen P., Zhao C., Cai X., Montez J.M., Rohani S.C., Feinstein P. Selective deletion of leptin receptor in neurons leads to obesity. Journal of Clinical Investigation. 2001;108(8):1113–1121. doi: 10.1172/JCI13914. [DOI] [PMC free article] [PubMed] [Google Scholar]
- 8.Ring L.E., Zeltser L.M. Disruption of hypothalamic leptin signaling in mice leads to early-onset obesity, but physiological adaptations in mature animals stabilize adiposity levels. Journal of Clinical Investigation. 2010;120(8):2931–2941. doi: 10.1172/JCI41985. [DOI] [PMC free article] [PubMed] [Google Scholar]
- 9.Hayes M.R., Skibicka K.P., Leichner T.M., Guarnieri D.J., DiLeone R.J., Bence K.K. Endogenous leptin signaling in the caudal nucleus tractus solitarius and area postrema is required for energy balance regulation. Cell Metabolism. 2010;11(1):77–83. doi: 10.1016/j.cmet.2009.10.009. [DOI] [PMC free article] [PubMed] [Google Scholar]
- 10.Myers M.G., Jr., Munzberg H., Leinninger G.M., Leshan R.L. The geometry of leptin action in the brain: more complicated than a simple ARC. Cell Metabolism. 2009;9(2):117–123. doi: 10.1016/j.cmet.2008.12.001. [DOI] [PMC free article] [PubMed] [Google Scholar]
- 11.Patterson C.M., Leshan R.L., Jones J.C., Myers M.G., Jr. Molecular mapping of mouse brain regions innervated by leptin receptor-expressing cells. Brain Research. 2011 Mar 10;1378:18–28. doi: 10.1016/j.brainres.2011.01.010. [Epub 2011 Jan 13]. PMID: 21237139. [DOI] [PMC free article] [PubMed] [Google Scholar]
- 12.Scott M.M., Lachey J.L., Sternson S.M., Lee C.E., Elias C.F., Friedman J.M. Leptin targets in the mouse brain. Journal of Comparative Neurology. 2009;514(5):518–532. doi: 10.1002/cne.22025. [DOI] [PMC free article] [PubMed] [Google Scholar]
- 13.Elmquist J.K., Bjorbaek C., Ahima R.S., Flier J.S., Saper C.B. Distributions of leptin receptor mRNA isoforms in the rat brain. Journal of Comparative Neurology. 1998;395(4):535–547. [PubMed] [Google Scholar]
- 14.Grill H.J., Schwartz M.W., Kaplan J.M., Foxhall J.S., Breininger J., Baskin D.G. Evidence that the caudal brainstem is a target for the inhibitory effect of leptin on food intake. Endocrinology. 2002;143(1):239–246. doi: 10.1210/endo.143.1.8589. [DOI] [PubMed] [Google Scholar]
- 15.Huo L., Gamber K.M., Grill H.J., Bjorbaek C. Divergent leptin signaling in proglucagon neurons of the nucleus of the solitary tract in mice and rats. Endocrinology. 2008;149(2):492–497. doi: 10.1210/en.2007-0633. [DOI] [PMC free article] [PubMed] [Google Scholar]
- 16.Garfield A.S., Patterson C., Skora S., Gribble F.M., Reimann F., Evans M.L. Neurochemical characterization of body weight-regulating leptin receptor neurons in the nucleus of the solitary tract. Endocrinology. 2012;153(10):4600–4607. doi: 10.1210/en.2012-1282. [DOI] [PMC free article] [PubMed] [Google Scholar]
- 17.Xu L., Scheenen W.J.J.M., Leshan R.L., Patterson C.M., Elias C.F., Bouwhuis S. Leptin signaling modulates the activity of urocortin 1 neurons in the mouse non-preganglionic Edinger-Westphal nucleus. Endocrinology. 2011 Jan 5 doi: 10.1210/en.2010-1143. [Epub ahead of print]. PMID: 21209012. [DOI] [PMC free article] [PubMed] [Google Scholar]
- 18.Vong L., Ye C., Yang Z., Choi B., Chua S., Jr., Lowell B.B. Leptin action on GABAergic neurons prevents obesity and reduces inhibitory tone to POMC neurons. Neuron. 2011;71(1):142–154. doi: 10.1016/j.neuron.2011.05.028. [DOI] [PMC free article] [PubMed] [Google Scholar]
- 19.Leshan R.L., Greenwald-Yarnell M., Patterson C.M., Gonzalez I.E., Myers M.G., Jr. Leptin action via hypothalamic neuronal nitric oxide synthase-1 neurons control energy balance. Nature Medicine. 2012 Apr 22 doi: 10.1038/nm.2724. http://dx.doi.org/10.1038/nm.2724 [Epub ahead of print]. PMID: 22522563. [DOI] [PMC free article] [PubMed] [Google Scholar]
- 20.Schwartz M.W., Baskin D.G., Kaiyala K.J., Woods S.C. Model for the regulation of energy balance and adiposity by the central nervous system. American Journal of Clinical Nutrition. 1999;69(4):584–596. doi: 10.1093/ajcn/69.4.584. [DOI] [PubMed] [Google Scholar]
- 21.van de Wall E., Leshan R., Xu A.W., Balthasar N., Coppari R., Liu S.M. Collective and individual functions of leptin receptor modulated neurons controlling metabolism and ingestion. Endocrinology. 2008;149(4):1773–1785. doi: 10.1210/en.2007-1132. [DOI] [PMC free article] [PubMed] [Google Scholar]
- 22.Balthasar N., Coppari R., McMinn J., Liu S.M., Lee C.E., Tang V. Leptin receptor signaling in POMC neurons is required for normal body weight homeostasis. Neuron. 2004;42(6):983–991. doi: 10.1016/j.neuron.2004.06.004. [DOI] [PubMed] [Google Scholar]
- 23.Berglund E.D., Vianna C.R., Donato J., Jr., Kim M.H., Chuang J.C., Lee C.E. Direct leptin action on POMC neurons regulates glucose homeostasis and hepatic insulin sensitivity in mice. Journal of Clinical Investigation. 2012;122(3):1000–1009. doi: 10.1172/JCI59816. [DOI] [PMC free article] [PubMed] [Google Scholar]
- 24.Huo L., Gamber K., Greeley S., Silva J., Huntoon N., Leng X.H. Leptin-dependent control of glucose balance and locomotor activity by POMC neurons. Cell Metabolism. 2009;9(6):537–547. doi: 10.1016/j.cmet.2009.05.003. [DOI] [PMC free article] [PubMed] [Google Scholar]
- 25.Dhillon H., Zigman J.M., Ye C., Lee C.E., McGovern R.A., Tang V. Leptin directly activates SF1 neurons in the VMH, and this action by leptin is required for normal body-weight homeostasis. Neuron. 2006;49(2):191–203. doi: 10.1016/j.neuron.2005.12.021. [DOI] [PubMed] [Google Scholar]
- 26.Hawke Z., Ivanov T.R., Bechtold D.A., Dhillon H., Lowell B.B., Luckman S.M. PACAP neurons in the hypothalamic ventromedial nucleus are targets of central leptin signaling. Journal of Neuroscience: the Official Journal of the Society for Neuroscience. 2009;29(47):14828–14835. doi: 10.1523/JNEUROSCI.1526-09.2009. [DOI] [PMC free article] [PubMed] [Google Scholar]
- 27.Dodd G.T., Worth A.A., Nunn N., Korpal A.K., Bechtold D.A., Allison M.B. The thermogenic effect of leptin is dependent on a distinct population of prolactin-releasing peptide neurons in the dorsomedial hypothalamus. Cell Metabolism. 2014;20(4):639–649. doi: 10.1016/j.cmet.2014.07.022. [DOI] [PMC free article] [PubMed] [Google Scholar]
- 28.Goforth P.B., Leinninger G.M., Patterson C.M., Satin L.S., Myers M.G., Jr. Leptin acts via lateral hypothalamic area neurotensin neurons to inhibit orexin neurons by multiple GABA-independent mechanisms. Journal of Neuroscience: the Official Journal of the Society for Neuroscience. 2014;34(34):11405–11415. doi: 10.1523/JNEUROSCI.5167-13.2014. [DOI] [PMC free article] [PubMed] [Google Scholar]
- 29.Leinninger G.M., Opland D.M., Jo Y.H., Faouzi M., Christensen L., Cappellucci L.A. Leptin action via neurotensin neurons controls orexin, the mesolimbic dopamine system and energy balance. Cell Metabolism. 2011;14(3):313–323. doi: 10.1016/j.cmet.2011.06.016. [DOI] [PMC free article] [PubMed] [Google Scholar]
- 30.Laque A., Zhang Y., Gettys S., Nguyen T.A., Bui K., Morrison C.D. Leptin receptor neurons in the mouse hypothalamus are colocalized with the neuropeptide galanin and mediate anorexigenic leptin action. American Journal of Physiology. Endocrinology and Metabolism. 2013;304(9):E999–E1011. doi: 10.1152/ajpendo.00643.2012. [DOI] [PMC free article] [PubMed] [Google Scholar]
- 31.Lee S., Bookout A.L., Lee C.E., Gautron L., Harper M.J., Elias C.F. Laser-capture microdissection and transcriptional profiling of the dorsomedial nucleus of the hypothalamus. Journal of Comparative Neurology. 2012;520(16):3617–3632. doi: 10.1002/cne.23116. [DOI] [PMC free article] [PubMed] [Google Scholar]
- 32.Jovanovic Z., Tung Y.C., Lam B.Y., O'Rahilly S., Yeo G.S. Identification of the global transcriptomic response of the hypothalamic arcuate nucleus to fasting and leptin. Journal of Neuroendocrinology. 2010;22(8):915–925. doi: 10.1111/j.1365-2826.2010.02026.x. [DOI] [PMC free article] [PubMed] [Google Scholar]
- 33.Krashes M.J., Shah B.P., Madara J.C., Olson D.P., Strochlic D.E., Garfield A.S. An excitatory paraventricular nucleus to AgRP neuron circuit that drives hunger. Nature. 2014;507(7491):238–242. doi: 10.1038/nature12956. [DOI] [PMC free article] [PubMed] [Google Scholar]
- 34.Leshan R.L., Bjornholm M., Munzberg H., Myers M.G., Jr. Leptin receptor signaling and action in the central nervous system. Obesity(SilverSpring) 2006;14(Suppl. 5):208S–212S. doi: 10.1038/oby.2006.310. [DOI] [PubMed] [Google Scholar]
- 35.McMinn J.E., Liu S.M., Dragatsis I., Dietrich P., Ludwig T., Eiden S. An allelic series for the leptin receptor gene generated by CRE and FLP recombinase. Mammalian Genome. 2004;15(9):677–685. doi: 10.1007/s00335-004-2340-1. [DOI] [PubMed] [Google Scholar]
- 36.Stanley S., Domingos A.I., Kelly L., Garfield A., Damanpour S., Heisler L. Profiling of glucose-sensing neurons reveals that GHRH neurons are activated by hypoglycemia. Cell Metabolism. 2013;18(4):596–607. doi: 10.1016/j.cmet.2013.09.002. [DOI] [PubMed] [Google Scholar]
- 37.Langmead B., Trapnell C., Pop M., Salzberg S.L. Ultrafast and memory-efficient alignment of short DNA sequences to the human genome. Genome Biology. 2009;10(3):R25. doi: 10.1186/gb-2009-10-3-r25. [DOI] [PMC free article] [PubMed] [Google Scholar]
- 38.Trapnell C., Williams B.A., Pertea G., Mortazavi A., Kwan G., van Baren M.J. Transcript assembly and quantification by RNA-Seq reveals unannotated transcripts and isoform switching during cell differentiation. Nature Biotechnology. 2010;28(5):511–515. doi: 10.1038/nbt.1621. [DOI] [PMC free article] [PubMed] [Google Scholar]
- 39.Magrane M., Consortium U. UniProt Knowledgebase: a hub of integrated protein data. Database (Oxford) 2011;2011 doi: 10.1093/database/bar009. (bar009) [DOI] [PMC free article] [PubMed] [Google Scholar]
- 40.Leinninger G.M., Jo Y.H., Leshan R.L., Louis G.W., Yang H., Barrera J.G. Leptin acts via leptin receptor-expressing lateral hypothalamic neurons to modulate the mesolimbic dopamine system and suppress feeding. Cell Metabolism. 2009;10(2):89–98. doi: 10.1016/j.cmet.2009.06.011. [DOI] [PMC free article] [PubMed] [Google Scholar]
- 41.Munzberg H., Jobst E.E., Bates S.H., Jones J., Villanueva E., Leshan R. Appropriate inhibition of orexigenic hypothalamic arcuate nucleus neurons independently of leptin receptor/STAT3 signaling. Journal of Neuroscience. 2007;27(1):69–74. doi: 10.1523/JNEUROSCI.3168-06.2007. [DOI] [PMC free article] [PubMed] [Google Scholar]
- 42.Wilson B.D., Bagnol D., Kaelin C.B., Ollmann M.M., Gantz I., Watson S.J. Physiological and anatomical circuitry between Agouti-related protein and leptin signaling. Endocrinology. 1999;140(5):2387–2397. doi: 10.1210/endo.140.5.6728. [DOI] [PubMed] [Google Scholar]
- 43.Cheung C.C., Clifton D.K., Steiner R.A. Proopiomelanocortin neurons are direct targets for leptin in the hypothalamus. Endocrinology. 1997;138(10):4489–4492. doi: 10.1210/endo.138.10.5570. [DOI] [PubMed] [Google Scholar]
- 44.Thornton J., Cheung C.C., Clifton D.K., Steiner R.A. Regulation of hypothalamic proopiomelanocortin mRNA by leptin in ob/ob mice. Endocrinology. 1997;138(11):5063–5066. doi: 10.1210/endo.138.11.5651. [DOI] [PubMed] [Google Scholar]
- 45.Cone R.D., Cowley M.A., Butler A.A., Fan W., Marks D.L., Low M.J. The arcuate nucleus as a conduit for diverse signals relevant to energy homeostasis. International Journal of Obesity and Related Metabolic Disorders: Journal of the International Association for the Study of Obesity. 2001;25(Suppl. 5):S63–S67. doi: 10.1038/sj.ijo.0801913. [DOI] [PubMed] [Google Scholar]
- 46.Perello M., Scott M.M., Sakata I., Lee C.E., Chuang J.C., Osborne-Lawrence S. Functional implications of limited leptin receptor and ghrelin receptor coexpression in the brain. Journal of Comparative Neurology. 2012;520(2):281–294. doi: 10.1002/cne.22690. [DOI] [PMC free article] [PubMed] [Google Scholar]
- 47.Louis G.W., Leinninger G.M., Rhodes C.J., Myers M.G., Jr. Direct innervation and modulation of orexin neurons by lateral hypothalamic LepRb neurons. Journal of Neuroscience: the Official Journal of the Society for Neuroscience. 2010;30(34):11278–11287. doi: 10.1523/JNEUROSCI.1340-10.2010. [DOI] [PMC free article] [PubMed] [Google Scholar]
- 48.Quennell J.H., Mulligan A.C., Tups A., Liu X., Phipps S.J., Kemp C.J. Leptin indirectly regulates gonadotropin-releasing hormone neuronal function. Endocrinology. 2009;150(6):2805–2812. doi: 10.1210/en.2008-1693. [DOI] [PMC free article] [PubMed] [Google Scholar]
- 49.Kim J.G., Suyama S., Koch M., Jin S., Argente-Arizon P., Argente J. Leptin signaling in astrocytes regulates hypothalamic neuronal circuits and feeding. Nature Neuroscience. 2014;17(7):908–910. doi: 10.1038/nn.3725. [DOI] [PMC free article] [PubMed] [Google Scholar]
- 50.Lord G.M., Matarese G., Howard J.K., Baker R.J., Bloom S.R., Lechler R.I. Leptin modulates the T-cell immune response and reverses starvation-induced immunosuppression. Nature. 1998;394(6696):897–901. doi: 10.1038/29795. [DOI] [PubMed] [Google Scholar]
- 51.Flak J.N., Patterson C.M., Garfield A.S., D'Agostino G., Goforth P.B., Sutton A.K. Leptin-inhibited PBN neurons enhance counter-regulatory responses to hypoglycemia in negative energy balance. Nature Neuroscience. 2014 Dec;17(12):1744–1750. doi: 10.1038/nn.3861. http://dx.doi.org/10.1038/nn.3861 [Epub 2014 Nov 10]. PMID: 25383904. [DOI] [PMC free article] [PubMed] [Google Scholar]
- 52.Elias C.F., Kelly J.F., Lee C.E., Ahima R.S., Drucker D.J., Saper C.B. Chemical characterization of leptin-activated neurons in the rat brain. Journal of Comparative Neurology. 2000;423(2):261–281. [PubMed] [Google Scholar]
- 53.Maolood N., Meister B. Dynorphin in pro-opiomelanocortin neurons of the hypothalamic arcuate nucleus. Neuroscience. 2008;154(3):1121–1131. doi: 10.1016/j.neuroscience.2008.04.011. [DOI] [PubMed] [Google Scholar]
- 54.Leibowitz S.F. Overconsumption of dietary fat and alcohol: mechanisms involving lipids and hypothalamic peptides. Physiology & Behavior. 2007;91(5):513–521. doi: 10.1016/j.physbeh.2007.03.018. [DOI] [PMC free article] [PubMed] [Google Scholar]
- 55.Langlet F., Levin B.E., Luquet S., Mazzone M., Messina A., Dunn-Meynell A.A. Tanycytic VEGF-A boosts blood-hypothalamus barrier plasticity and access of metabolic signals to the arcuate nucleus in response to fasting. Cell Metabolism. 2013;17(4):607–617. doi: 10.1016/j.cmet.2013.03.004. [DOI] [PMC free article] [PubMed] [Google Scholar]
Associated Data
This section collects any data citations, data availability statements, or supplementary materials included in this article.