


Abstract
Objective
Insulin resistance can be triggered by enhanced dephosphorylation of the insulin receptor or downstream components in the insulin signaling cascade through protein tyrosine phosphatases (PTPs). Downregulating density-enhanced phosphatase-1 (DEP-1) resulted in an improved metabolic status in previous analyses. This phenotype was primarily caused by hepatic DEP-1 reduction.
Methods
Here we further elucidated the role of DEP-1 in glucose homeostasis by employing a conventional knockout model to explore the specific contribution of DEP-1 in metabolic tissues. Ptprj−/− (DEP-1 deficient) and wild-type C57BL/6 mice were fed a low-fat or high-fat diet. Metabolic phenotyping was combined with analyses of phosphorylation patterns of insulin signaling components. Additionally, experiments with skeletal muscle cells and muscle tissue were performed to assess the role of DEP-1 for glucose uptake.
Results
High-fat diet fed-Ptprj−/− mice displayed enhanced insulin sensitivity and improved glucose tolerance. Furthermore, leptin levels and blood pressure were reduced in Ptprj−/− mice. DEP-1 deficiency resulted in increased phosphorylation of components of the insulin signaling cascade in liver, skeletal muscle and adipose tissue after insulin challenge. The beneficial effect on glucose homeostasis in vivo was corroborated by increased glucose uptake in skeletal muscle cells in which DEP-1 was downregulated, and in skeletal muscle of Ptprj−/− mice.
Conclusion
Together, these data establish DEP-1 as novel negative regulator of insulin signaling.
Keywords: Density-enhanced phosphatase-1, Glucose homeostasis, Insulin signaling, Insulin resistance, Phosphorylation
Abbreviations: DEP-1, density-enhanced phosphatase-1; GTT, glucose tolerance test; HFD, high-fat diet; IL-6, interleukin 6; IR, insulin receptor; ITT, insulin tolerance test; KO, knockout; LFD, low-fat diet; MCP-1, monocyte chemotactic protein-1; PTP, protein tyrosine phosphatase; RER, respiratory exchange ratio; RTK, receptor tyrosine kinase; WT, wild-type
1. Introduction
The vast majority of worldwide diabetes cases are related to type 2 diabetes, which is characterized by insulin resistance and hyperglycemia [1]. Insulin resistance, a state of impaired action of insulin on insulin-responsive tissues, such as skeletal muscle, liver, and fat, is critically associated with hypertension, atherosclerosis, hyperlipidemia, and, in turn, cardiovascular disease [2,3]. Obesity can promote and has been associated with insulin resistance [4].
Insulin exerts its function via ligating the insulin receptor (IR), a transmembrane receptor tyrosine kinase (RTK). Insulin binding is followed by activation of the IR's cytosolic kinase activity, leading to both auto- and substrate phosphorylation, and activation of several downstream signaling mediators, including phosphatidylinsositol-3-kinase (PI3K), Akt, and Ras/MAP kinase. Involving the signaling molecule Akt, cells translocate the glucose transporter GLUT4 to the membrane in adipose tissue and skeletal muscle for glucose uptake, resulting in reduced blood glucose [5]. Among other causes, insulin resistance was shown to involve reduced PI3K/Akt activation [2].
Key regulators of IR signaling are protein tyrosine phosphatases (PTPs). PTPs dephosphorylate phosphotyrosine residues of the IR, tightly regulating the activation status and subsequent signaling events. “Classical PTPs”, a cysteine-based enzyme subgroup with strict phosphotyrosine-specificity, share the catalytic signature motif V/I-H-C-S-X-G [6]. Interestingly, PTP activity in insulin-sensitive tissues was found elevated in obese subjects [7], while weight loss significantly reduced PTP activity [8,9]. Among the 38 classical PTPs, only a subset of these phosphatases has been identified that target the IR kinase [10–12]. A prominent negative regulator of IR signaling is PTP1B (PTPN1) [13,14]. PTP1B targets and dephosphorylates the IR at the sites pY1162/pY1163, thus diminishing IR activity, insulin signaling and metabolic action [13–15]. Transgenic overexpression of PTP1B in muscle resulted in insulin resistance [16], while increased PTP1B levels were observed in insulin-resistant humans and rodents in adipose tissue and skeletal muscle [17,18]. An inducible liver-specific PTP1B knockdown improved both lipid homeostasis and glucose tolerance in mice subjected to high-fat diet (HFD) [19]. The expression of the leukocyte common antigen-related phosphatase (LAR, PTPRF) was shown to be increased in skeletal muscle of insulin-resistant rodents/humans [8,20–22], and overexpression of LAR in mouse skeletal muscle reduced insulin signaling and glucose uptake, leading to insulin resistance [21]. Src homology region 2 domain-containing phosphatase-1 (SHP-1, PTPN6) interferes with insulin signaling, and mice deficient for SHP-1 displayed improved IR signaling in skeletal muscle and liver [11]. Furthermore, targeting low molecular weight protein tyrosine phosphatase (LM-PTP, ACP1) also improved insulin sensitivity [23]. In contrast, muscle-specific knockout of the cytoplasmic T-Cell PTP (TC-PTP, PTPN2) failed to result in a metabolic phenotype and did not affect the development of insulin resistance in mice subjected to HFD-induced obesity [24]. These findings substantiate the notion that only specific PTPs are of regulatory importance for IR activation and insulin signaling.
DEP-1/PTPRJ (also named CD148) is an ubiquitously expressed transmembrane, receptor-like PTP, initially linked to mechanisms of contact inhibition in cell growth [25], which was later implicated in a number of physiological and pathological processes. For example, a role of DEP-1 has been established for thrombocyte function [26,27] and in determining neointima formation after catheter-induced vascular injury [28]. Signaling of various different RTKs is negatively regulated by DEP-1, including the hepatocyte growth factor receptor c-Met [29], and the platelet-derived growth factor receptor beta [28,30]. We recently identified DEP-1 as being upregulated in obese mice; DEP-1 was found being translocated to close proximity of the IR in liver tissues upon insulin challenge in situ [31], and recombinant DEP-1 dephosphorylated the IR in vitro [31,32]. Furthermore, antisense oligonucleotides against DEP-1, primarily downregulating DEP-1 in liver, improved insulin sensitivity, and reduced basal glucose level and body weight [31]. These findings suggested DEP-1 as a novel physiological regulator of IR signaling, and elevated expression of DEP-1 in insulin-responsive tissues as a possible pathophysiological mechanism for insulin resistance. In the present study, we sought to further elucidate the role of DEP-1 in insulin signaling and glucose homeostasis employing a DEP-1 deficient mouse strain.
2. Materials and methods
2.1. Animal model
Heterozygous C57BL/6-Ptprj mice were purchased from Deltagen (San Mateo, CA). Male littermates characterized as wild-type or Ptprj−/− were included in the experiment aged 4–6 weeks and divided into four groups: wild-type (n = 8) and Ptprj−/− mice (n = 8) fed ad libitum a low-fat diet (LFD) (10% kcal from fat; Brogaarden, Gentofte, Denmark; D12450B) and wild-type (n = 10) and Ptprj−/− mice (n = 10) fed ad libitum a high-fat diet (HFD) (60% kcal from fat; Brogaarden; D12492) to induce insulin resistance [33] for 12 weeks. Specific dietary information is provided in Supplementary Table 1. Animals were housed in groups with a 12 h light and 12 h dark cycle (lights on at 06:00 a.m., lights off at 06:00 p.m.). For analysis of ex vivo insulin signaling, insulin (10 U/kg) (Insuman® Rapid, Sanofi Aventis, Berlin, Germany) was injected intravenously 2 min before mice were sacrificed. Afterwards organs were excised, weighed, shock-frozen in liquid nitrogen and stored at −80 °C until further use. The study was conducted in accordance with the Principles of Laboratory Care and approved by the Landesamt für Gesundheit und Soziales (LAGeSo, Berlin, Germany).
2.2. Metabolic phenotyping (body weight, LabMaster, GTT, ITT, ELISA, blood pressure)
Body weight was measured twice weekly throughout the study. Food intake, respiratory exchange ratio (RER), and locomotor activity were measured using an indirect calorimetry system (LabMaster, TSE Systems; Bad Homburg, Germany) starting after the first 8 weeks of feeding. Mice were placed in the calorimetry systems for 24 h. Measurements were taken both over the entire 24 h period and during defined time periods, as outlined in the figure legends. An intraperitoneal insulin tolerance test (ITT) using a dose of 0.5 U/kg insulin (Insuman® Rapid, Sanofi Aventis, Berlin, Germany) and an intraperitoneal glucose tolerance test (GTT) with 1 g/kg glucose (Glucosteril, Fresenius, Bad Homburg, Germany) were carried out in 4 h and 12 h fasted mice, respectively. Tail vein blood was used for measuring glucose concentration with a glucometer (Precision Xceed, Abbott, Wiesbaden, Germany) at time points indicated. Before animals were sacrificed, serum was isolated from blood for measurement of insulin, leptin, resistin, monocyte chemotactic protein-1 (MCP-1) and interleukin 6 (IL-6) concentration by Milliplex ELISA according the manufacturer's instructions (Millipore, Schwalbach, Germany). Only valid values above the detection limit were used in the analyses, and numbers of included animals per parameter are stated in the figure legend. Systolic blood pressure was recorded by tail-cuff measurements (Power Lab 4/20 with tail-cuff MLT125/M, both from ADInstruments, Spechbach, Germany). For each mouse between three and eight separate blood pressure values were recorded within a period of 20–60 min between 09:00 a.m. and 12:00 p.m., and the mean was calculated for each mouse and group.
2.3. Protein tyrosine phosphatase activity
Activity of DEP-1 by using a radioactive labeled peptide was measured after immunoprecipitation with anti-DEP-1 (AF1934, 1 μg per condition, R&D Systems, Wiesbaden, Germany) in different metabolic tissues as described elsewhere in Ref. [31]. In order to minimize potential in vitro-induced oxidation of PTPs and to determine total DEP-1 activity as a measure of DEP-1 expression, analyses were performed including addition of 50 mM dithiothreitol (DTT) to immunoprecipitates.
2.4. Quantitative real-time PCR (qRT-PCR)
RNA was isolated using the RNeasy Mini Kit (Qiagen, Hilden, Germany) following the manufacturer's instruction for purification from cells and tissue (soleus skeletal muscle). Synthesis of cDNA was performed with SuperScript®II (Invitrogen, Karlsruhe, Germany). RT-PCR was performed with SybrGreen (Applied Biosystems, Darmstadt, Germany) in duplicate per condition. The expression of analyzed genes was normalized to the average expression of the housekeeping gene Rn18s. The following primer sequences (final concentrations 100 nmol/l) were used (forward and reverse, respectively): Rn18s 5′-GGACTCTTTCGAGGCCCTGTA-3′, 5′-CACCAGACTTGCCCTCCAAT-3′; Ptprj 5′-GCAGTGTTTGGATGTATCTTT-3′, 5′-CTTCATTATTCTTGGCATCTGT-3′; Slc2a1 5′-GCAGTTCGGCTATAACACTGG-3′, 5′-GCGGTGGTTCCATGTTTGATTG-3′; Slc2a4 5′-GTGACTGGAACACTGGTCCTA-3′, 5′-CCAGCCACGTTGCATTGTAG-3′; Insr 5′-C-AATGGGACCACTGTATGCATCT-3′, 5′-ACTCGTCCGGCACGTACAC-3′; Ptpn1 5′-CGGGAGGTCAGGGACCTT-3′, 5′-GGGTCTTTCCTCTTGTCCATCA-3′; Ptpn6 5′-CGTACCCTCCCGCTGTGA-3′, 5′-TTTTCGTACACCTCCTCCTTGTG-3′; Bax 5′-TGAAGACAGGGGCCTTTTTG-3′, 5′-AATTCGCCGGAGACACTCG-3′; Bcl2 5′-CCTGTGGATGACTGAGTACCTGAA-3′, 5′-CTACCCAGCCTCCGTTATCCT-3′.
2.5. Immunoblotting
Preparation of protein lysates and wheat germ agglutinin precipitation (for DEP-1 expression analyses) were performed as described in Ref. [31]. Immunoblotting was done by standard protocols with primary antibodies: anti-phospho insulin receptor (IR) Y 972 (ab5678, 1:5000), anti-phospho IR Y 1158 (ab78355, 1:1000), anti-phospho IR Y 1361 (ab60946, 1:1000) (Abcam, Cambridge, UK), anti-DEP-1 (AF1934, 1:1000 of 1 μg/μl dilution, R&D Systems, Wiesbaden, Germany), anti-phospho Akt (#4060, 1:2000, Ser 473), anti-phospho Akt (#9275, 1:2000, Thr 308), anti-pan Akt (#9272, 1:1000) and anti-IR (#3025, 1:1000, 4B8) (Cell Signaling/New England Biolabs, Frankfurt, Germany). Secondary antibodies used were: HRP-linked anti-rabbit (NA934, 1:10,000, GE Healthcare), HRP-linked anti-goat (P 0160, 1:2000, Dako). Densitometric analyses were performed using ImageJ 1.46r.
2.6. Cell culture and siRNA transfection
C2C12 myoblasts were purchased from the American Type Culture Collection (ATCC®, Wesel, Germany) and maintained in DMEM containing 10% FBS and 1% penicillin/streptomycin at 37 °C in an atmosphere of 95% air and 5% CO2. Differentiation to myotubes was induced when myoblasts reached 90% confluence by using DMEM containing 2% horse serum and 1% penicillin/streptomycin. The culture medium was refreshed daily until polynucleated myotubes were obtained after 6 d. Transfection was carried out using 10 nmol/l siRNA against DEP-1 (Thermo Fisher Scientific, Bonn, Germany), and Lipofectamine® RNAiMAX (Invitrogen, Karlsruhe, Germany) for 72 h according to the manufacturer's recommendations. Cells transfected with non-targeting siRNA served as control.
2.7. Glucose uptake in cells
Myotubes were transfected and left resting for 48 h followed by serum-free starvation overnight. Cells were incubated for 1 h in glucose deficient medium. Insulin (100 nmol/l) was added for 15 min followed by addition of deoxy-d-glucose (Sigma, Taufkirchen, Deutschland) and 1 μCi/ml deoxy-d-glucose, 2-[1,2–3H (N)] (PerkinElmer, Rodgau, Germany) at a final concentration of 100 μmol/l for 30 min. The uptake was stopped by two washing steps with PBS, and cell lysis was carried out in 50 mmol/l NaOH. Uptake of radioactively labelled glucose was measured in a scintillation counter. Results were normalized to unstimulated cells transfected either with non-targeting siRNA or DEP-1 siRNA, and are presented as percent of the corresponding treatment procedure.
2.8. Glucose uptake in muscle tissue
Paired soleus muscles were dissected in deep anesthesia (Ketamin/Xylazine 100 mg/kg/12 mg/kg) and subsequently placed in glass-vials for two incubation steps with continuous shaking in a heated (35 °C) water bath. One muscle from each pair was incubated without insulin (basal), and the contralateral muscle was incubated with 5 mU/ml insulin during both incubation steps. First, muscles were incubated in glass vials containing 0.5 ml of pregassed Krebs-Henseleit buffer (KHB; 95% O2-5% CO2 for 15 min at 4 °C) supplemented with 0.1% bovine serum albumin, 2 mM sodium pyruvate, 6 mM mannitol, and 0 (basal), or 5 mU/ml insulin for 30 min. After the initial equilibration step, each muscle was transferred to a second glass vial containing 0.5 ml of KHB–BSA solution supplemented with 2 mM sodium pyruvate, the same insulin concentration used in the previous step, 1 mM 2-deoxyglucose (2-DG) (including a final specific activity of 2.25 mCi/mmol 2-deoxy-[3H]glucose), and 6 mM mannitol (including a final specific activity of 0.022 mCi/mmol [14C]mannitol) for 15 min. Thereafter, muscles were rapidly blotted on filter paper moistened with ice-cold KHB–BSA, trimmed, freeze-clamped in liquid nitrogen and stored at −80 °C for later processing and analysis. Frozen muscles used for glucose uptake were weighed and homogenized in 0.3 M perchloric acid for 3 × 4 min. Homogenates were incubated for 10 min at 95 °C, centrifuged for 15 min at 15,000 g to remove insoluble material. 3H and 14C disintegrations per minute were measured by a liquid scintillation counter and 2-DG uptake was calculated as described in Ref. [34].
2.9. Islets studies
Frozen pancreas sections (5 μm) were mounted on SuperFrost Plus slides (R. Langenbrinck, Emmendingen, Germany). Sections were immunostained with primary anti-insulin antibody (MOB234, 1:200, BIOTREND Chemikalien GmbH, Cologne, Germany), with a biotinylated secondary antibody (anti-mouse, E0464, 1:1000; Dako, Hamburg, Germany) and by using the Vectastain ABC kit PK-6100 (Vector, Burlingame, CA, USA), the peroxidase kit ARK (Dako, Hamburg, Germany), and AEC solution (Sigma, Taufkirchen, Deutschland), and were counterstained with hematoxylin. The relative area of beta cells was determined as the percentage of pancreatic area occupied by insulin immunoreactive cells. Images of stained sections were analyzed using ImageJ 1.48.
2.10. Statistical analysis
Statistical differences between the groups were determined using two-way ANOVA analysis as well as the non-parametric Mann–Whitney U test and the parametric unpaired Student's t test using SPSS Statistics 21. The data are expressed as means ± SEM, and p < 0.05 was considered statistically significant.
3. Results
3.1. DEP-1 expression in metabolic tissues and characterization of Ptprj−/− mice
The expression of DEP-1 was analyzed in liver, skeletal muscle and adipose tissue from wild-type mice applying activity measurements under reducing conditions, as outlined in the Materials and methods section. The results revealed DEP-1 being five-fold higher expressed in adipose tissue and eight-fold higher expressed in liver compared to DEP-1 skeletal muscle (Figure 1A). After genotyping, activity assays along with immunoblotting were applied to confirm the absence of DEP-1 in Ptprj−/− mice (Figure 1B–D). As shown, DEP-1 protein and activity were undetectable in liver tissue of knockout mice.
Figure 1.
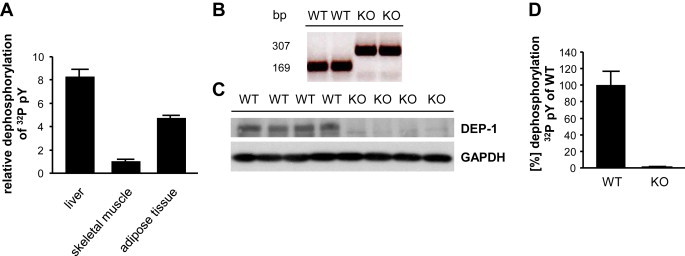
DEP-1 expression and genotyping of wild-type and Ptprj−/− mice. (A) DEP-1 expression based on activity measurements under reduced conditions (as outlined in the Materials and Methods section) in metabolic tissues derived from wild-type mice. (B) Wild-type and Ptprj−/− mice were characterized by PCR. (C, D) Confirmation of DEP-1 knockout in liver tissue visualized by immunoblotting and DEP-1 activity measurements (n = 3–4 mice per genotype).
3.2. Enhanced insulin sensitivity in Ptprj−/− mice
We first assessed the effect DEP-1 deficiency on body weight under either LFD or HFD for 8 weeks, which represented the time period before metabolic phenotyping was performed. As depicted in Figure 2A only a slight decrease in body weight in Ptprj−/− mice was detectable in both diets compared to wild-type mice, which did not reach statistical significance. Knockout of DEP-1 had no influence on heart-, kidney-, liver- and spleen weight, neither at LFD nor at HFD, while perirenal fat was lower in LFD fed Ptprj−/− mice (Supplementary Table 2). Epididymal fat weight was significantly higher in Ptprj−/− mice after HFD.
Figure 2.
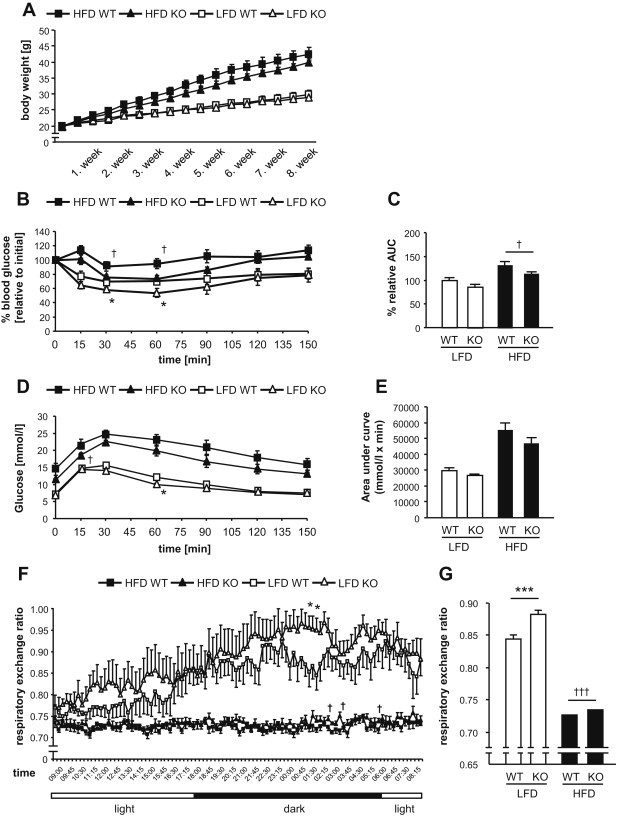
Metabolic phenotyping of wild-type and Ptprj−/− mice. (A) Body weight of mice was determined twice weekly over 8 weeks. (B,C) ITT was performed after 4 h fasting and the AUC was calculated. (D,E) GTT was conducted after 12 h fasting and corresponding AUC was calculated (n = 8–10 mice per genotype). LFD WT vs. LFD Ptprj KO *p < 0.05; HFD WT vs. HFD Ptprj KO †p < 0.05. (F) Respiratory exchange ratio determined over 24 h and (G) mean of data recorded every 15 min (n = 6–10 mice per genotype). LFD WT vs. LFD Ptprj KO *p < 0.05, ***p < 0.001; HFD WT vs. HFD Ptprj KO †p < 0.05, †††p < 0.001.
Metabolic phenotyping was performed to evaluate the consequence of DEP-1 deletion on insulin sensitivity. Wild-type and Ptprj−/− mice on LFD and HFD were subjected to an ITT and GTT. Insulin sensitivity in Ptprj−/− mice was improved per se and was even more pronounced in HFD fed mice (Figure 2B,C). Ptprj−/−-HFD mice were also characterized by lower HOMA indices compared to wild-type littermates (not shown). Further, glucose homeostasis was improved in Ptprj−/− mice, indicated by reduced glucose levels measured at individual time points after glucose injection in both LFD- and HFD fed mice (Figure 2D,E). Notably, glucose levels of Ptprj−/−-HFD mice were lower from the beginning and values in the control mice were higher at any time point after insulin injection.
In addition, mice were monitored for parameters of energy metabolism. RER, locomotor activity, and food intake were recorded (Figure 2F,G, Supplementary Figure 1A–J). Mice fed HFD showed lower RER and reduced motility compared with LFD fed mice. DEP-1 knockout resulted in increased RER in mice fed both diets, suggesting a higher utilization of carbohydrates (Figure 2F,G). No statistical difference in motility between Ptprj−/− and wild-type mice was detected, and food intake also remained unchanged (Supplementary Figure 1A–J).
Taken together, Ptprj−/− mice showed an improved metabolic phenotype with mildly enhanced glucose tolerance, higher RER, and decreased insulin resistance under HFD.
3.3. Ptprj−/− mice show increased phosphorylation levels in insulin signaling components in metabolic tissues
The metabolic findings suggested a role of DEP-1 as negative regulator of insulin signaling. To directly assess this possibility, key intermediates of the insulin signaling pathway were analyzed in liver, skeletal muscle and adipose tissue of Ptprj−/− mice after insulin challenge in vivo. Different IR tyrosine-phosphorylation sites were monitored by immunoblotting analysis. As a key event downstream of IR activation, we further assessed Akt phosphorylation at the two sites Thr308 and Ser473.
In liver tissue, we detected a tendency of enhanced IR phosphorylation after insulin challenge in Ptprj−/− mice, however, without any evidences of site-selectivity (Figure 3A). Moreover, we detected a significant increase in insulin-induced Akt phosphorylation at site Ser473 in Ptprj−/− mice both for the LFD and the HFD feeding group (Figure 3A–C). The Akt phosphorylation at Thr308 was reduced in the HFD group, however without any impact of DEP-1 deficiency (Figure 3D,E).
Figure 3.
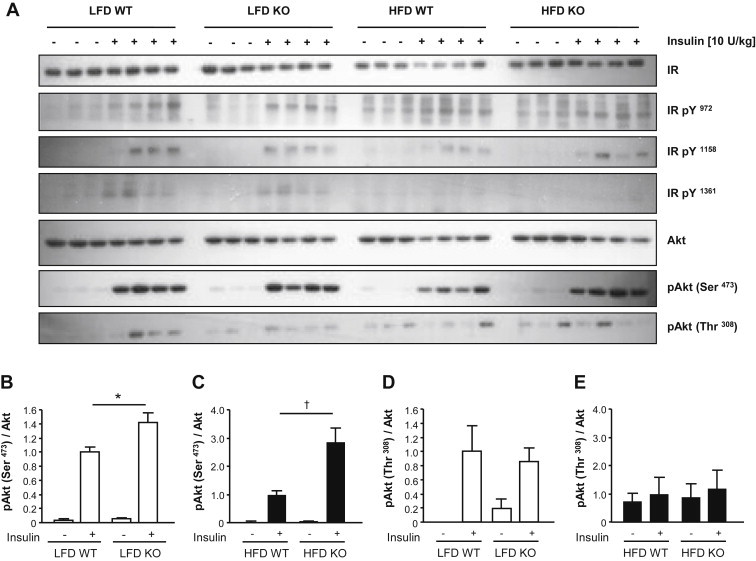
Insulin signaling in the liver. (A) Tyrosine-phosphorylation levels of different insulin receptor (IR) and Akt phosphorylation sites were analyzed by immunoblotting. (B–E) Densitometric analyses of Akt phosphorylation at sites Ser473 and Thr308. Quantification was performed with all visualized mouse samples from all individual groups, with n = 3 without insulin challenge and n = 4 with insulin challenge. LFD WT vs. LFD Ptprj KO *p < 0.05; HFD WT vs. HFD Ptprj KO †p < 0.05.
The same parameters were also assessed in skeletal muscle (Figure 4) and adipose tissue (Figure 5). IR phosphorylation after insulin challenge in skeletal muscle was – in general – slightly increased in Ptprj−/− mice in both LFD and HFD groups. All analyzed sites appeared affected to a similar extent. Very pronounced was the detection of increased Akt phosphorylation in skeletal muscle of Ptprj−/− mice at both sites (Thr308, Ser473) and in both diets (Figure 4A–E) as compared with liver tissue (Figure 3B–E) and adipose tissue (Figure 5B–E). These results might point towards a more prominent role of DEP-1 in glucose metabolism in skeletal muscle. In adipose tissue, significantly higher phosphorylation levels of Akt at both sites (Thr308, Ser473) were observed in insulin challenged HFD fed Ptprj−/− mice (Figure 5A, C, E).
Figure 4.
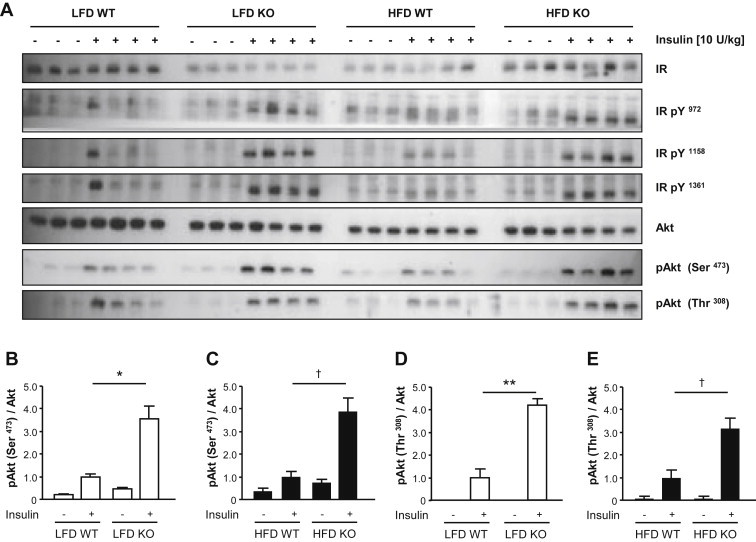
Insulin signaling in the skeletal muscle. (A) Tyrosine-phosphorylation levels of different IR and Akt phosphorylation sites were analyzed by immunoblotting. (B–E) Densitometric analyses of Akt phosphorylation at sites Ser473 and Thr308. Quantification was performed with all visualized mouse samples from all individual groups, with n = 3 without insulin challenge and n = 4 with insulin challenge. LFD WT vs. LFD Ptprj KO *p < 0.05, **p < 0.01; HFD WT vs. HFD Ptprj KO †p < 0.05.
Figure 5.
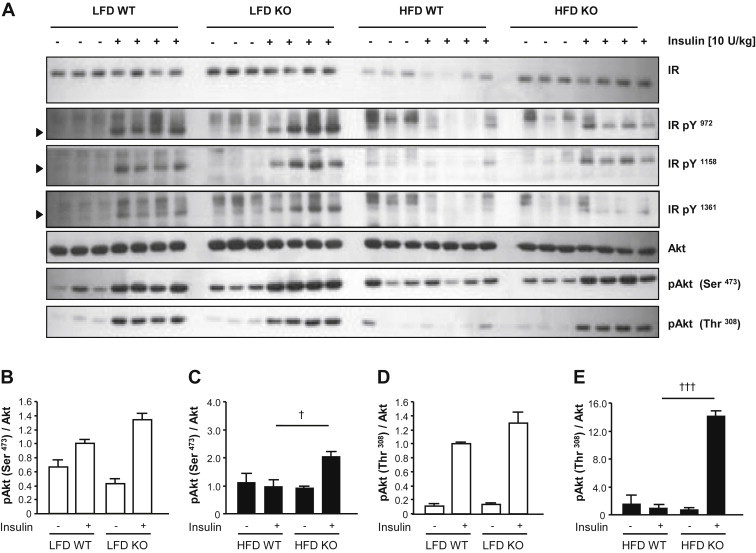
Insulin signaling in adipose tissue. (A) Tyrosine-phosphorylation levels of different IR and Akt phosphorylation sites were analyzed by immunoblotting. Arrows indicate the phosphorylated IR. (B–E) Densitometric analyses of Akt phosphorylation at sites Ser473 and Thr308. Quantification was performed with all visualized mouse samples from all individual groups, with n = 3 without insulin challenge and n = 4 with insulin challenge. HFD WT vs. HFD Ptprj KO †p < 0.05, †††p < 0.001.
Thus, DEP-1 deficiency leads to enhanced insulin signaling shown by higher Akt phosphorylation.
3.4. Increased glucose uptake in skeletal muscle
The improvement of insulin sensitivity and glucose tolerance, as well as increased phosphorylation levels of Akt in Ptprj−/− mice, notably in skeletal muscle, strongly suggested a cell-autonomous role of DEP-1 for negative regulation of insulin signaling. To confirm the presumed regulatory function, we first assessed insulin-stimulated glucose uptake in cultured skeletal muscle cells in vitro. DEP-1 depletion in these cells was performed by siRNA-mediated downregulation. To confirm the efficiency of DEP-1 depletion we analyzed transcript levels of DEP-1. We achieved a downregulation of ∼77%, which was not counter-regulated by changes in PTP1B and IR transcripts (Figure 6A). Also, the gene expression of the glucose transporter (GLUT1 and GLUT4) was unaffected by DEP-1 downregulation (Figure 6A). The incorporation of [3H]-deoxy-d-glucose was measured, and DEP-1 depleted skeletal muscle cells stimulated with insulin showed significantly increased glucose uptake as compared with cells transfected with non-targeting siRNA (Figure 6B).
Figure 6.
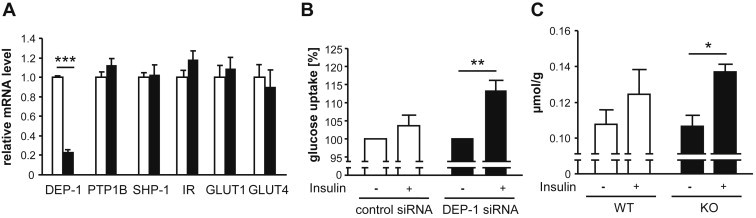
Glucose uptake in muscle. (A) Transcript analysis by quantitative real-time PCR of transfected myotubes with non-targeting siRNA and siRNA against DEP-1. The data are represented as means ± SEM of three independent experiments. (B) Glucose uptake was performed in C2C12 cells with or without DEP-1 downregulation. Data are expressed as means ± SEM, and based on unstimulated conditions. (C) Glucose uptake in isolated soleus muscle from WT and Ptprj KO mice subjected to insulin (n = 5–7 per genotype). *p < 0.05, **p < 0.01, ***p < 0.001.
We then assessed glucose uptake using isolated soleus muscle for ex vivo analyses. These experiments revealed that insulin stimulation in skeletal muscle derived from Ptprj−/− mice resulted in a more pronounced stimulation of 2-DG uptake as compared with wild-type tissues (Figure 6C). While in wild-type animals there was only a trend of increased 2-DG uptake with insulin, this effect became significant in the knockout tissues, which was not due to differences in GLUT1 and GLUT4 gene expression in the soleus muscle between wild-type and Ptprj−/− mice (data not shown). These findings are consistent with the improved GTT in Ptprj−/− mice.
3.5. DEP-1 knockout affects serum parameters and blood pressure
In addition to the improved metabolic phenotype, serum parameters were also analyzed to assess a potential impact of DEP-1 deficiency (Figure 7A–E). Leptin, shown to be elevated in obesity, was significantly reduced in Ptprj−/− mice at both LFD and HFD compared to wild-type animals. Serum IL-6 and insulin levels appeared lower in Ptprj−/− mice under HFD, yet these differences were not statistically significant.
Figure 7.
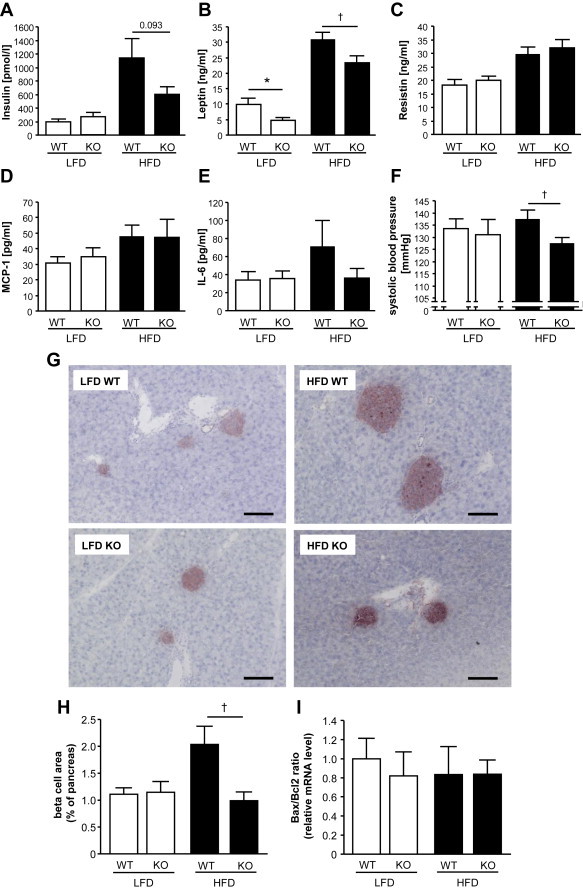
Serum parameters, blood pressure and morphometric pancreatic beta cell- and apoptosis analyses. (A–E) Serum parameters of insulin (n = 7–9 mice per genotype), leptin (n = 8–9 mice per genotype), resistin (n = 8–9 mice per genotype), MCP-1 (n = 7–9 mice per genotype) and IL-6 (n = 3–6 mice per genotype) were determined by Milliplex ELISA. (F) Systolic blood pressure was measured non-invasively (n = 8–10 per genotype). LFD WT vs. LFD Ptprj KO *p < 0.05; HFD WT vs. HFD Ptprj KO †p < 0.05. (G) Representative images of immunostained pancreatic sections showing insulin-positive cells. Scale bars represent 100 μm. (H) Pancreas beta cell area was analyzed morphometrically from LFD- and HFD WT, and LFD- and HFD Ptprj KO mice (n = 8–10 per group). (I) The ratio of Bax/Bcl2 in the pancreas was determined by quantitative real-time PCR analysis in all animal groups (n = 7–9 mice per genotype), and was normalized to the expression of Rn18s. HFD WT vs. HFD Ptprj KO †p < 0.05.
Resistin and MCP-1, adipokines relevant for progression of insulin resistance, were not affected by DEP-1 knockout, but showed a characteristic HFD-induced increase. Furthermore, HFD fed Ptprj−/− mice were characterized by significantly reduced systolic blood pressure, recorded during the day time, compared to wild-type mice (Figure 7F).
Interestingly, we detected a significantly reduced beta cell area in the pancreas of HFD-treated knockout mice compared with wild-type littermates (Figure 7G,H). Such differences between the two genotypes were not detected in LFD fed mice. Importantly, pancreatic tissue from mice of both diets in WT and Ptprj−/− animals was not characterized by altered apoptosis, as revealed by measuring Bax/Bcl2 ratios (Figure 7I).
Taken together, Ptprj−/− mice appeared to have lower leptin levels, and deficiency in DEP-1 protected against HFD-induced pancreatic islet increase, consistent with lower insulin levels and the improved metabolic phenotype.
4. Discussion
As the main finding of this study, we could establish the transmembrane PTP DEP-1/PTPRJ as a novel regulator of insulin resistance in vivo. Ptprj−/− mice subjected to LFD or HFD exhibited an improved metabolic phenotype, demonstrated by an enhancement in insulin sensitivity, glucose tolerance, reduced leptin serum levels and an increased RER. In addition to the systemic effects, DEP-1 deficiency resulted also in enhanced insulin signaling in liver, skeletal muscle and adipose tissue. Moreover, we could show that blood pressure in Ptprj−/− mice fed an HFD was significantly reduced. Experiments with DEP-1 depleted skeletal muscle cells in vitro and soleus muscle from mice revealed increased glucose uptake.
A large body of evidence has shown that PTPs are substantially involved in type 2 diabetes and insulin resistance [12,35]. In particular, the role of PTP1B is well characterized by using different knockout models [10,13,14] demonstrating PTP1B−/− mice being resistant to HFD-induced insulin resistance. While the effects of DEP-1 deficiency observed in our study were clearly milder, overall DEP-1 seems to act in a manner comparable to PTP1B in this context, revealing some further redundancy in control of insulin signaling. Interestingly, DEP-1 levels were increased in HFD fed mice [31].
DEP-1 deficiency resulted in significantly enhanced insulin sensitivity. Basal fastened glucose levels were slightly, but not significantly lower in Ptprj−/− mice in both diets. While glucose tolerance was also improved at defined time points, however, this did only translate into a minor tendency towards lower AUC glucose levels. Effects on glucose challenge were not observed using antisense oligonucleotides against DEP-1 [31], which indicates the importance of complete DEP-1 deficiency in additional insulin sensitive tissues to observe this phenotype.
DEP-1 knockout in HFD fed mice resulted only in slightly reduced body weight. Ptprj−/− mice were characterized by more epididymal fat mass. This was in contrast to a decrease in body weight and a concomitant decrease in epididymal fat mass being observed in DEP-1 antisense oligonucleotides treated mice [31]. Counter-regulation of gene expression induced by complete DEP-1 depletion might be responsible for the increased epididymal fat mass. Nonetheless, improved insulin sensitivity is not mandatory associated with body weight reduction. The lack of impact of DEP-1 deficiency on body weight is reminiscent of mice with a tissue specific PTP1B depletion in muscle [36], adipocytes [37], or liver [38]. The latter mice were not affected in body weight but still showed increased insulin sensitivity. Further, insulin sensitization by glitazones is accompanied by increased fat mass caused by fat-redistribution [39,40], which may also explain decreases in liver weight in HFD fed Ptprj−/- mice.
Metabolic phenotyping performed by LabMaster analysis substantiated the improved phenotype in Ptprj−/− mice. In general, lower RER in the animal model used has previously been shown in mice subjected to HFD, demonstrating higher fat oxidation in combination with reduced carbohydrate consumption. In addition, RER has been shown to positively correlate with insulin sensitivity. Indeed, changes in both body composition and nutrient utilization closely impact on changes of the RER. In this regard, the observed increase in RER strongly suggests a direct result of the Ptprj knockout. Further, altered RER was associated with a slight, but insignificant increase of motility, whereas food intake in wild-type and knockout mice was unchanged in the individual diets. This was also evident when those time periods were sub-analyzed, where significant differences in RER were detected (12:00 a.m.–03:00 a.m. for LFD fed mice, and 03:00 a.m.–06:00 a.m. for HFD fed mice). These data underline the significant impact of DEP-1 and diet on energy substrate utilization, possibly due to changes in insulin signaling, associated with enhanced glucose oxidation.
No clear evidence of general or site-selective hyperphosphorylation in Ptprj−/− mice was detectable after insulin challenge. On the one hand, this is in line with the relatively low substrate specificity of DEP-1 in vitro described earlier in Ref. [41]. However, the kinetics by which PTPs regulate IR and IR-substrate-1 phosphorylation are transient and depend on the tissues analyzed. Potentially, time points other than 2 min after insulin injection would unravel altered IR phosphorylation in DEP-1 deficient mice in metabolic tissues. It is, however, likewise possible that the effect of DEP-1 deficiency mainly affects downstream events in insulin signaling rather than receptor phosphorylation itself.
Indeed, molecular evidence for the improved insulin resistance was obtained by increased downstream phosphorylation of Akt at the sites Ser473 and Thr308. In mice DEP-1 depletion resulted in a significant increase of insulin-induced Ser473 and Thr308 phosphorylation under HFD in the skeletal muscle and the adipose tissue, while in the liver only enhanced Ser473 phosphorylation was detectable in knockout mice (independent of diet). In addition, in LFD fed mice, significantly enhanced Ser473 and Thr308 phosphorylation was only detected in the skeletal muscle, while no differences were evident in adipose tissue, further suggesting tissue specificity. Even though the highest increase in Thr308 phosphorylation was seen in adipose tissue, differences between tissues should be interpreted with great caution, since protein isolation and blotting procedures may slightly vary. Moreover, the phosphorylation of both sites was suggested to be regulated independently [42,43], necessary for full kinase activity, and only in skeletal muscle an increase in both Ser473 and Thr308 phosphorylation in Ptprj−/− mice was detected in each diet.
We detected improved insulin resistance in Ptprj−/− mice being accompanied by reduced leptin levels in both LFD and HFD fed mice. This is in accordance with antisense oligonucleotide-induced DEP-1 reduction in HFD mice lowering leptin [31]. Elevated in obesity, leptin may contribute to obesity-associated hypertension and increased heart rate [44]. Furthermore, interaction of PTP1B, another crucial phosphatase in insulin signaling, with leptin signaling in the hypothalamus has been demonstrated [45,46]. While HFD fed wild-type mice had only slightly higher blood pressure, HFD fed Ptprj−/− mice were characterized by significantly reduced blood pressure, possibly driven, at least partly, by reduced serum leptin levels. In a similar way, also deletion of PTP1B has been shown to result in blood pressure reduction, substantiating PTPs crucially impacting on both metabolic parameters and cardiovascular regulation [47]. Fat mass is considered to be positively correlated with leptin levels. However, leptin concentration depends on the duration of HFD feeding in rodents and is independent of fat mass gain [48]. The reduced leptin levels in Ptprj−/− mice in both diets, however, might suggest a direct role of DEP-1 in leptin signaling. Blood pressure measurements were performed during the day time. Thus, potentially different nocturnal/diurnal regulation as well as a shift in mean arterial blood pressure distribution, which was demonstrated in obese PTP1B knockout mice [47], cannot be ruled out.
Insulin resistance is associated with expansion of beta cell mass. In accordance, HFD wild-type mice were characterized by increased pancreatic beta cell area, which was not accompanied by altered apoptosis, compared to lean LFD animals. While we did not measure insulin secretion during glucose challenge, lower basal insulin levels were detected in HFD-treated Ptprj−/− mice. This is in line with significantly reduced cross-sectional beta cell area, further supporting that DEP-1 deficiency attenuates insulin resistance.
Our results identified a metabolic role of DEP-1 in a conventional knockout model impacting insulin signaling (depicted in Figure 8) in lean and obese mice. It should be noted, however, that DEP-1 also functions as a tumor suppressor described in several cancer cells [49,50]. Despite this, Ptprj−/− mice used in our study were not characterized by spontaneous tumor growth or other obvious abnormalities, as also described by other investigators [50]. The function of DEP-1 as a negative regulator in insulin signaling previously shown in liver tissue [31] was further extended to the glucose utilizing tissues skeletal muscle and fat. Individual metabolic tissues, including skeletal muscle, adipose tissue, and liver contribute to the overall observed metabolic improvement in Ptprj−/− mice, and this phenotype seems not to be primarily based only on the skeletal muscle. Other factors may have influenced the demonstrated phenotype, since stronger metabolic effects could have been expected as a result of the enhanced insulin signaling in adipose tissue, skeletal muscle, and liver. The improvement of metabolic parameters in Ptprj−/− mice independent of the applied diet – with higher effects in obese mice – suggests that DEP-1 is, at least partly, a direct metabolic regulator. Together with increased glucose uptake and reduced blood pressure after DEP-1 depletion a broad range of cardiovascular-metabolic improvements were achieved. Therefore, DEP-1 might be a promising target for the treatment of insulin resistance as well as metabolic and cardiovascular disorders.
Figure 8.
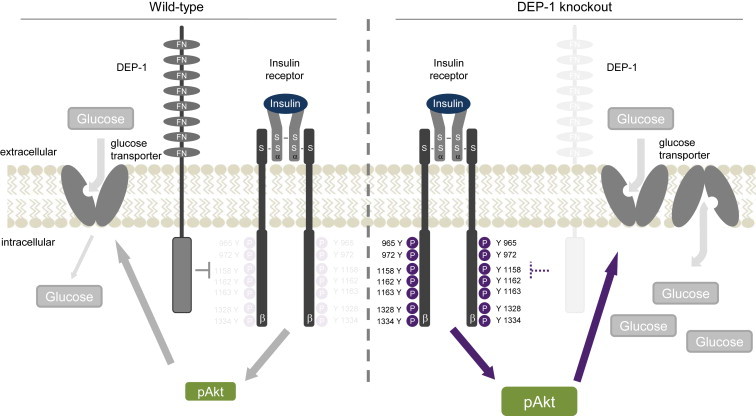
Schematic depiction of the role of DEP-1 in insulin signaling. DEP-1, a receptor-like protein tyrosine phosphatase, impacts on insulin signaling. DEP-1 comprises an eight fibronectin (FN)-like repeats-containing extracellular domain, a single transmembrane segment, and an intracellular catalytic domain with pure tyrosine affinity. Previously we demonstrated that DEP-1 is closely recruited to the insulin receptor in situ upon insulin challenge [31]. DEP-1 targets the insulin receptor, depicted as an inhibitory arrow, resulting in lower tyrosine phosphorylation at the intracellular domain of the receptor (shown as lower brightness). Applying a conventional knockout model, here we show that mice with genetic DEP-1 disruption (lower brightness and dotted inhibitory arrow) are characterized by improved insulin signaling, in particular evident by enhanced phosphorylation of the downstream signaling molecule Akt at sites Ser473 and Thr308. This ultimately leads to facilitated glucose uptake through glucose transporters (for mechanistic illustration two transporters are shown on the right hand side), suggesting DEP-1 as potential novel drug target in insulin resistance.
5. Conclusions
Insulin resistance represents the main factor for developing type 2 diabetes in obese patients. A better understanding of the underlying molecular mechanisms of insulin resistance is highly warranted due to the worldwide increase of type 2 diabetics. A subset of protein tyrosine phosphatases (PTPs) targets the insulin receptor and impacts on insulin sensitivity and metabolic disease. This study aimed at establishing the PTP DEP-1 as new negative regulator in insulin signaling. Taken together, here we report for the first time that a conventional knockout of DEP-1 results in an improved metabolic phenotype in mice, characterized in particular by enhanced insulin sensitivity and insulin signaling. Further, knockdown of DEP-1 in skeletal muscle cells leads to an increased insulin-induced glucose uptake. Our findings support the notion of DEP-1 as a novel negative regulator of insulin signaling, thus representing a potential target for the treatment of insulin resistance and type 2 diabetes.
Acknowledgments
We thank Christiane Sprang, Christian Böhm and Doris Petzold for excellent experimental support. The authors declare that there is no duality of interest associated with this manuscript. This work was supported by the Deutsche Diabetes Gesellschaft (DDG 2010), the Deutsche Forschungsgemeinschaft (DFG) (KA1820/4-1), the Charité – University Medicine Berlin (personal funding, 2008) and the Marga und Walter Boll-Stiftung (210-04-10) to K.K. P.S. is supported by the Zukunftsfond Berlin/TSB Medici. U.K. is supported by the DFG (FG1054 and KFO218). F.D.B. acknowledges support by the DFG (BO 1043/9-1), A.L.B. is supported by the DFG (BI1292/4-1). A.Ö. is supported by a project research grant from Swedish Research Council. This work was supported by a grant of the Charité-Nachwuchskommission and the Deutsche Akademische Austauschdienst (DAAD) (D/12/40985) to J.K.
Contributor Information
Janine Krüger, Email: janine.krueger@charite.de.
Sebastian Brachs, Email: sebastian.brachs@charite.de.
Manuela Trappiel, Email: manuela.trappiel@charite.de.
Ulrich Kintscher, Email: ulrich.kintscher@charite.de.
Heike Meyborg, Email: hmeyborg@DHZB.de.
Ernst Wellnhofer, Email: wellnhofer@DHZB.de.
Christa Thöne-Reineke, Email: thoene-reineke.christa@fu-berlin.de.
Philipp Stawowy, Email: stawowy@DHZB.de.
Arne Östman, Email: arne.ostman@ki.se.
Andreas L. Birkenfeld, Email: andreas.birkenfeld@charite.de.
Frank D. Böhmer, Email: boehmer@med.uni-jena.de.
Kai Kappert, Email: kai.kappert@charite.de.
Conflict of interest
None declared.
Appendix A. Supplementary data
The following are the supplementary data related to this article:
LabMaster analyses of wild-type and Ptprj−/− mice. The motility was monitored for 24 h through light beam breaks and visualized in two dimensions (A) x + y and (B) z (demonstrating rearing of the animals). Food intake was measured in LFD groups (C) and HFD groups (D) for 24 h (n = 6–10 mice per genotype). The locomotor activity (E and F) and the food intake (G) of LFD fed mice were analyzed for the time period between 12:00 a.m. and 03:00. a.m. The locomotor activity (H and I) and the food intake (G) of HFD fed mice were analyzed for the time period between 03:00 a.m. and 06:00 a.m.
References
- 1.Saltiel A.R., Kahn C.R. Insulin signalling and the regulation of glucose and lipid metabolism. Nature. 2001;414:799–806. doi: 10.1038/414799a. [DOI] [PubMed] [Google Scholar]
- 2.DeFronzo R.A. Insulin resistance, lipotoxicity, type 2 diabetes and atherosclerosis: the missing links. The Claude Bernard Lecture 2009. Diabetologia. 2010;53:1270–1287. doi: 10.1007/s00125-010-1684-1. [DOI] [PMC free article] [PubMed] [Google Scholar]
- 3.Tikellis C., Pickering R., Tsorotes D., Du X.J., Kiriazis H., Nguyen-Huu T.P. Interaction of diabetes and ACE2 in the pathogenesis of cardiovascular disease in experimental diabetes. Clinical Science. 2012;123:519–529. doi: 10.1042/CS20110668. [DOI] [PubMed] [Google Scholar]
- 4.Hotamisligil G.S., Shargill N.S., Spiegelman B.M. Adipose expression of tumor necrosis factor-alpha: direct role in obesity-linked insulin resistance. Science. 1993;259:87–91. doi: 10.1126/science.7678183. [DOI] [PubMed] [Google Scholar]
- 5.Bevan P. Insulin signalling. Journal of Cell Science. 2001;114:1429–1430. doi: 10.1242/jcs.114.8.1429. [DOI] [PubMed] [Google Scholar]
- 6.Andersen J.N., Mortensen O.H., Peters G.H., Drake P.G., Iversen L.F., Olsen O.H. Structural and evolutionary relationships among protein tyrosine phosphatase domains. Molecular and Cellular Biology. 2001;21:7117–7136. doi: 10.1128/MCB.21.21.7117-7136.2001. [DOI] [PMC free article] [PubMed] [Google Scholar]
- 7.Xu E., Charbonneau A., Rolland Y., Bellmann K., Pao L., Siminovitch K.A. Hepatocyte-specific Ptpn6 deletion protects from obesity-linked hepatic insulin resistance. Diabetes. 2012;61:1949–1958. doi: 10.2337/db11-1502. [DOI] [PMC free article] [PubMed] [Google Scholar]
- 8.Ahmad F., Azevedo J.L., Cortright R., Dohm G.L., Goldstein B.J. Alterations in skeletal muscle protein-tyrosine phosphatase activity and expression in insulin-resistant human obesity and diabetes. Journal of Clinical Investigation. 1997;100:449–458. doi: 10.1172/JCI119552. [DOI] [PMC free article] [PubMed] [Google Scholar]
- 9.Ahmad F., Considine R.V., Bauer T.L., Ohannesian J.P., Marco C.C., Goldstein B.J. Improved sensitivity to insulin in obese subjects following weight loss is accompanied by reduced protein-tyrosine phosphatases in adipose tissue. Metabolism. 1997;46:1140–1145. doi: 10.1016/s0026-0495(97)90206-7. [DOI] [PubMed] [Google Scholar]
- 10.Bandyopadhyay D., Kusari A., Kenner K.A., Liu F., Chernoff J., Gustafson T.A. Protein-tyrosine phosphatase 1B complexes with the insulin receptor in vivo and is tyrosine-phosphorylated in the presence of insulin. Journal of Biological Chemistry. 1997;272:1639–1645. doi: 10.1074/jbc.272.3.1639. [DOI] [PubMed] [Google Scholar]
- 11.Dubois M.J., Bergeron S., Kim H.J., Dombrowski L., Perreault M., Fournes B. The SHP-1 protein tyrosine phosphatase negatively modulates glucose homeostasis. Nature Medicine. 2006;12:549–556. doi: 10.1038/nm1397. [DOI] [PubMed] [Google Scholar]
- 12.Asante-Appiah E., Kennedy B.P. Protein tyrosine phosphatases: the quest for negative regulators of insulin action. American Journal of Physiology. Endocrinology and Metabolism. 2003;284:E663–E670. doi: 10.1152/ajpendo.00462.2002. [DOI] [PubMed] [Google Scholar]
- 13.Klaman L.D., Boss O., Peroni O.D., Kim J.K., Martino J.L., Zabolotny J.M. Increased energy expenditure, decreased adiposity, and tissue-specific insulin sensitivity in protein-tyrosine phosphatase 1B-deficient mice. Molecular and Cellular Biology. 2000;20:5479–5489. doi: 10.1128/mcb.20.15.5479-5489.2000. [DOI] [PMC free article] [PubMed] [Google Scholar]
- 14.Elchebly M., Payette P., Michaliszyn E., Cromlish W., Collins S., Loy A.L. Increased insulin sensitivity and obesity resistance in mice lacking the protein tyrosine phosphatase-1B gene. Science. 1999;283:1544–1548. doi: 10.1126/science.283.5407.1544. [DOI] [PubMed] [Google Scholar]
- 15.Galic S., Hauser C., Kahn B.B., Haj F.G., Neel B.G., Tonks N.K. Coordinated regulation of insulin signaling by the protein tyrosine phosphatases PTP1B and TCPTP. Molecular and Cellular Biology. 2005;25:819–829. doi: 10.1128/MCB.25.2.819-829.2005. [DOI] [PMC free article] [PubMed] [Google Scholar]
- 16.Zabolotny J.M., Haj F.G., Kim Y.B., Kim H.J., Shulman G.I., Kim J.K. Transgenic overexpression of protein-tyrosine phosphatase 1B in muscle causes insulin resistance, but overexpression with leukocyte antigen-related phosphatase does not additively impair insulin action. Journal of Biological Chemistry. 2004;279:24844–24851. doi: 10.1074/jbc.M310688200. [DOI] [PubMed] [Google Scholar]
- 17.Goldstein B.J. Protein-tyrosine phosphatases: emerging targets for therapeutic intervention in type 2 diabetes and related states of insulin resistance. Journal of Clinical Endocrinology & Metabolism. 2002;87:2474–2480. doi: 10.1210/jcem.87.6.8641. [DOI] [PubMed] [Google Scholar]
- 18.Zabolotny J.M., Kim Y.B., Welsh L.A., Kershaw E.E., Neel B.G., Kahn B.B. Protein-tyrosine phosphatase 1B expression is induced by inflammation in vivo. Journal of Biological Chemistry. 2008;283:14230–14241. doi: 10.1074/jbc.M800061200. [DOI] [PMC free article] [PubMed] [Google Scholar]
- 19.Owen C., Lees E.K., Grant L., Zimmer D.J., Mody N., Bence K.K. Inducible liver-specific knockdown of protein tyrosine phosphatase 1B improves glucose and lipid homeostasis in adult mice. Diabetologia. 2013;56:2286–2296. doi: 10.1007/s00125-013-2992-z. [DOI] [PubMed] [Google Scholar]
- 20.Ahmad F., Goldstein B.J. Alterations in specific protein-tyrosine phosphatases accompany insulin resistance of streptozotocin diabetes. American Journal of Physiology. 1995;268:E932–E940. doi: 10.1152/ajpendo.1995.268.5.E932. [DOI] [PubMed] [Google Scholar]
- 21.Zabolotny J.M., Kim Y.B., Peroni O.D., Kim J.K., Pani M.A., Boss O. Overexpression of the LAR (leukocyte antigen-related) protein-tyrosine phosphatase in muscle causes insulin resistance. Proceedings of the National Academy of Sciences of the United States of America. 2001;98:5187–5192. doi: 10.1073/pnas.071050398. [DOI] [PMC free article] [PubMed] [Google Scholar]
- 22.Ahmad F., Considine R.V., Goldstein B.J. Increased abundance of the receptor-type protein-tyrosine phosphatase LAR accounts for the elevated insulin receptor dephosphorylating activity in adipose tissue of obese human subjects. Journal of Clinical Investigation. 1995;95:2806–2812. doi: 10.1172/JCI117985. [DOI] [PMC free article] [PubMed] [Google Scholar]
- 23.Pandey S.K., Yu X.X., Watts L.M., Michael M.D., Sloop K.W., Rivard A.R. Reduction of low molecular weight protein-tyrosine phosphatase expression improves hyperglycemia and insulin sensitivity in obese mice. Journal of Biological Chemistry. 2007;282:14291–14299. doi: 10.1074/jbc.M609626200. [DOI] [PubMed] [Google Scholar]
- 24.Loh K., Merry T.L., Galic S., Wu B.J., Watt M.J., Zhang S. T cell protein tyrosine phosphatase (TCPTP) deficiency in muscle does not alter insulin signalling and glucose homeostasis in mice. Diabetologia. 2012;55:468–478. doi: 10.1007/s00125-011-2386-z. [DOI] [PMC free article] [PubMed] [Google Scholar]
- 25.Ostman A., Yang Q., Tonks N.K. Expression of DEP-1, a receptor-like protein-tyrosine-phosphatase, is enhanced with increasing cell density. Proceedings of the National Academy of Sciences of the United States of America. 1994;91:9680–9684. doi: 10.1073/pnas.91.21.9680. [DOI] [PMC free article] [PubMed] [Google Scholar]
- 26.Senis Y.A., Tomlinson M.G., Ellison S., Mazharian A., Lim J., Zhao Y. The tyrosine phosphatase CD148 is an essential positive regulator of platelet activation and thrombosis. Blood. 2009;113:4942–4954. doi: 10.1182/blood-2008-08-174318. [DOI] [PMC free article] [PubMed] [Google Scholar]
- 27.Mori J., Wang Y.J., Ellison S., Heising S., Neel B.G., Tremblay M.L. Dominant role of the protein-tyrosine phosphatase CD148 in regulating platelet activation relative to protein-tyrosine phosphatase-1B. Arteriosclerosis Thrombosis and Vascular Biology. 2012;32:2956–2965. doi: 10.1161/ATVBAHA.112.300447. [DOI] [PubMed] [Google Scholar]
- 28.Kappert K., Paulsson J., Sparwel J., Leppanen O., Hellberg C., Ostman A. Dynamic changes in the expression of DEP-1 and other PDGF receptor-antagonizing PTPs during onset and termination of neointima formation. FASEB Journal. 2007;21:523–534. doi: 10.1096/fj.06-6219com. [DOI] [PubMed] [Google Scholar]
- 29.Palka H.L., Park M., Tonks N.K. Hepatocyte growth factor receptor tyrosine kinase met is a substrate of the receptor protein-tyrosine phosphatase DEP-1. Journal of Biological Chemistry. 2003;278:5728–5735. doi: 10.1074/jbc.M210656200. [DOI] [PubMed] [Google Scholar]
- 30.Kovalenko M., Denner K., Sandstrom J., Persson C., Gross S., Jandt E. Site-selective dephosphorylation of the platelet-derived growth factor beta-receptor by the receptor-like protein-tyrosine phosphatase DEP-1. Journal of Biological Chemistry. 2000;275:16219–16226. doi: 10.1074/jbc.275.21.16219. [DOI] [PubMed] [Google Scholar]
- 31.Kruger J., Trappiel M., Dagnell M., Stawowy P., Meyborg H., Bohm C. Targeting density-enhanced phosphatase-1 (DEP-1) with antisense oligonucleotides improves the metabolic phenotype in high-fat diet-fed mice. Cell Communication and Signaling. 2013;11:49. doi: 10.1186/1478-811X-11-49. [DOI] [PMC free article] [PubMed] [Google Scholar]
- 32.Walchli S., Curchod M.L., Gobert R.P., Arkinstall S., Hooft van Huijsduijnen R. Identification of tyrosine phosphatases that dephosphorylate the insulin receptor. A brute force approach based on “substrate-trapping” mutants. Journal of Biological Chemistry. 2000;275:9792–9796. doi: 10.1074/jbc.275.13.9792. [DOI] [PubMed] [Google Scholar]
- 33.Wang Q., Wang N., Dong M., Chen F., Li Z., Chen Y.Y. GdCl3 reduces hyperglycaemia through Akt/FoxO1-induced suppression of hepatic gluconeogenesis in Type 2 diabetic mice. Clinical Science. 2014;127:91–100. doi: 10.1042/CS20130670. [DOI] [PubMed] [Google Scholar]
- 34.Cartee G.D., Bohn E.E. Growth hormone reduces glucose transport but not GLUT-1 or GLUT-4 in adult and old rats. American Journal of Physiology. 1995;268:E902–E909. doi: 10.1152/ajpendo.1995.268.5.E902. [DOI] [PubMed] [Google Scholar]
- 35.Tsou R.C., Bence K.K. Central regulation of metabolism by protein tyrosine phosphatases. Frontiers in Neuroscience. 2012;6:192. doi: 10.3389/fnins.2012.00192. [DOI] [PMC free article] [PubMed] [Google Scholar]
- 36.Delibegovic M., Bence K.K., Mody N., Hong E.G., Ko H.J., Kim J.K. Improved glucose homeostasis in mice with muscle-specific deletion of protein-tyrosine phosphatase 1B. Molecular and Cellular Biology. 2007;27:7727–7734. doi: 10.1128/MCB.00959-07. [DOI] [PMC free article] [PubMed] [Google Scholar]
- 37.Owen C., Czopek A., Agouni A., Grant L., Judson R., Lees E.K. Adipocyte-specific protein tyrosine phosphatase 1B deletion increases lipogenesis, adipocyte cell size and is a minor regulator of glucose homeostasis. PLoS One. 2012;7:e32700. doi: 10.1371/journal.pone.0032700. [DOI] [PMC free article] [PubMed] [Google Scholar]
- 38.Delibegovic M., Zimmer D., Kauffman C., Rak K., Hong E.G., Cho Y.R. Liver-specific deletion of protein-tyrosine phosphatase 1B (PTP1B) improves metabolic syndrome and attenuates diet-induced endoplasmic reticulum stress. Diabetes. 2009;58:590–599. doi: 10.2337/db08-0913. [DOI] [PMC free article] [PubMed] [Google Scholar]
- 39.Tripathy D., Daniele G., Fiorentino T.V., Perez-Cadena Z., Chavez-Velasquez A., Kamath S. Pioglitazone improves glucose metabolism and modulates skeletal muscle TIMP-3-TACE dyad in type 2 diabetes mellitus: a randomised, double-blind, placebo-controlled, mechanistic study. Diabetologia. 2013;56:2153–2163. doi: 10.1007/s00125-013-2976-z. [DOI] [PubMed] [Google Scholar]
- 40.Chen Z., Vigueira P.A., Chambers K.T., Hall A.M., Mitra M.S., Qi N. Insulin resistance and metabolic derangements in obese mice are ameliorated by a novel peroxisome proliferator-activated receptor gamma-sparing thiazolidinedione. Journal of Biological Chemistry. 2012;287:23537–23548. doi: 10.1074/jbc.M112.363960. [DOI] [PMC free article] [PubMed] [Google Scholar]
- 41.Barr A.J., Ugochukwu E., Lee W.H., King O.N., Filippakopoulos P., Alfano I. Large-scale structural analysis of the classical human protein tyrosine phosphatome. Cell. 2009;136:352–363. doi: 10.1016/j.cell.2008.11.038. [DOI] [PMC free article] [PubMed] [Google Scholar]
- 42.Bhaskar P.T., Hay N. The two TORCs and Akt. Developmental Cell. 2007;12:487–502. doi: 10.1016/j.devcel.2007.03.020. [DOI] [PubMed] [Google Scholar]
- 43.Karlsson H.K., Zierath J.R., Kane S., Krook A., Lienhard G.E., Wallberg-Henriksson H. Insulin-stimulated phosphorylation of the Akt substrate AS160 is impaired in skeletal muscle of type 2 diabetic subjects. Diabetes. 2005;54:1692–1697. doi: 10.2337/diabetes.54.6.1692. [DOI] [PubMed] [Google Scholar]
- 44.Simonds S.E., Cowley M.A. Hypertension in obesity: is leptin the culprit? Trends in Neurosciences. 2013;36:121–132. doi: 10.1016/j.tins.2013.01.004. [DOI] [PubMed] [Google Scholar]
- 45.Tsou R.C., Rak K.S., Zimmer D.J., Bence K.K. Improved metabolic phenotype of hypothalamic PTP1B-deficiency is dependent upon the leptin receptor. Molecular Metabolism. 2014;3:301–312. doi: 10.1016/j.molmet.2014.01.008. [DOI] [PMC free article] [PubMed] [Google Scholar]
- 46.Fischer K., Muller T.D. Relationship status update for PTP1B and LepR: its complicated. Molecular Metabolism. 2014;3:217–218. doi: 10.1016/j.molmet.2014.01.015. [DOI] [PMC free article] [PubMed] [Google Scholar]
- 47.Belin de Chantemele E.J., Ali M.I., Mintz J.D., Rainey W.E., Tremblay M.L., Fulton D.J. Increasing peripheral insulin sensitivity by protein tyrosine phosphatase 1B deletion improves control of blood pressure in obesity. Hypertension. 2012;60:1273–1279. doi: 10.1161/HYPERTENSIONAHA.112.196295. [DOI] [PMC free article] [PubMed] [Google Scholar]
- 48.Ainslie D.A., Proietto J., Fam B.C., Thorburn A.W. Short-term, high-fat diets lower circulating leptin concentrations in rats. American Journal of Clinical Nutrition. 2000;71:438–442. doi: 10.1093/ajcn/71.2.438. [DOI] [PubMed] [Google Scholar]
- 49.Balavenkatraman K.K., Jandt E., Friedrich K., Kautenburger T., Pool-Zobel B.L., Ostman A. DEP-1 protein tyrosine phosphatase inhibits proliferation and migration of colon carcinoma cells and is upregulated by protective nutrients. Oncogene. 2006;25:6319–6324. doi: 10.1038/sj.onc.1209647. [DOI] [PubMed] [Google Scholar]
- 50.Trapasso F., Drusco A., Costinean S., Alder H., Aqeilan R.I., Iuliano R. Genetic ablation of Ptprj, a mouse cancer susceptibility gene, results in normal growth and development and does not predispose to spontaneous tumorigenesis. DNA and Cell Biology. 2006;25:376–382. doi: 10.1089/dna.2006.25.376. [DOI] [PubMed] [Google Scholar]
Associated Data
This section collects any data citations, data availability statements, or supplementary materials included in this article.
Supplementary Materials
LabMaster analyses of wild-type and Ptprj−/− mice. The motility was monitored for 24 h through light beam breaks and visualized in two dimensions (A) x + y and (B) z (demonstrating rearing of the animals). Food intake was measured in LFD groups (C) and HFD groups (D) for 24 h (n = 6–10 mice per genotype). The locomotor activity (E and F) and the food intake (G) of LFD fed mice were analyzed for the time period between 12:00 a.m. and 03:00. a.m. The locomotor activity (H and I) and the food intake (G) of HFD fed mice were analyzed for the time period between 03:00 a.m. and 06:00 a.m.