
Figure 2.
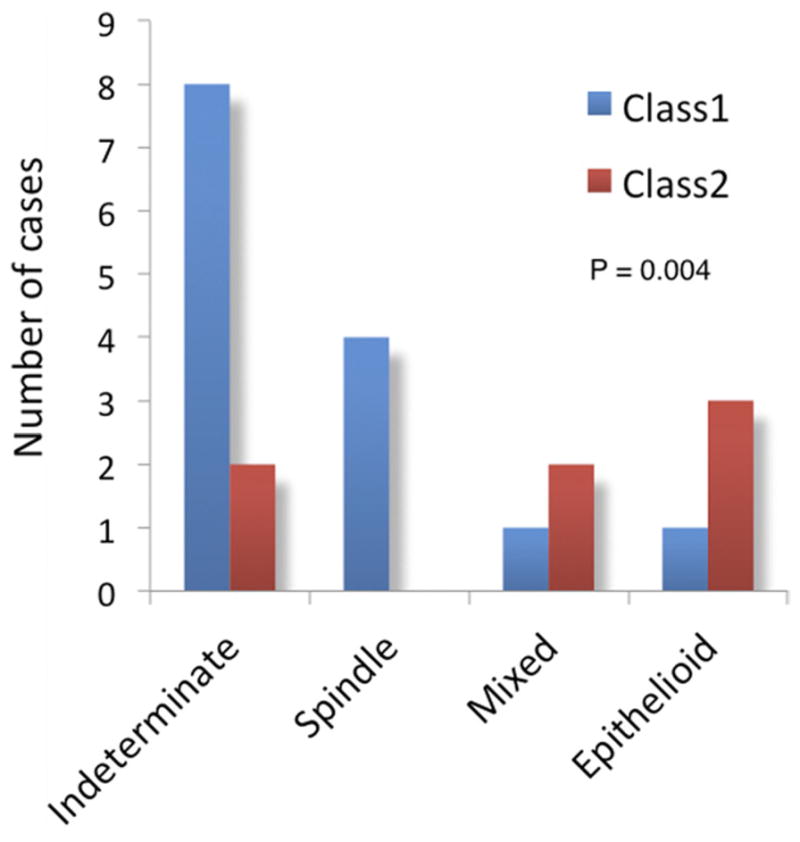
Association between gene expression profile, patient age, and tumor cell type. (A) Box and whiskers plot illustrating the relationship between patient age and gene expression class. The box represents the 25th–75th quartiles, and the line within the box represents the mean. T-bars indicate the range of values. (B) Bar graph illustrating the relationship between tumor cell type and gene expression class. “Indeterminate” indicates that insufficient sample was obtained for cytopathologic diagnosis.