Abstract
The antimicrobial protein calprotectin (CP), a hetero-oligomer of the S100 family members S100A8 and S100A9, is the only identified mammalian Mn(II)-sequestering protein. Human CP uses Ca(II) ions to tune its Mn(II) affinity at a biologically unprecedented hexahistidine site that forms at the S100A8/S100A9 interface, and the molecular basis for this phenomenon requires elucidation. Herein, we investigate the remarkable Mn(II) coordination chemistry of human CP using X-ray crystallography as well as continuous wave (CW) and pulse electron paramagnetic resonance (EPR) spectroscopies. An X-ray crystallographic structure of Mn(II)-CP containing one Mn(II), two Ca(II), and two Na(I) ions per CP heterodimer is reported. The CW EPR spectrum of Ca(II)- and Mn(II)-bound CP prepared with a 10:0.9:1 Ca(II):Mn(II):CP ratio is characterized by an unusually low zero-field splitting of 485 MHz (E/D = 0.30) for the S = 5/2 Mn(II) ion, consistent with the high symmetry of the His6 binding site observed crystallographically. Results from electron spin-echo envelope modulation and electron nuclear double resonance experiments reveal that the six Mn(II)-coordinating histidine residues of Ca(II)- and Mn(II)-bound CP are spectroscopically equivalent. The observed 15N (I = 1/2) hyperfine couplings (A) arise from two distinct classes of nitrogen atoms: the coordinating ε-nitrogen of the imidazole ring of each histidine ligand (A = [3.45, 3.71, 5.91] MHz) and the distal δ-nitrogen (A = [0.11, 0.18, 0.42] MHz). In the absence of Ca(II), the binding affinity of CP for Mn(II) drops by ca. two orders of magnitude and coincides with Mn(II) binding at the His6 site as well as other sites. This study demonstrates the role of Ca(II) in enabling high-affinity and specific binding of Mn(II) to the His6 site of human calprotectin.
Introduction
Competition between the mammalian host and bacterial pathogens for the essential metal nutrient Mn(II) is an important facet of the innate immune response and bacterial pathogenesis.1–4 Animal models of infectious disease indicate that various human pathogens, including Staphylococcus aureus and Streptococcus pneumoniae, must acquire Mn(II) in order to establish an infective lifestyle.1,5,6 The mammalian innate immune system employs the Ca(II)-, Mn(II)-, and Zn(II)-binding protein calprotectin (CP) in a metal-withholding strategy that limits Mn(II) and Zn(II) availability at sites of infection.7,8 CP is expressed and released by neutrophils and epithelial cells, and exhibits broad-spectrum antimicrobial activity attributed to its metal-binding properties.7–13 Moreover, CP is currently the only host-defense protein identified that sequesters labile Mn(II). Human CP accomplishes this feat by using a biologically unprecedented hexahistidine coordination motif.10,11,13
CP employs Ca(II) ions to modulate its affinities for Mn(II) and Zn(II).9,10 In our working model, CP turns on its metal-sequestering ability in the Ca(II)-rich (i.e. low-millimolar concentrations) extracellular space such that it can outcompete invading pathogens for these transition metal ions. Nevertheless, the molecular basis for how Ca(II) ions enable CP to transition from a relatively low- to a relatively high-affinity form, as well as how the unusual hexahistidine site allows CP to entrap labile Mn(II), requires elucidation. In the present work, we employ X-ray crystallography and electron paramagnetic resonance (EPR) spectroscopy to interrogate the mechanism by which Ca(II) ions modulate complexation of Mn(II) by CP.
CP is a member of the Ca(II)-binding S100 protein family. S100 proteins employ helix-loop-helix EF-hand domains for Ca(II) coordination, and several members of this family (e.g. S100A7, S100A12, S100B, CP) exhibit additional binding sites for transition metal ions.14,15 CP forms heterodimers and tetramers of S100A8 (93 amino acids, 10.8 kDa, α) and S100A9 (114 amino acids, 13.2 kDa, β).16–18 Whether CP exists as the αβ or α2β2 oligomer depends on Ca(II). In the absence of Ca(II), the αβ heterodimer predominates whereas Ca(II) binding results in formation of the α2β2 tetramer.17–19
The Ca(II)-binding sites of CP have been structurally characterized.18 Each S100 subunit exhibits two EF-hand domains (Table 1), and each subunit has been proposed to coordinate two Ca(II) ions such that the CP heterodimer contains four distinct Ca(II)-binding sites.18 The C-terminal EF-hand of each subunit resembles the Ca(II)-binding domains of calmodulin and is therefore described as canonical.20,21 The N-terminal EF-hands exhibit lower coordination numbers and are often termed non-canonical.20,22,23 The Ca(II)-coordinating groups of S100A8 and S100A9 identified in prior crystallographic structural work, as well as the coordination numbers and net charges of these EF-hands, are summarized in Table 1. The Ca(II)-binding affinities of the CP EF-hands have not been determined; however, Ca(II) affinities of other S100 proteins have been reported.20,22,24,25 In general, the reported dissociation constant (Kd) values for Ca(II) of canonical EF-hands are 1-50 μM whereas the Kd values for non-canonical EF-hands are 100-500 μM. The relatively weak Ca(II) affinities of non-canonical EF-hands are consistent with both the lower coordination numbers and the reduced negative charge exhibited by these motifs. Moreover, it has been proposed that the Ca(II) affinities of the N-terminal non-canonical EF-hands may be too weak to appreciably bind Ca(II) in a physiological context.22
Table 1.
Previously reported Ca(II)-coordination by S100A8 and S100A9 in CPa
| EF-hand | Ca(II)-coordinating groups | Coordination number | Net charge |
|---|---|---|---|
| A8, N-terminal Non-canonical | Ser20 (C=O)b, Lys23 (C=O), Asn25 (C=O), Ala28 (C=O), H2O | 5 | 0 |
| A8, C-terminal Canonical | Asp59 (Oδ), Asn61 (Oδ), Asp63 (Oδ1), Ala65 (C=O) Glu70 (Oε1 and Oε2), H2O | 7 | −4 |
| A9, N-terminal Non-canonical | Ser23 (C=O), Leu26 (C=O), His28 (C=O), Thr31 (C=O), Glu36 (Oε1), H2O | 6 | −1 |
| A9, C-terminal Canonical | Asp67 (Oδ), Asn69 (Oδ), Asp71 (Oδ1), Gln73 (C=O), Glu78 (Oε1 and Oε2), H2O | 7 | −4 |
Taken from the crystal structure of the Ca(II)-bound CP-Ser heterotetramer (PDB 1XK4, reference 18).
C=O indicates coordination by the carbonyl oxygen of the peptide backbone. In the 1XK4 structure, the Ca(II) ions are modeled at 100% occupancy in the canonical C-terminal EF-hand sites, and the Ca(II) ions in the non-canonical N-terminal EF-hand sites are modeled at 70% occupancy.
Each CP heterodimer contains two transition-metal-ion binding sites at the dimer interface that are distinct from the Ca(II)-binding sites.9,18 Site 1 is a His3Asp motif comprised of His83 and His87 from S100A8, and His20 and Asp30 from S100A9. Site 2 is an unusually histidine-rich biological metal-binding site and has been described as a His4 or His6 motif.10,11,13 The His4 motif, which is observed crystallographically at the S100A8/S100A9 interface in the absence of a bound transition metal ion,18 contains His17 and His27 of S100A8 and His91 and His95 of S100A9. The S100A9 subunit has an extended C-terminal tail that is disordered in the absence of a coordinated Mn(II) ion. Structural13 and biochemical11 studies of Mn(II)-bound CP revealed that site 2 binds Mn(II) in an octahedral His6 motif in which His103 and His105 of the S100A9 tail provide the fifth and sixth ligands. Both sites 1 and 2 can coordinate Mn(II), and we previously identified site 2 as the high-affinity Mn(II)-binding site.10 Moreover, we proposed that encapsulation of Mn(II) by the tail region allows CP to bind and restrict dissociation of this labile metal ion.11
In this work, we probe the molecular basis for Mn(II) sequestration by CP using X-ray crystallography and EPR spectroscopy. We present a new crystallographic snapshot of Mn(II)-CP that reveals a 1:1 Mn(II):CP (αβ) stoichiometry with Mn(II) exclusively bound to the His6 site and Ca(II) bound to each of the two canonical C-terminal EF-hands of the αβ heterodimer. We conclude that the non-canonical EF-hands located in the N-terminal regions of S100A8 and S100A9 coordinate Na(I) under the crystallographic conditions used in this work. Moreover, we establish that the Mn(II)-His6 site of Ca(II)-bound CP is highly symmetric in solution, and that the C-terminal tail region of S100A9 is essential for preventing water access to the Mn(II) center. We demonstrate, for the first time, that Mn(II) binding in the absence of Ca(II) results in Mn(II) coordination to the His6 site as well as additional sites. These findings indicate that Ca(II) binding leads to specific and high-affinity Mn(II) coordination to the His6 site. In total, our work illuminates the molecular basis for Mn(II) capture by CP in the presence of Ca(II), and supports a model in which Ca(II) binding promotes Mn(II) sequestration in an octahedral Mn(II)-His6 coordination environment that precludes water molecules from the primary coordination sphere.
Experimental Section
General Materials and Methods
All solvents, reagents, and chemicals were obtained from commercial suppliers and used as received. All buffers and metal stock solutions were prepared using Milli-Q water (18.2 MΩ, 0.22-μm filter). All buffers employed for spectroscopy samples were prepared in acid-washed volumetric glassware using Ultrol grade HEPES (free acid, Calbiochem) and TraceSELECT NaCl (Sigma). PEG 200 was purchased from Hampton Research. Calcium chloride was purchased from Sigma Aldrich, and 99.999% manganese chloride was purchased from Alfa Aesar. Stock solutions of 1.0 M Ca(II) or Mn(II) were prepared in Milli-Q water using acid-washed volumetric glassware and immediately transferred to polypropylene tubes for long-term storage. Working metal solutions were prepared fresh daily by diluting the appropriate stock solution with buffer (75 mM HEPES, 100 mM NaCl, pH 7.5). 15N-Ammonium chloride (15NH4Cl, 99%) and deuterium oxide (2H2O, 99.9%) were obtained from Cambridge Isotope Laboratories, INC (Andover, MA). Table S1 (Supporting Information) lists the proteins used in this work and corresponding nomenclature. Unlabeled CP-Ser, ΔHis3Asp, H103A, H104A, H105A, H103A/H105A (AHA), and H103A/H104A/H105A (AAA) were overexpressed and purified as described previously.9 CP-Ser and mutants thereof were employed in this work because mutation of Cys42 of S100A8 and Cys3 of S100A9 to Ser residues allows metal-binding studies to be performed in the absence of a reducing agent.9 All protein concentrations are reported in terms of the αβ heterodimer. Equivalents of divalent cations are reported in terms of the αβ heterodimer.
Preparation of 15N-labeled CP-Ser and Mutants
Globally 15N-labeled S100A8(C42S), S100A8(C42S)(H83A)(H87A), S100A9(C3S), and S100A9(C3S)(H20A)(D30A) were obtained by overexpression in M9 minimal medium containing 6 g/L anhydrous Na2HPO4, 3 g/L anhydrous KH2PO4, 0.5 g/L NaCl, 2 mM MgSO4, 100 μM CaCl2, 1 g/L 15NH4Cl, and 2 g/L d-glucose. The medium was aseptically filtered, and a 1-L volume was transferred to an autoclaved 4-L baffled flask. The minimal medium (1 L) was supplemented with a 400-μL aliquot of a vitamin mix (400 mg choline chloride, 500 mg folic acid, 1.1 g pantothenic acid, 500 mg nicotinamide, 500 mg myo-inositol, 500 mg pyridoxal HCl, 500 mg thiamine HCl, and 50 mg riboflavin suspended in 15 mL of Milli-Q water) and a spatula tip of iron(III) chloride hexahydrate immediately prior to use.
The plasmids pET41a-S100A9(C3S), pET41a-S100A8(C42S), pET41a-S100A9 (C3S)(H20A)(D30A), and pET41a-S100A8(C42S)(H83A)(H87A) were transformed into chemically-competent E. coli BL21(DE3) cells.9 Single colonies were selected and utilized to inoculate 50 mL of Luria Broth (LB) medium containing kanamycin (50 μg/mL). Cultures were incubated overnight (ca. 16 h) at 37 °C with shaking at 175 rpm in 250-mL baffled flasks. The cultures were transferred to sterile 50-mL conical tubes and pelleted by centrifugation (3000 rpm × 30 min, 4 °C). The supernatant was decanted, and each cell pellet was washed by resuspending the cells with ca. 25 mL of minimal medium (vide supra) and pelleting by centrifugation (3000 rpm × 30 min, 4 °C). The resulting cell pellet was resuspended in ca. 25 mL of minimal medium and the entire volume was used to inoculate 1 L of minimal medium prepared as described above. The cultures were incubated at 37 °C with shaking at 175 rpm and protein overexpression was induced by addition of 500 μM of IPTG when the OD600 reached ca. 0.6. The cultures were incubated for an additional 3.5 h at 37 °C (OD600 ~ 1.2) at which time the cells were harvested by centrifugation (3000 rpm × 15 min, 4 °C). The cell pellets were transferred to sterile 50-mL conical tubes, flash frozen in liquid nitrogen, and stored at −80 °C for up to six weeks. The resulting yields ranged from approximately 1.0–2.0 g cells / L of culture.
Globally 15N-labeled CP-Ser and ΔHis3Asp were purified and stored as described previously,9 and the yields ranged from 3-7 mg of 15N-labeled protein / 2 L of culture. For mixed-labeled proteins where only S100A8 or S100A9 was 15N-labeled, the unlabeled subunit was overexpressed in M9 minimal medium containing NH4Cl with natural abundance. For all protein purifications, the final size-exclusion chromatography and dialysis steps were performed at pH 8.0 (20 mM HEPES, 100 mM NaCl) as described previously,9 and the purified proteins were stored at −80 °C until further use. Protein purity and identity were confirmed by SDS-PAGE (Figure S1) and LC/MS (Table S2).
Crystallization of Mn(II)-CP-Ser
Mn(II)-CP-Ser was crystallized at 18 °C employing the sitting drop vapor diffusion technique. Screening of crystallization conditions using an automated Phoenix crystallization robot (Art Robbins Instrument) and Crystal Screen HT (Hampton Research) yielded a crystal that appeared between days 3 and 5. The droplets contained 100 nL of protein solution, 100 μM CP-Ser, 100 μM MnCl2, 1.0 mM CaCl2, at pH 7.5 (75 mM HEPES, 100 mM NaCl) and 100 nL of precipitant solution, 20% (w/v) PEG 4000, 20% (v/v) isopropanol, 0.1 M sodium citrate at pH 5.6, and were equilibrated against 100 μL of precipitant solution in a 96-well Intelliplate (Art Robbins Instruments). The crystal was transferred to a cryogenic solution (20% PEG 4000, 10% glycerol) and flash-frozen in liquid nitrogen.
Data Collection and Structure Determination
Diffraction data were collected at the 24-ID-C beamline at the Advanced Photon Source (APS) at Argonne National Laboratory using a Pilatus 6M pixel detector. APS datasets were collected at a wavelength of 0.9792 Å (12662.0 eV) in 0.3° oscillation steps. Additional diffraction data was collected on the same crystal at 100 K using an in-house Cu-Kα rotating anode source (Rigaku) at a wavelength of 1.5418 Å with a Saturn 944 CCD detector, using sequential 1° oscillation steps. The structure was completed with SBGrid compiled software.26 Data were integrated and scaled in space group P2 (a = 55.2 Å, b = 49.2 Å, c = 218.1 Å, α = γ = 90 and β = 94.1), using HKL2000 software.27 Two and a half tetramers are contained within the asymmetric unit. The structure was determined at 2.5 Å resolution by molecular replacement using protein atoms from chains A and C of PDB entry 4GGF in PHASER.13,28 Iterative rounds of refinement in PHENIX without use of noncrystallographic symmetry restrains or a sigma cutoff, and model building in COOT achieved a final model at 1.76 Å resolution.29,30 Initial difference electron density maps revealed density consistent with the presence of five Mn(II) in the five His6 sites, 10 Ca(II) ions in the 10 canonical C-terminal EF-hand sites, and 10 ions in the 10 non-canonical N-terminal EF-hand sites of the asymmetric unit. To further probe the identity of the metals in the metal-binding sites, in-house diffraction data, processed using HKL2000, was employed to generate anomalous density maps. The anomalous data are consistent with five Mn(II) and 10 Ca(II) ions in the asymmetric unit. There is no anomalous density observed at the non-canonical EF-hand sites. To best fit the electron density in these sites, and yield B-factors similar to the rest of the protein, Na(I) is modeled into both the S100A8 and S100A9 non-canonical N-terminal EF-hand sites at 100% occupancy. The crystallization conditions contained 100 mM NaCl in the protein solution (100-fold excess relative to CP-Ser). Metal ions and water molecules were added to the model at 2.0-Å resolution. The model contains 8921 total atoms; chains C and E contain residues 1-89 (of 93, S100A8), chains A, G, and I contain residues 1-88 (of 93, S100A8), chains B, F, and J contain residues 4-111 (of 114, S100A9), and chains D and H contain residues 4-112 (of 114, S100A9). Composite omit maps were used to verify the structure. The crystallographic data refinement and statistics are provided in Table S3.
Preparation of EPR Samples
Aliquots of CP-Ser or mutated forms of CP-Ser were thawed on ice and buffer exchanged into 75 mM HEPES, 100 mM NaCl, pH 7.5. The protein concentration was determined by absorbance at 280 nm (ε = 18,450 M−1 cm−1 for CP-Ser (αβ) and mutants presented herein). For +Ca(II) EPR samples, a solution (150 μL) of 200 μM CP at pH 7.5 (80% (v/v) 75 mM HEPES, 100 mM NaCl, 20% (v/v) PEG 200) was prepared in a microcentrifuge tube, and Ca(II) was added from a 100-mM stock solution to afford a final concentration of 2 mM. The resulting mixture was incubated at room temperature for ca. 20 min. For +Ca(II) samples, Mn(II) was then added from a 10-mM stock solution to afford a final concentration of 180 μM (0.9 equiv. / CP αβ), and the sample was incubated at room temperature for 20 min. The sample was then transferred to a quartz (CFQ) EPR tube with an outer diameter of 3.8 mm (Wilmad, 706-PQ-9.50), frozen in liquid nitrogen, and stored in liquid nitrogen.
For +Ca(II) samples prepared in 2H2O, protein aliquots were thawed and buffer exchanged as described above, and CP was diluted to 100 μM (300 μL) at pH 7.5 (75 mM HEPES, 100 mM NaCl). An aliquot of aqueous Ca(II) (100 mM) was added to each sample to afford a final Ca(II) concentration of 1 mM (10 equiv. / αβ), and the resulting sample was incubated at room temperature for ca. 20 min. An aliquot of Mn(II) (10 mM) was then added to achieve a final concentration of 90 μM (0.9 equiv. / CP αβ) and the sample was incubated at room temperature for ca. 20 min. The resulting samples were frozen in liquid nitrogen and lyophilized to dryness. To exchange H2O for 2H2O, each sample was re-suspended in 300 μL of 2H2O and lyophilized to dryness. This process was repeated for a total of three times. Following the third lyophilization, each sample was dissolved in 150 μL of 2H2O containing 20% (v/v) PEG 200 to afford a sample containing 200 μM CP, 2 mM Ca(II), and 180 μM Mn(II). Each sample was transferred to an EPR tube, frozen in liquid nitrogen, and stored in liquid nitrogen. For experiments at Q-band, several samples were thawed and transferred into quartz EPR tubes (2.4 × 2.0 mm), and frozen in liquid nitrogen.
The –Ca(II) samples were prepared as described above except that samples contained 180 μM Mn(II) and either 1.0 mM or 200 μM CP. No Ca(II) was added.
Electron Paramagnetic Resonance Spectroscopy
EPR spectra were collected at the CalEPR Center at the University of California, Davis. All X-band (ca. 9.4 GHz) continuous wave (CW) EPR spectra were collected under non-saturating, slow-passage conditions using a Bruker E500 equipped with a super high QE (SHQE) resonator and Oxford Instruments ESR900 cryostat. The time constant was set to 80 ms with a data point collected ca. every 0.4 mT. A Bruker ELEXYS E580 spectrometer with X- and Q- (≈34.1 GHz) band capabilities was used to collect all pulse EPR spectra. An Oxford Instruments CF935 continuous-flow liquid-helium cryostat was employed for cryogenic temperatures. A Bruker MS5 or MD4 resonator was utilized to collect X-band pulse spectra. A home-built probe based on previously published designs was employed to collect Q-band pulse spectra.31 All low-temperature data were collected at 10 K with the exception of Davies ENDOR, which was performed at 4.5 K. Additional experimental parameters are listed in the corresponding figure captions. Standard 2-pulse (π/2-τ-π-τ-echo), 3-pulse (π/2-τ- π/2-T- π/2-τ-echo), and 4-pulse (π/2-τ- π/2-T- π-T- π/2-τ-echo) electron spin-echo envelope modulation (ESEEM) sequences as well as hyperfine sublevel correlation spectroscopy (HYSCORE, π/2-τ- π/2-T1- π-T2- π/2-τ-echo) were used to probe the hyperfine coupling between the nitrogen nuclei in close proximity to the Mn(II) ion. Mims (π/2-τ- π/2- πRF- π/2-τ-echo) and Davies (π-πRF- π/2-τ- π-τ-echo) electron-nuclear double resonance (ENDOR) spectroscopies were used to measure the 15N and 1H hyperfine couplings, respectively.32,33 Room temperature X-band EPR (RT-EPR) was performed with 10 μL of each sample in a capillary melting point tube (Kimble-Chase) using the Bruker SHQE resonator without the cryostat insert.
EPR Data Analysis
Time domain spectra were corrected for electron relaxation by subtracting a bi-exponential decay. These time traces were then apodized using a Hamming function and zero-filled (8-fold the length of the original time trace) prior to Fourier-transformation using cross-term averaging (ca. 40-60 cycles) to minimize deadtime-induced artifacts.34 To determine spin Hamiltonian parameters, simulations were performed using the EasySpin toolbox for MATLAB (The Mathworks Inc.).35 The spin Hamiltonian for the 55Mn(II) (I = 5/2, 100% natural abundance) spin system is defined by eq. 1.
| (1) |
The terms, in order, are the electron Zeeman interaction with a static magnetic field B, the electron-nuclear hyperfine (HF) tensor Ai for every nucleus i with a non-zero nuclear spin (I) that is coupled to the Mn(II) center, the nuclear quadrupole tensor Pi for nuclei with I > 1/2, the nuclear Zeeman interaction, and the zero-field splitting (ZFS) tensor D for the high-spin (S = 5/2) Mn(II) ion. βe and βn are the Bohr magneton and nuclear magneton, respectively; g and gn are the electron and nuclear g factors, respectively; h is the Planck constant.
The point-dipole approximation (eq. 2) was used to estimate the dipolar contribution to hyperfine tensor anisotropy (T = [−T,−T,+2T])
| (2) |
where μ0 is the magnetic vacuum permeability and r is the distance between the two magnetic point dipoles, and other parameters are as defined previously.
Exchangeable Proton Counting
A published procedure for determining the number of first coordination sphere exchangeable protons was utilized to ascertain the number of water molecules around the Mn(II) center.36,37 Three-pulse (3-pulse) ESEEM spectra were collected at a temperature of 10 K using a microwave frequency of 9.5255(5) GHz, and static field strength of 327.35 mT with an 8 ns π/2 pulse. All 3-pulse ESEEM spectra were collected under identical experimental conditions using protein samples prepared in either H2O or 2 H2O buffer. In this experiment, a value for τ was chosen to suppress modulation from protons.38 The time domain 3-pulse ESEEM spectrum of Mn(II)-CP prepared in 2H2O buffer was divided by that of Mn(II)-CP prepared in H2O buffer. This quotient spectrum contained modulation only from the hyperfine-coupled solvent-exchangeable deuterons.
To determine the number of bound, inner-sphere exchangeable protons, the contribution to the deuterium modulation from weakly-coupled outer-sphere waters must be removed. Two crystal structures of Mn(II)-bound CP-Ser show that the Mn(II)-binding site in CP is devoid of outer sphere solvent and thus [Mn(DTPA)]3- is an inappropriate standard (vide infra). Thus, we employed the 2H2O/H2O ratioed spectrum of Mn(II)-bound CP-Ser (containing 0.9 equivalents Mn(II) and 10 equivalents Ca(II)) as the outer-sphere standard instead of [Mn(DTPA)]3- for all mutants of CP-Ser in order to ascertain whether any change in the hydration level of the Mn(II) ion results from mutation of the Mn(II)-coordinating ligands of the S100A9 C-terminal tail.
Changes in the deuteron modulation depth upon mutation of CP-Ser can be understood in terms of an increase in the number of first-coordination sphere waters or hydroxides by comparison to a standard spectrum of [Mn(H2O)6]2+. The modulation depth of [Mn(2H2O)6]2+/[Mn(H2O)6]2+ further divided by the 2H2O/H2O ratioed spectrum of [Mn(DTPA)]3- corresponds to six bound water molecules (12 deuterons). Fewer than 12 deuterons are interpolated from the hexaquamanganese spectrum by taking the 12√n of the spectrum where n is the number of deuterons.39
Results and Discussion
X-Ray Crystal Structure of a 1:1 Mn(II)-CP Complex
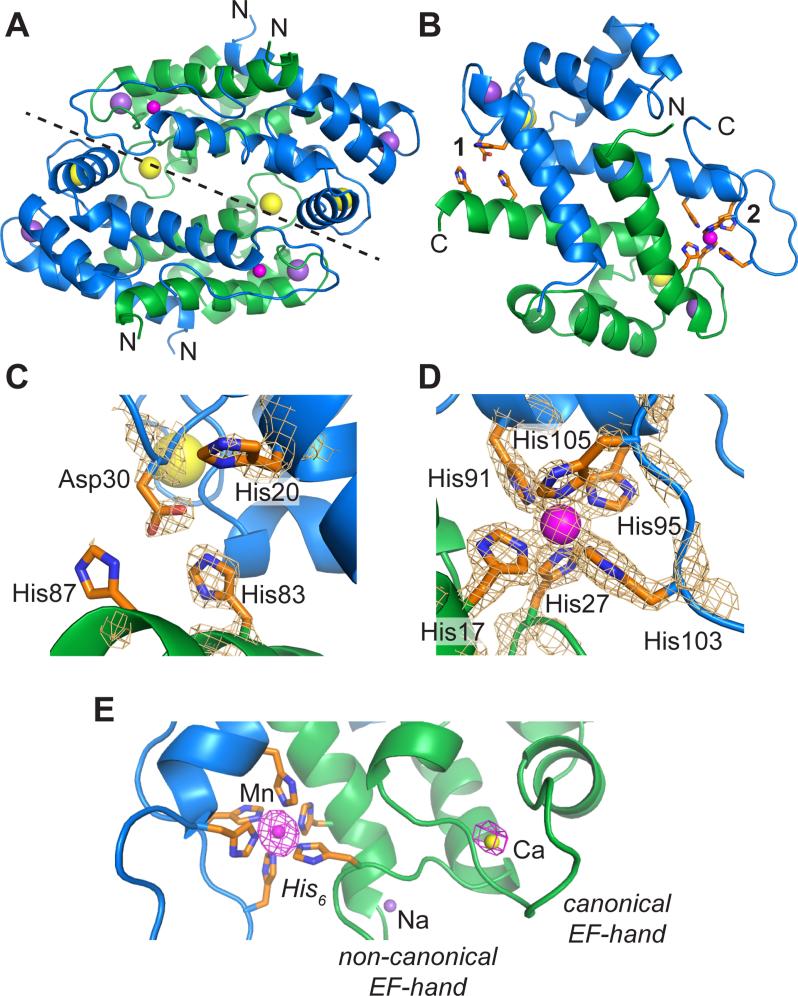
CP has the ability to exist in a variety of metal-bound forms,9,10,13,18 making structural elucidation of different CP species necessary for understanding its coordination chemistry and biological function. Despite its propensity to bind Ca(II) and transition metal ions in varying ratios, as well as the significance of M(II)-CP in the immune response, prior to this work only two crystal structures of metal-bound CP were available in the Protein Data Bank (PDB) with accession codes 1XK4 and 4GGF.13,18 For this investigation, we sought to obtain a crystal structure of Ca(II)- and Mn(II)-bound CP-Ser in conditions comparable to those employed for pulse EPR spectroscopic characterization to confirm that Mn(II) is coordinated only in the His6 site. On the basis of our initial Mn(II)-binding studies, which revealed that site 2 is the high-affinity Mn(II) binding site (Kd, site 1 = 21 ± 5 μM; Kd, site 2 = 194 ± 203 nM; in the presence of 40 equivalents of Ca(II) as ascertained by RT-EPR),2,10 we expected that incubation of CP-Ser with 1.0 equivalent of Mn(II) would result in the metal ion only populating the His6 site. We therefore crystallized Ca(II)- and Mn(II)-bound CP-Ser using a 10:1:1 ratio of Ca(II):Mn(II):CP-Ser. The resulting structure is presented in Figure 1. Consistent with our expectations, these conditions afford only one Mn(II) ion bound to each CP-Ser heterodimer. The electron density and anomalous density maps (Figure 1C-E) indicate that Mn(II) is coordinated only by the high-affinity His6 site comprised of His17 and His27 from S100A8 and His91, His95, His103 and His105 from S100A9. The structural attributes of this octahedral Mn(II)-binding site are in excellent agreement with structurally characterized small-molecule Mn(II) hexaimidazole complexes40–45 as well as a recently reported structure of Mn(II)-bound CP-Ser (PDB 4GGF) (Tables S4 and S5).13 In contrast to the 4GGF structure, which revealed Mn(II) bound to the His3Asp site with 50% occupancy in three of the four heterodimers of the asymmetric unit, our crystallization conditions result in no electron density corresponding to a bound metal ion at the low-affinity Mn(II) site (Figure 1C). The transition-metal-coordinating residue (A9)His20 is flipped away from the position it needs to be in to coordinate Mn(II) consistent with the CP crystal structure without Mn(II) (PDB 1XK4) (Figure S2). The side chain of (A8)His87 is poorly defined in the electron density map, indicating that the C-terminal region of S100A8 is disordered in the absence of a coordinating transition metal (Figure 1C).
Figure 1.
Crystal structure of Ca(II)-, Na(I)-, and Mn(II)-bound CP-Ser (PDB ID 4XJK). (A) The α2β2 tetramer of CP-Ser. The dashed line represents the dimer-dimer interface. (B) A representation of the αβ dimer of CP-Ser, taken from the tetramer structure shown in A. (C) Site 1 is a His3Asp motif comprised of (A8)His83, (A8)His87, (A9)His20 and (A9)Asp30. The composite omit electron density map at 3σ is shown for transition-metal coordinating residues. (D) Site 2 is a His6 motif comprised of residues (A8)His17, (A8)His27, (A9)His91, (A9)His95, (A9)His103, and (A9)His105. The composite omit electron density map at 3σ is shown for the Mn(II)-coordinating residues and the Mn(II) ion. (E) The anomalous electron density, calculated from data collected at λ = 1.54 Å, for the His6 site, one canonical, and one non-canonical EF-hand of the S100A8 subunit are contoured at 4σ with Mn(II), Ca(II), and Na(I) ions, respectively. Additional electron density maps are presented in Figure S4. S100A8 is shown in green, and S100A9 is shown in blue. Transition metal-ion coordinating residues are shown as orange sticks. Ca(II) ions are shown in yellow, Na(I) ions are shown in purple, and Mn(II) ions are shown in magenta.
Including 10 equivalents of Ca(II) in the crystallization conditions yielded electron density consistent with Ca(II) bound to each of the two canonical C-terminal EF-hand domains. Initially, we modeled the non-canonical S100A8 and S100A9 N-terminal EF-hands of each heterodimer with Ca(II) ions present with occupancies of 50% and 70%, respectively. In the 1XK4 structure of Ca(II)-bound calprotectin, Ca(II) ions in the non-canonical EF-hand were modeled in at 70% occupancy.18 In the prior Mn(II)-CP structure (PDB 4GGF), for which stoichiometric Ca(II) was employed in the crystallization conditions, Ca(II) was modeled in the S100A9 non-canonical EF-hand site at 100% occupancy, and the S100A8 non-canonical EF-hand has a water molecule modeled into the site.13 To further investigate the origins of the electron density in the non-canonical EF-hand domains of the present structure, a dataset collected using our in-house X-ray source was examined. The wavelength at the Cu-K edge (λ = 1.54 Å) allows for detection of anomalous signals from both Mn(II) and Ca(II), and the intensity of the manganese anomalous signal is expected to be approximately twice that of the calcium anomalous signal. Using these data, we observe the presence of anomalous density consistent with Mn(II) in the His6 site and Ca(II) in the canonical C-terminal EF-hand domains of each S100 subunit (Figures 1E and S4). In contrast, no anomalous density is observed in the non-canonical EF-hand domains located in the N-terminal regions of S100A8 and S100A9 (Figures 1E and S4). Sodium is present in ca. 1000-fold excess relative to CP-Ser in the protein and crystallization buffers, and Na(I) does not give rise to anomalous scattering. Thus, to best fit the electron density, Na(I) was modeled into both the S100A8 and S100A9 non-canonical N-terminal EF-hand sites at 100% occupancy. This analysis suggests that excess Na(I) outcompetes Ca(II) at the non-canonical EF-hands under the crystallization conditions. The Ca(II)- and Na(I)–ligand distances for the CP EF-hands are listed in Table S6.
Although the number of metal ions in the three available CP heterotetramer crystal structures differ, the global tertiary structure is unaltered by Mn(II) coordination. The average RMSD between the Cα carbons of the crystal structure of the Ca(II)-bound CP-Ser heterotetramer (PDB 1XK4)18 and the structure reported in the present work is 0.42 Å, and the variations primarily arise from ordering of the C-terminal tail regions of S100A9 in the presence of Mn(II) (Figure S2). The RMSD between the Cα carbons of the prior Ca(II)- and Mn(II)-bound CP-Ser heterotetramer (PDB 4GGF)13 and the current structure is 0.21 Å (Figure S3). These comparisons indicate that Mn(II) coordination has a minimal effect on the overall secondary and tertiary structure of CP in the presence of Ca(II).
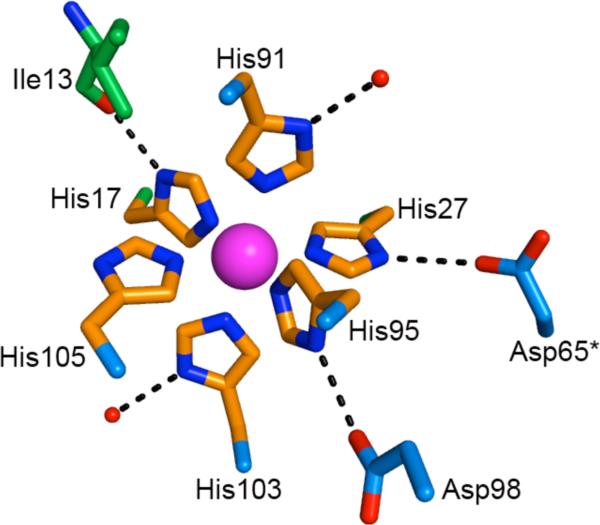
Our refinement indicates that the Mn(II)-His6 site excludes solvent water from the primary coordination sphere, resulting in a remarkably dry Mn(II) coordination environment. Furthermore, there are hydrogen bonding interactions between the Mn(II)-coordinating His residues and additional protein side chains. We hypothesize that these interactions limit water in the secondary coordination sphere. Indeed, only two ordered water molecules are observed in the secondary coordination sphere of Mn(II) at site 2 (Figure 2). The atoms (A9)His91 Nδ1 and (A9)His103 Nδ1 each form a hydrogen-bonding interaction with these ordered solvent water molecules. Additionally, (A8)His17 Nδ1 forms a hydrogen bond with the backbone carbonyl of (A8)Ile13, and (A9)His95 Nδ1 forms a hydrogen bond with (A9)Asp98. The atom (A8)His27 Nδ1 forms a hydrogen bond at the dimer-dimer interface with Asp65 from the second S100A9 polypeptide chain (Figure 2). These hydrogen-bonding interactions may contribute to the thermodynamic stability of Mn(II)- and Ca(II)-bound CP as well as charge neutralization at the His6 site.
Figure 2.
Hydrogen-bonding interactions at the Mn(II)-His6 site of Mn(II)- and Ca(II)-bound CP-Ser. Mn(II)-coordinating residues are shown as orange sticks and the Mn(II) ion is represented as a pink sphere. Additional residues are shown as green (S100A8) or blue (S100A9) sticks. The asterisk indicates that the residue is derived from an adjacent “dimer” of the α2β2 tetramer.
Mn(II) X-Band CW EPR of CP-Ser and Mutant Proteins in the Presence of Ca(II)
The CW EPR spectrum of Ca(II)- and Mn(II)-bound CP-Ser (75 mM HEPES, 100 mM NaCl, pH 7.5, 10 equiv. of Ca(II)) was previously reported, and the Spincount simulation (D = 270 MHz, E/D = 0.30, Table 2) indicated a nearly idealized octahedral Mn(II) coordination sphere.10 In the current work, we further probed the Mn(II) coordination sphere of CP-Ser and select metal-binding site mutants using CW and pulse EPR spectroscopies. The EPR samples were prepared with 0.9 equivalents of Mn(II) and 10 equivalents of Ca(II). Under these conditions, we expect that Mn(II) is bound only at the His6 site and all four EF-hand domains contain Ca(II) or Na(I), as seen in the crystal structure presented in Figure 1. Representative low temperature (10 K) X-band (9.4 GHz) CW EPR spectra of CP-Ser, and the ΔHis3Asp and H103A mutants are presented in Figure 3. Additional spectra of CP mutants are presented in Figure S5.
Table 2.
Zero-field splitting parameters of select six-coordinate Mn(II) complexes
| Complex/Protein | |D| (MHz) | |E| (MHz) | E/D | Coordination Motif | Reference |
|---|---|---|---|---|---|
| Mn(Im)6a | 354 | 66 | 0.19 | N6 | 46 |
| CP-Ser | 270 | 81 | 0.30 | N6 | 10 |
| CP-Ser | 485 | 145.5 | 0.30 | N6 | This work |
| ΔHis3Asp | 485 | 145.5 | 0.30 | N6 | This work |
| H103A | 650 | 105 | 0.30 | N5O1 | This work |
| OxDc (site 1) b | 1200 | 250 | 0.21 | N3O3 | 47 |
| OxDc (site 2) | 2700 | 675 | 0.25 | N3O3 | 47 |
| Concanavalin A | 645 | 71 | 0.11 | N1O5 | 48 |
| Creatine kinase (PO43−) c | 673 | 108 | 0.16 | O6 | 49 |
| Creatine kinase (NO3-) c | 1471 | 191 | 0.13 | O6 | 49 |
| Creatine kinase (NO2-) c | 1121 | 370 | 0.33 | O6 | 49 |
| FosA + fosfomycin d | 6900 | 600 | 0.09 | N2O3 | 50 |
Mn(II) hexaimidazole.
Oxalate decarboxylase.
Variable anions that prevent reactivity are included in the creatine kinase simulations. All reported numbers are the absolute value.
Fosfomycin is the substrate of FosA.
Figure 3.
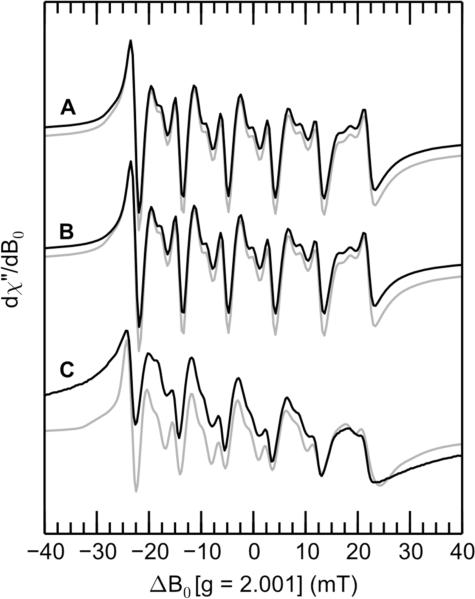
X-band CW EPR spectra (black traces) and simulations (gray traces) of Mn(II)- and Ca(II)-bound CP-Ser (A), ΔHis3Asp (B), and H103A (C). Simulation parameters are given in Table 2. Spectrometer settings: νmw = 9.4 GHz, 0.5 mT modulation at 100 KHz, power = 0.2 mW, temperature = 10 K. Sample conditions: 200 μM CP, 180 μM Mn(II), 2.0 mM Ca(II) at pH 7.5 (75 mM HEPES, 100 mM NaCl, 20% (v/v) PEG 200).
The isotropic g-value of 2.001 observed for these samples is typical for high-spin d5 Mn(II) ions and results from the near-spherical symmetry of the electron spin distribution around the Mn(II) center. The sextet of EPR features centered at g = 2.001 arises from the hyperfine coupling of the 55Mn nucleus (I = 5/2, 100% abundance) with the ms = ±1/2 electron spin manifolds. The hyperfine-induced splitting of the four outer manifold (ms= ±1/2 ↔ ms = ±3/2 and ms= ±3/2 ↔ ms = ±5/2) EPR transitions is rarely resolved in spectra of frozen solutions because of the orientation-dependent spectral broadening of EPR transitions in these spin manifolds.51,52 The spectra in Figure 3 reveal that both CP-Ser and ΔHis3Asp samples exhibit identical Mn(II) spectroscopic signatures. This result is in agreement with prior work10 and indicates that there is no Mn(II) coordinated by site 1 under these conditions. For CP-Ser and the ΔHis3Asp mutant, the hyperfine coupling to the 55Mn nucleus was found to be isotropic with a magnitude of 247 MHz. This value is low relative to published values; reported 55Mn hyperfine coupling values are typically > 255 MHz.47,53–55 The low coupling constant is consistent with the high number of His ligands and the reported trend of decreased 55Mn hyperfine coupling as more imidazoles are bound to a Mn(II) ion.53 Between each pair of lines of the sextet lie two formally forbidden Δms = ±1, ΔmI = ±1 transitions. By paying particular attention to the ratio of the intensity of the forbidden EPR transitions to that of the allowed EPR transitions, as well as the overall spectral lineshape and width, simulation of the CP-Ser spectrum (Figure 3A) using EasySpin afforded a value for the axial component of the zero-field splitting tensor, D = 485 MHz (E/D = 0.30). Although this D value is somewhat larger than the D value obtained previously,10 it is still small compared to the reported D values for other Mn(II) complexes (Table 2). A low D value can be indicative of a highly symmetric coordination environment, in accordance with the hexahistidine Mn(II)-binding site observed crystallographically. The ΔHis3Asp spectrum can be simulated using the same parameters as CP-Ser (Figure 3B), which provides further support for the notion that Mn(II) is exclusively coordinated by the His6 motif under these conditions.
The spectrum of the Mn(II)-H103A mutant reveals that, upon mutation of one of the Mn(II)-coordinating His residues to Ala, the intensity of the forbidden transitions relative to the allowed transitions increases significantly (Figure 3C).11 This increase in forbidden transition intensity was also seen in the spectra of CP upon single point mutations of the His4 motif.10 Such forbidden transitions typically gain intensity as the ZFS increases.56 In agreement with this observation, simulation of the Mn(II)-H103A signal afforded a D value of 650 MHz (Figure 3C). This D value remains in the range for six-coordinate Mn(II) (|D| < 3000 MHz), but suggests that the symmetry of the Mn(II)-binding site has decreased as expected with the loss of one histidine ligand.
Q-Band ENDOR and ESEEM Spectroscopic Studies Confirm a Highly Symmetric Mn(II)-His6 Site in Solution in the Presence of Ca(II)
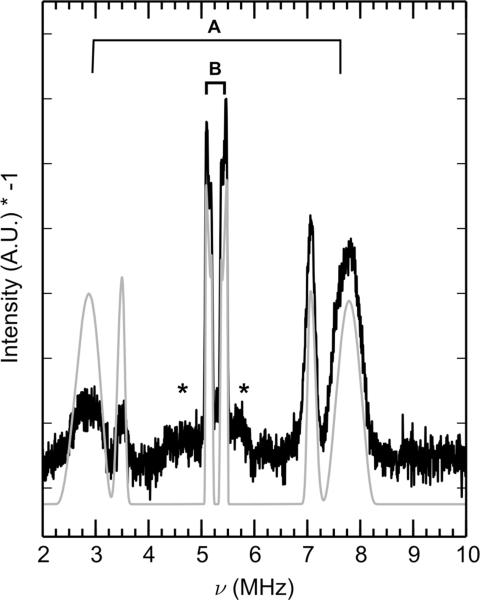
Pulse EPR spectroscopy was employed to further characterize the nitrogen atoms of the high-affinity Mn(II)-His6 site in the presence of 10 equivalents of Ca(II). Samples of CP-Ser were globally labeled with 15N (I = 1/2)—denoted 15N-CP-Ser—in order to probe only the hyperfine interaction by eliminating the quadrupole interaction intrinsic to the 14N (I = 1, 99.6% abundance) nucleus. The Q-band (≈34.1 GHz) Mims-ENDOR spectrum (Figure 4) of Mn(II)- and Ca(II)-bound 15N-CP-Ser revealed two sets of doublets centered at the 15N Larmor frequency (5.3 MHz at 1222.5 mT). The full hyperfine coupling tensors for the two classes of 15N nuclei are summarized in Table 3. We assign the broader, larger spaced doublet (denoted A in Figure 4), simulated with aiso = 4.36 MHz, to 15N of the proximal histidine nitrogens (Nε2) that directly coordinate Mn(II). These peaks are artificially split by tau-dependent blind spots intrinsic to Mims-ENDOR (so-called Mims holes), an effect that is verified by collecting the data at different tau values (Figure S6). The narrower, more closely spaced doublet (denoted B) is simulated with the isotropic hyperfine coupling (aiso) of 0.24 MHz, and is assigned to the distal nitrogen atoms (Nδ1) on the imidazole rings. The approximately 18x larger coupling of Nε2 relative to Nδ1 is consistent with the ratio of proximal-to-distal nitrogen isotropic hyperfine couplings observed in other histidine-coordinated metal systems.57–59 The lack of more than two sets of doublets in the 15N ENDOR spectrum demonstrates the spectroscopic equivalence of the histidine moieties that comprise the Mn(II)-binding site. These couplings are to the central mS = ± 1/2 manifolds of the S = 5/2 Mn(II) ion. Couplings to the higher mS manifolds are weak (see * in Figure 4) and are not analyzed in this work.
Figure 4.
Mims ENDOR spectrum (black) of Mn(II)- and Ca(II)-bound 15N-CP-Ser collected at τ = 500 ns and simulation (gray). A corresponds to the proximal nitrogen of the imidazole ring. B corresponds to the distal nitrogen of the imidazole ring. The asterisk (*) indicates 15N ENDOR transitions coupled to the ms= ±1/2 ↔ ms = ±3/2 EPR transitions. Simulation of ms = ±1/2 for the two classes of nitrogen atoms (gray) were obtained using the parameters listed in Table 3. Spectra at additional τ values are presented in Figure S6. Spectrometer settings: νmw = 34.1 GHz, B0 = 1222.5 mT, 8 ns π/2, temperature = 10 K. Sample conditions: 200 μM 15N-CP-Ser, 180 μM Mn(II), 2.0 mM Ca(II) at pH 7.5 (75 mM HEPES, 100 mM NaCl, 20% (v/v) PEG 200).
Table 3.
Hyperfine coupling (MHz) to magnetic nuclei in CP-Ser a
| Nucleus | a iso | a 1 | a 2 | a 3 |
|---|---|---|---|---|
| 55Mn(II) | 247 | n.a.b | n.a. | n.a. |
| 15Nε2 (proximal) | 4.36 | 3.45 | 3.71 | 5.91 |
| 15Nδ1 (distal) | 0.24 | 0.11 | 0.18 | 0.42 |
| 14Nε2 (proximal) | 3.11 | 2.46 | 2.64 | 4.21 |
| 14Nδ1 (distal) | 0.17 | 0.08 | 0.13 | 0.30 |
| Mn(Im6) (proximal 14N)c | 3.19 | 2.50 | 2.62 | 4.45 |
Samples contained 200 μM CP-Ser at pH 7.5 (75 mM HEPES, 100 mM NaCl) with 10 equivalents of Ca(II) and 0.9 equivalents of Mn(II).
n.a., not applicable.
Mn(Im)6 hyperfine coupling constants are taken from reference 46.
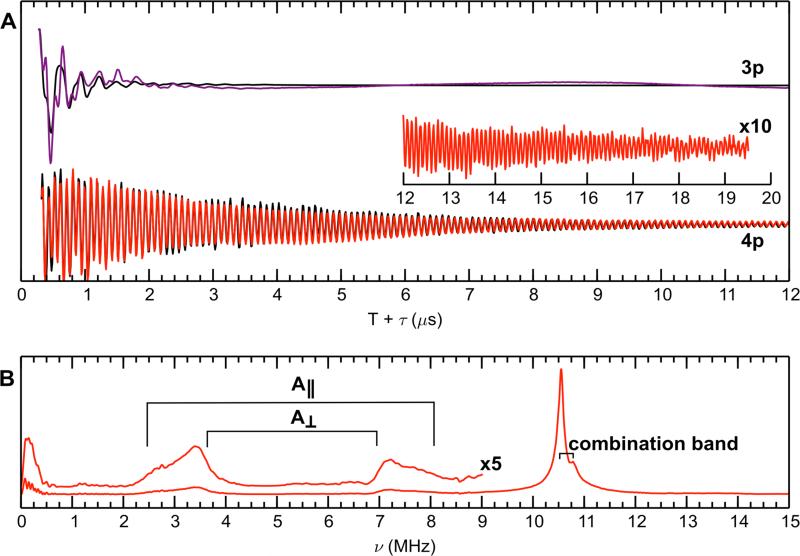
The Q-band time domain 3-pulse and 4-pulse ESEEM spectra of 15N-CP-Ser (+Ca) are presented in Figure 5A. These 15N ESEEM spectra are well simulated using the coupling constants derived from the above ENDOR spectroscopic study (Figure 4). The corresponding Fourier transform of the 4-pulse ESEEM data is presented in Figure 5B. The 15N transitions of the coordinating imidazole nitrogen atoms are the pair of features centered at 3.1 and 7.5 MHz. The sharp peak at 10.6 MHz results from the sum of these two fundamental 15N frequencies. This combination peak is naturally sharper than the fundamental peaks because orientation dependences in each fundamental peak are nulled in the sum combination peak.60 The modulation in the 4-pulse ESEEM spectrum is remarkably long-lived (>19 μsec) and indicative of well-defined and equivalent 15N frequencies from the six coordinating Nε2 ligands.
Figure 5.
3-pulse (purple line) and 4-pulse (red line) ESEEM of Mn(II)- and Ca(II)-bound 15N-labeled CP-Ser at 34.1 GHz. The top panel (A) is the time domain. The bottom panel (B) is the Fourier transform of the 4-pulse ESEEM time domain. The black traces represent simulations of each spectrum, and the parameters are listed in Table 3. Spectrometer settings: νmw = 34.1 GHz, π/2 = 8 ns, τ = 200 ns, T0 = 120 ns, temperature = 10 K, shot repetition time = 1500 μs, B0 = 1223.7 mT. Sample conditions: 200 μM 15N-CP-Ser, 180 μM Mn(II), 2.0 mM Ca(II) at pH 7.5 (75 mM HEPES, 100 mM NaCl, 20% (v/v) PEG 200).
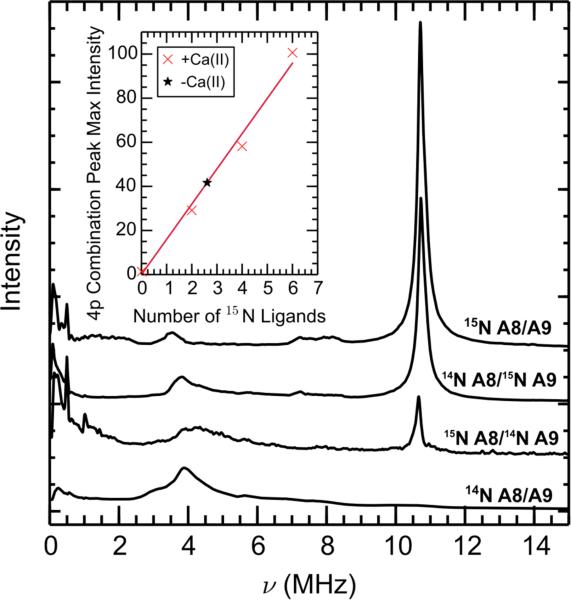
In addition to globally labeled 15N-CP-Ser, we prepared mixed-labeled samples of ΔHis3Asp where only one subunit was 15N-labeled. We accomplished this labeling scheme by expressing one S100A8/S100A9 subunit in minimal medium containing 15N ammonium chloride as the sole nitrogen source and the other subunit in minimal medium with nitrogen at natural abundance. This procedure provided a set of samples with zero 15N (a natural abundance sample), two 15N (15N(A8)- ΔHis3Asp), four 15N (15N(A9)-ΔHis3Asp), and six 15N (15N-ΔHis3Asp) derived from 15N-labeled His residues contributing to the Mn(II) coordination sphere. The 4-pulse ESEEM Fourier transformation for each of these four samples are shown in Figure 6. The inset shows an approximately linear trend in the amplitude of the combination 15N peak at 10.6 MHz with respect to the number of 15N nitrogen ligands. Hyperfine sublevel correlation (HYSCORE) spectra of fully and partially 15N-labeled species are presented in Figures S7-S10.
Figure 6.
Frequency domain of 4-pulse ESEEM spectra of Mn(II)- and Ca(II)-bound mixed 14N/15N-labeled ΔHis3Asp with 0.9 equivalents of Mn(II). The inset is a graph of maximum intensity of the combination peak vs the number of 15N ligands. The black * represents the intensity of the 15N sum combination line measured for 15N-labeled Mn(II)-CP in the absence of Ca(II) (vide infra) and was not used in the calculation of the best fit line. The number of 15N ligands for this point was calculated using the linear relationship determined from the best-fit line. Spectrometer settings: νmw = 34.1 GHz, B0 = 1240 mT, π/2 = 8 ns, τ = 200 ns, T0 = 40 ns, temperature = 10 K. All samples contained 200 μM ΔHis3Asp, 2 mM Ca(II), and 180 μM Mn(II) at pH 7.5 (75 mM HEPES, 100 mM NaCl, 20% (v/v) PEG 200).
Exchangeable Proton Counting Reveals that the C-Terminal Tail of S100A9 Prevents Water Access to Bound Mn(II)
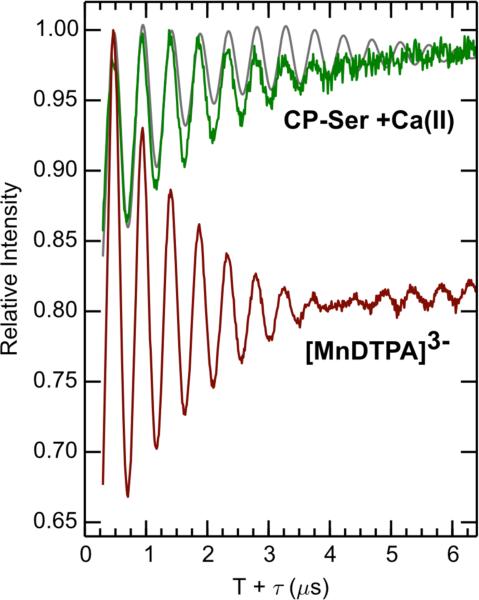
The amino acid sequence of the C-terminal tail, defined as residues 96-114 of S100A9, is EGDEGPGHHHKPGLGEGTP where the Mn(II)-coordinating His103 and His105 residues are shown in boldface. The crystal structure of the Ca(II)-bound CP-Ser heterotetramer (PDB 1XK4) revealed a disordered tail region, indicating that the tail is dynamic in the absence of Mn(II).18 We previously characterized the Mn(II)-binding properties and antimicrobial activity of a mutant family to probe the consequences of perturbation of the HXH motif on CP function,11 and hypothesized that solvent water may contribute to Mn(II) coordination in the absence of His103 and/or His105. To evaluate this notion, we employed 3-pulse ESEEM spectroscopy to determine the number of exchangeable deuterons in the immediate vicinity of the Mn(II) ion bound to H103A, H104A, H105A, AHA, and AAA mutants of CP in the presence of 10-fold Ca(II) (see the Experimental section for details on this procedure). In previous water-counting studies using 2H2O-enriched buffer, we employed [Mn(DTPA)]3- (DTPA = diethylaminetriaminepentaacetic acid) as a spectroscopic standard for Mn(II) with zero bound water because the hexacoordinate DTPA chelating ligand excludes water from the first coordination sphere of manganese;36,37,61 however, the outer sphere is fully exposed to solvent 2H2O. Figure 7 compares the 2H2O/H2O ratioed 3-pulse ESEEM spectra, which eliminates contributions from other magnetic nuclei such as 14N, of Mn(II)-bound CP and [Mn(DTPA)]3-. The 2H modulation of Mn(II)-CP is appreciably weaker than that of the DTPA chelate, demonstrating that the Mn(II) has no inner sphere waters and that its hexahistidine site is shielded from 2H exchange into the outer sphere as well. A simulation using a dipolar coupling of 0.26 MHz (r = 3.6 Å) partially reproduces the persistent 2H modulation in the 2H2O/1H2O ratioed 3-pulse ESEEM spectrum of CP-Ser. Further evidence for the absence of inner-sphere exchangeable deuterons in CP-Ser is provided by the proton Davies ENDOR spectra of Mn(II)- and Ca(II)-bound CP-Ser in H2O and 2H2O buffer (Figure S11). A comparison of these spectra reveals that exchanging Mn(II)- and Ca(II)-bound CP-Ser into 2H2O buffer has only a modest effect on the 1H ENDOR spectrum, decreasing the intensity only at the 1H Larmor frequency, which indicates that only weakly coupled and distant protons are replaced. Thus, the pulse EPR results of Mn(II)- and Ca(II)-bound CP-Ser in solution are consistent with the dry Mn(II) environment revealed in our X-ray structure, which was obtained at comparable Mn(II) and Ca(II) concentrations (Figure 2).
Figure 7.
2H2O/H2O 3-pulse ESEEM time domain of Mn(II)- and Ca(II)-bound CP-Ser (green) and [MnDTPA]3- (brown-red). Deuterons for the CP-Ser sample (gray line) are simulated with reff = 3.6 Å (aiso = 0 MHz, T = 0.26 MHz). Spectrometer settings: νmw = 9.525(5) GHz, B0 = 327.35 mT, π/2 = 8 ns , τ = 216 ns, T0 = 80 ns, temperature = 10 K. Sample conditions: 200 μM CP, 180 μM Mn(II), 2.0 mM Ca(II) at pH 7.5 (75 mM HEPES, 100 mM NaCl, 20% (v/v) PEG 200).
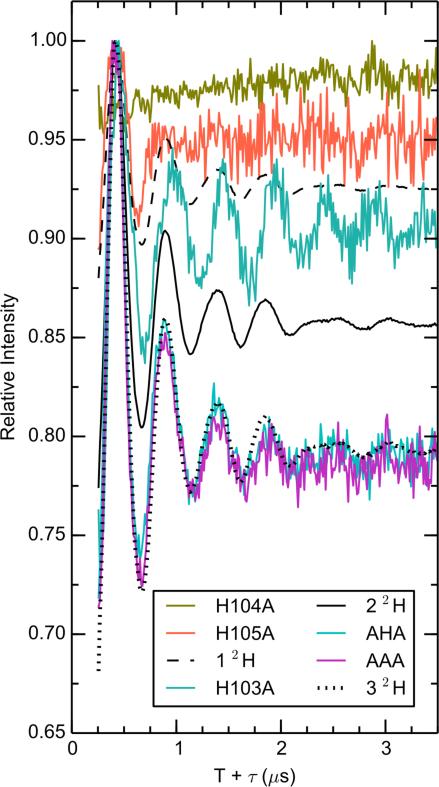
We next examined the effect of mutating histidine ligands of the S100A9 tail region on the hydration of the Mn(II) center. The double ratioed (2H2O/H2O [mutant]/ 2H2O/H2O [CP-Ser]) ESEEM spectra are shown in Figure 8. This presentation emphasizes the changes induced by the specific mutation. Standard modulation curves for 1 through 4 inner sphere deuterons are provided (see Experimental Section). H104 does not coordinate Mn(II) and, as expected, the H104A mutant shows no additional deuteron modulation relative to the inner sphere deuteron standards. Mutations at the two tail histidine ligand sites introduce appreciable 2H modulation, with approximately one inner sphere deuteron appearing in the H105A mutant and close to two inner sphere deuterons appearing in the H103A mutant. Furthermore, the AHA and AAA mutants, both of which lack the Mn(II)-coordinating His residues of the tail, show deep deuteron modulation, consistent with three inner sphere deuterons. Compared to the shallow and persistent 2H modulation of CP-Ser, the inner sphere 2H modulation damps quickly in the time domain, corresponding to wider peaks in the Fourier transform (not shown) due to the stronger dipolar hyperfine couplings. We conclude that in the absence of the histidine ligands from the tail, water and/or hydroxide can access the Mn(II) inner coordination sphere.
Figure 8.
Exchangeable proton counting of Mn(II) bound to H103A, H104A, H105A, AHA, or AAA. Black lines are calculated modulations for 1, 2, or 3 coordinating deuterons. Spectrometer settings: νmw = 9.525(5) GHz, B0 = 327.35 mT, 8 ns π/2, τ = 216 ns, T0 = 80 ns, temperature = 10 K. Sample conditions: 200 μM CP, 180 μM Mn(II), 2.0 mM Ca(II), pH 7.5 (75 mM HEPES, 100 mM NaCl, 20% (v/v) PEG 200).
A decrease in symmetry of the Mn(II) center will result from loss of a native histidine ligand and occupation of the vacant Mn(II) coordination site with a water molecule or hydroxide ion. Indeed, the CW EPR spectra of the H103A and H105A mutants (Figures 3 and S4) indicate that the symmetry of the Mn(II)-binding site has been dramatically lowered with loss of a histidine ligand, as supported by a significant increase in the magnitude of the ZFS interaction. Simulation of the CW EPR data for the H103A mutant yielded a D value of approximately 650 MHz (Table 2). For the spectrum of the H105A mutant, a value of D could not be determined as a result of the more complex line shape; however, the ratio of the allowed EPR transition intensity to that of the forbidden transitions is diminished compared to that observed in the spectrum of the H103A mutant, which indicates that the Mn(II) bound to H105A CP-Ser (Figure S4) has the highest ZFS of the single point mutants we investigated (> 650 MHz). Thus, based on the ZFS parameters discerned from analysis of the CW EPR spectra of the CP mutants, the Mn(II) ion coordination environment becomes less symmetric according to the trend CP-Ser > H103A > H105A with the H105A mutant exhibiting the lowest symmetry.
The ESEEM and CW EPR data together establish that the Mn(II) ion at the His6 site becomes solvent exposed in the absence of His103 and/or His105. The direct demonstration of increased solvent accessibility upon mutating residues of the His6 site is important for understanding the ability of CP to sequester labile Mn(II). Our results are consistent with a model where encapsulation of Mn(II) by the C-terminal tail of S100A9 is essential for metal sequestration, and that solvent exposure makes the Mn(II) ion more kinetically labile. Although the AHA and AAA mutants retain the ability to bind Mn(II), these mutants are unable to sequester Mn(II).11
We note that capture of Mn(II) at the His6 site of Ca(II)-bound CP is reminiscent of synthetic small-molecule cages designed to coordinate first-row transition metal ions with high affinity. In particular, the sarcophagines are macrobicyclic hexa-amine ligands that encapsulate labile metal ions, including high-spin Mn(II).62,63
Mn(II) Binding to CP-Ser is Promiscuous in the Absence of Ca(II)
Because the Mn(II)-chelating properties of CP are Ca(II)-dependent, we next applied EPR to further characterize Mn(II)-CP in the absence of Ca(II) with the goal of ascertaining whether changes in the Mn(II) electronic/geometric structure or speciation occur. In prior work, we concluded that CP-Ser (−Ca) binds Mn(II) with micromolar affinity at site 2 (Kd, site 2 = 4.9 ± 1.0 μM, determined by RT-EPR titrations).10 These studies also demonstrated that the interfacial His4 motif of site 2 is required for appreciable Mn(II) complexation in the absence of Ca(II).10 On the basis of the observed micromolar Mn(II) affinity of CP-Ser (−Ca), and to minimize free Mn(II) in the sample, we prepared a Mn(II):CP sample with 180 μM Mn(II) and 1.0 mM CP-Ser (vide infra).
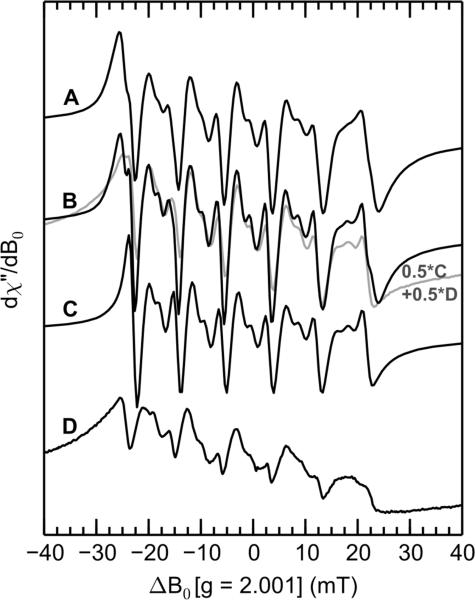
In agreement with our prior work,10,11 the low-temperature X-band CW EPR spectra of Mn(II)-CP-Ser in the presence and absence of excess Ca(II) markedly differ (Figures 3A and 9A). In the absence of Ca(II), all of the spectral features for Mn(II) appear to broaden significantly. When the –Ca(II) sample was buffer exchanged into buffer prepared with 2H2O, sharpening of some features occurred (traces A and B in Figure 9). This observation is consistent with significant hyperfine interactions between the Mn(II) and solvent-exchangeable hydrogen. Moreover, in the spectrum of the −Ca(II) sample prepared in 2H2O, the lowest-field member of the Mn(II) sextet centered at −25 mT is clearly split (Figure 9B), which suggests that at least two magnetically distinct Mn(II)-containing species contribute to the EPR spectrum in this region. This splitting can be approximately modeled by a linear combination of the 2H2O-exchanged Mn(II)- and Ca(II)-bound CP-Ser spectrum (Figure 9C) and a spectrum of [Mn(2H2O)6]2+ (Figure 9D) in a 1:1 ratio (Figure 9B, gray trace).
Figure 9.
X-band CW EPR spectra of (A) Mn(II)-bound CP-Ser in H2O, (B) Mn(II)-bound CP-Ser in 2H2O, (C) Mn(II)- and Ca(II)-bound CP-Ser in 2H2O, (D) 200 μM MnCl2 in 2H2O with 20% (v/v) PEG 200. The gray trace is a linear combination of ½ C and ½ D. Spectrometer settings: νmw = 9.4 GHz, 0.5 mT modulation at 100 KHz, power = 0.2 mW, temperature = 10 K. Protein sample conditions: 1 mM CP-Ser (–Ca) or 200 μM CP-Ser (+Ca), 180 μM Mn(II), pH 7.5 (75 mM HEPES, 100 mM NaCl, 20% (v/v) PEG 200), ± 2 mM Ca(II).
In order to further evaluate the Mn(II) speciation in the –Ca(II) sample, room-temperature EPR (RT-EPR) was employed to quantify the amount of unbound Mn(II) in the sample. Whereas [Mn(H2O)]2+ gives a six-line pattern centered at g = 2 at room temperature, Mn(II) coordinated by macromolecules does not give rise to a detectable signal. Furthermore, the RT-EPR Mn(II) signal is quantitative and allows for the concentration of unbound Mn(II) to be determined.64,65 Analysis of the 0.18:1.0 Mn(II):CP-Ser prepared in the absence of Ca(II) revealed a RT-EPR signal that accounted for ca. 10-20% (20-40 μM) of the total Mn(II) (Figure S12). We note that the observed quantity of free Mn(II) is greater than the expected amount calculated by using a Kd value of ≈5 μM that was determined for CP-Ser (–Ca) by RT-EPR. The amount of free Mn(II) concentration increased to approximately 50% of the total when 0.9 equiv of Mn(II) was added to CP-Ser in the absence of Ca(II) (Figure S12). On the basis of this quantification, and to minimize the free Mn(II) signal, we decided to further investigate Mn(II) complexation by CP-Ser in the absence of added Ca(II) using samples prepared with 0.18:1 Mn(II):CP-Ser.
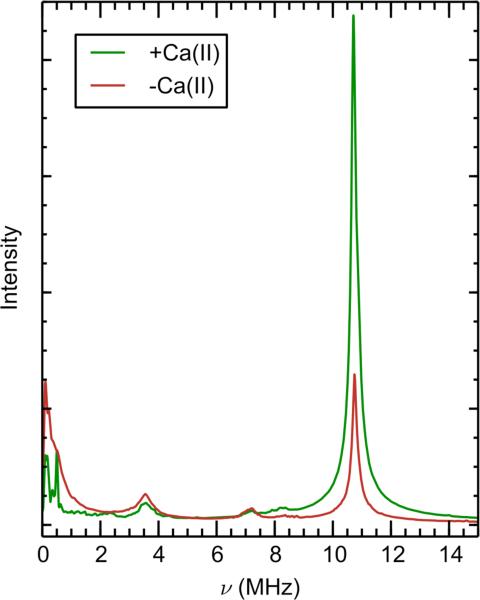
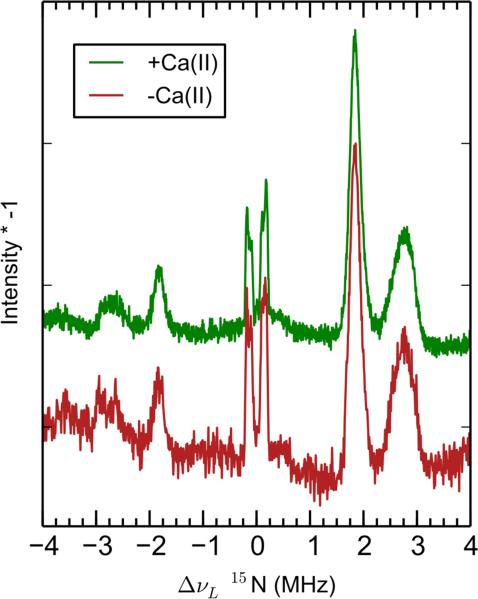
In prior Mn(II)-binding studies of CP-Ser, the inclusion of additional low-affinity (1.0 mM) Mn(II)-binding events was necessary to fit the RT-EPR Mn(II) titration curve. This analysis indicated the presence of additional Mn(II)-binding sites in the absence of Ca(II). To investigate this possibility, the speciation of Mn(II)-CP (–Ca) was interrogated by pulse EPR. The 4-pulse ESEEM Fourier transforms of 15N-CP-Ser in the presence and absence of Ca(II) are compared in Figure 10. The lineshapes of the 15N ESEEM and ENDOR (Figures 10 and 11, respectively) are the same for –Ca and +Ca samples, showing there is no new or different nitrogen coordination to Mn(II) in the absence of Ca(II). Nevertheless, the 15N 4-pulse ESEEM combination peak amplitude of Mn(II)-CP (–Ca) corresponds to only ca. 2.6 nitrogens per Mn(II) (Figure 6 inset). This observation supports our analysis of the low-temperature CW EPR spectra (Figure 9) in that ca. 50% of the Mn(II) is coordinated by the His6 site in the absence of Ca(II) in this sample containing a 0.18:1 Mn(II):CP-Ser molar ratio. An analysis of the natural abundance 14N modulation in 3-pulse ESEEM data also supports this conclusion (vide infra).
Figure 10.
4-pulse ESEEM frequency domain of 0.18:1 Mn(II):15N-CP-Ser (red) and Mn(II)- and Ca(II)-bound to 15N-CP-Ser. The concentration of Mn(II) in both spectra is 180 μM. Spectrometer settings: νmw = 34.1 GHz, B0 ~ 1240 mT, π/2 = 8 ns, τ = 200 ns, T0 = 80 ns, temperature = 10 K. Protein sample conditions: 1 mM CP-Ser (–Ca) or 200 μM CP-Ser (+Ca), 180 μM Mn(II), pH 7.5 (75 mM HEPES, 100 mM NaCl, 20% (v/v) PEG 200, ± 2 mM Ca(II).
Figure 11.
Mims-ENDOR of Mn(II)-bound 15N-CP-Ser in the absence (red) and presence (green) of Ca(II). Spectrometer settings: νmw = 34 GHz, B0 ~ 1240 mT, π/2 = 8 ns, τ = 448 ns, T = 400 ns, temperature = 10 K. Protein sample conditions: 1 mM CP-Ser (–Ca) or 200 μM CP-Ser (+Ca), 180 μM Mn(II), pH 7.5 (75 mM HEPES, 100 mM NaCl, 20% (v/v) PEG 200), ± 2 mM Ca(II).
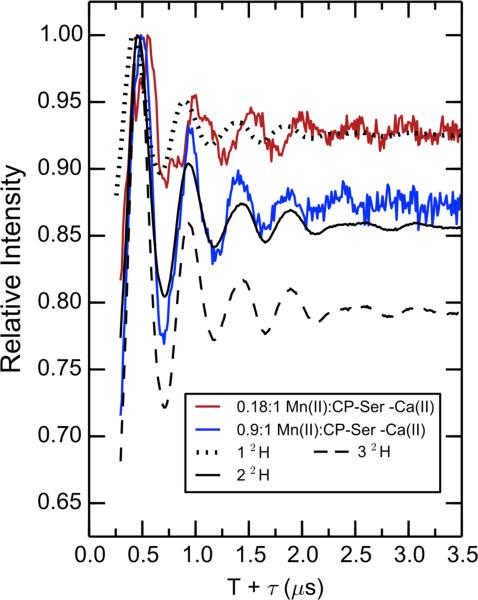
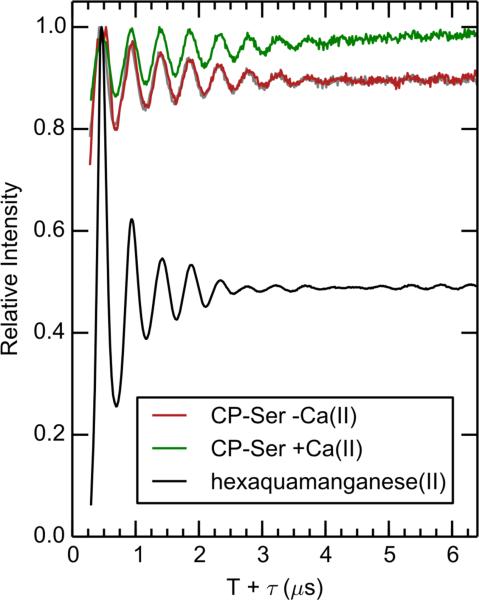
Next, the degree of hydration of the Mn(II) site(s) in the absence of Ca(II) was assessed by ESEEM as described for the +Ca(II) samples. Consistent with prior observations, the hydration level increases with increasing Mn(II) in the –Ca(II) samples. Indeed, the samples prepared with 0.18:1.0 and 0.9:1.0 Mn(II):CP-Ser ratios have approximately one and two exchangeable protons, respectively (Figure 12). The 2H2O/H2O ratioed 3-pulse ESEEM, spectrum of CP-Ser (–Ca) with 0.18 equivalents of Mn(II) shows a significant increase in the amount of residual 2H modulation compared to that for the corresponding +Ca(II) sample (Figure 13). This deuterium modulation can be accounted for by scaling the 2H2O/H2O ratioed 3-pulse ESEEM spectrum of aqueous Mn(II) to correspond to 12% of the total Mn(II) concentration. This value is within the 10-20% range of unbound Mn(II) predicted by our RT-EPR analysis (Figure S12). Thus, all inner-sphere water detected in the ratioed ESEEM spectrum can be accounted for by the fraction of aqueous Mn(II) in the –Ca sample.
Figure 12.
Exchangeable proton counting of Mn(II)-bound CP-Ser with varying ratios of Mn / CP. Spectrometer settings: νmw = 9.525(5) GHz, B0 = 327.35 mT, π/2 = 8 ns, τ = 216 ns, T0 = 80 ns, temperature = 10 K. Protein sample conditions: 1 mM CP-Ser (red) or 200 μM CP-Ser (blue), 180 μM Mn(II), pH 7.5 (75 mM HEPES, 100 mM NaCl, 20% (v/v) PEG 200).
Figure 13.
2H2O/H2O 3-pulse ESEEM time domain of Mn(II)-bound CP-Ser in the absence (red) and presence (green) of Ca(II). The protein samples contain 180 μM of Mn(II), and an equivalent concentration of manganese hexaaqua is shown in black. The gray line overlaying the –Ca(II) CP-Ser data is a linear combination of 0.12*hexaquamanganese and 0.88*Mn(II) and Ca(II)-bound CP-Ser. Spectrometer settings: νmw = 9.525(5) GHz, B0 = 327.35 mT, π/2 = 8 ns, τ = 216 ns, T0 = 80 ns, temperature = 10 K. Sample conditions: 1.0 mM CP-Ser (–Ca) or 200 μM CP-Ser (+Ca), 180 μM Mn(II), pH 7.5 (75 mM HEPES, 100 mM NaCl, 20% (v/v) PEG 200), ± 2 mM Ca(II).
In total, these data suggest that Mn(II) binds to several different sites in CP when Ca(II) is omitted from the buffer. For a 1.0 mM CP-Ser (–Ca) sample containing 180 μM Mn(II), we determine that ≈90 μM of the Mn(II) is coordinated by the His6 site and 20-40 μM exists as aqueous Mn(II). Because no new features are observed in either the 15N 4-pulse ESEEM or the Mims ENDOR spectra (Figures 10 and 11) as a result of omitting Ca(II) from the Mn(II)-CP sample, the remainder of Mn(II) (≈50-70 μM) must be bound to a site (or sites) that do not contain nitrogen ligands. Furthermore, the additional Mn(II)-binding site(s) appears to coordinatively saturate the Mn(II) ion as there is no 2H modulation in the 2H2O/H2O ratioed 3-pulse ESEEM spectrum of the −Ca(II) sample that cannot be attributed to the modest amount of aqueous Mn(II) observed by RT-EPR spectroscopy.
Candidates for the additional Mn(II) sites include site 1 (His3Asp) and the EF-hand domains. The previous Mn(II)-bound crystal structure (PDB ID 4GGF), obtained with Ca(II) present in the crystallization conditions, showed Mn(II) bound at Site 1 in a 5-coordinate geometry with a bidentate interaction from Asp30.13 Pentacoordinate Mn(II) sites are characterized by large zero-field splittings (D is typically greater than 3000 MHz) and give rise to distinct EPR spectra.50,66,67 We see no such evidence for such spectroscopic features in the CW EPR spectrum of the –Ca(II) sample. Nevertheless, simulations of Mn(II) EPR spectra with ZFS values ranging from 1,000 to 10,000 MHz, along with a representative Mn(II) spectrum with a ZFS of 500 MHz indicate that detecting a high-ZFS species in the presence of the Mn(II)-His6 signal is difficult (Figure S14).
The EF-hand domains provide multi-dentate coordination spheres comprised of oxygen donor atoms (Table 1), and select EF-hand domains are reported to chelate Mn(II).68,69 For instance, a crystal structure of the N-terminal domain of calmodulin crystallized in the presence of Mn(II) revealed an octahedral Mn(II) center where the primary coordination sphere includes two solvent water molecules.69 In prior work, we suggested that Mn(II) may associate with the vacant EF-hand domains of CP-Ser with low affinity10 and our current investigation provides additional support for Mn(II) binding in such coordination environments. Indeed, the ligand framework provided by an EF-hand domain is expected to give rise to a Mn(II) CW EPR spectrum with similar g and A values as [Mn(H2O)6]2+.47,48,68 Although Mn(II) binding in the His3Asp site remains a possibility on the basis of the current spectroscopic results, we propose that in the absence of Ca(II), Mn(II) is coordinated by the His6 site as well as the EF-hand domains of CP-Ser. In prior studies, we observed no Mn(II) binding to CP-Ser-ΔHis4 (site 2 mutant) or ΔΔ (site 1 / site 2 mutant) by RT-EPR in the absence of Ca(II).10 Thus, we reason that the EF-hand domains cannot bind Mn(II) to an appreciable degree in the absence of site 2. Taken together with our current proposal, it appears that Mn(II) chelation at site 2 enhances the Mn(II) affinity of the EF-hands, which suggests cooperativity between the His6 site and EF-hand domains. Each CP heterodimer unit harbors four different EF-hand domains, and elucidating the identities of the putative Mn(II)-binding EF-hands is a subject for future work. On the basis of prior studies68,69 and the X-ray crystallographic work presented here, we reason that the C-terminal canonical EF-hands of S100A8 and S100A9 are the most probable sites for Mn(II) binding.
Summary
In the current work, we address the Ca(II)-dependent Mn(II)-binding properties of the human host-defense protein CP, and present crystallographic and EPR spectroscopic characterization of human CP in the presence of Mn(II) and Ca(II). In support of our prior solution studies,10 the crystal structure presented here confirms that Mn(II) is coordinated solely at the His6 site when one equivalent of Mn(II) is present. Anomalous diffraction data establishes that the canonical C-terminal EF-hands coordinate Ca(II) whereas the non-canonical N-terminal EF-hands are populated by another ion, reasoned to be Na(I), under crystallographic conditions that included 10 equivalents of Ca(II). This result is consistent with the low Ca(II) affinities reported for characterized non-canonical EF-hands,20,22,24,25 and further structural and biochemical investigations of CP to evaluate the interplay between Ca(II) and Na(I) are warranted. We note that S100A2 and S100A12 have also been crystallized and refined with Na(I) in the non-canonical EF-hands.70,71
The application of EPR spectroscopic methods to studies of CP in the presence of Ca(II) establishes several important facets about how CP sequesters Mn(II) at the His6 site. Mn(II) is bound to the His6 site with a high degree of electronic symmetry as evidenced by the low D value (Table 2) and in agreement with the symmetric His6 site observed crystallographically. Exchangeable proton counting confirmed that mutation of the S100A9 C-terminal tail perturbs the Mn(II) coordination environment and enables solvent access to the Mn(II) center. Taken together with our prior studies of the Mn(II)-chelating properties and antibacterial activity of a C-terminal tail mutant family, we propose that exclusion of water from the primary coordination sphere of the Mn(II) center is essential for Mn(II) sequestration. Lastly, pulse EPR spectroscopy enabled further characterization of how the CP-Ser –Ca coordinates Mn(II). Our spectroscopic results demonstrate that (i) CP forms a Mn(II)-His6 coordination sphere at site 2 in the absence of Ca(II) and (ii) CP binds Mn(II) at additional sites in the absence of Ca(II). We propose that the canonical EF-hands coordinate Mn(II) under these conditions. CP (−Ca) therefore houses multiple low-affinity Mn(II)-binding sites, and the addition of excess Ca(II) leads to the formation of a single high-affinity His6 coordination site.
Supplementary Material
Acknowledgements
This work was supported by the National Science Foundation (NSF CHE-1352132 to E.M.N.), the National Institutes of Health (NIH 1DP2OD007045-01 to E.M.N.; GM069857 to C.L.D.; F32 GM099257 to S.E.J.B.), the Department of Energy (DE-FG02-11ER16282 to R.D.B.), the Kinship Foundation (Searle Scholar Award to E.M.N.), and the MIT Department of Chemistry. Crystallographic data were collected at the Advanced Photon Source (APS) on the Northeastern Collaborative Access Team beamlines, which are supported by a grant from the NIGMS GM103403 from the National Institutes of Health. APS is also supported by the U.S. Department of Energy under Contract No. DE-AC02-06CH11357. C.L.D. is a Howard Hughes Medical Institute Investigator. We thank Michael Funk and Marco Jost for assistance with crystallography and X-ray data collection, and Prof. Stefan Stoll for assistance with the 4p ESEEM simulation.
Footnotes
Supporting Information. Tables of protein nomenclature, mass spectrometry, crystal refinement statistics, bond lengths and angles. Figures of overlays of CP structures, additional CW EPR spectra, ENDOR and HYSCORE spectra. This material is available free of charge via the Internet at http://pubs.acs.org.
Conflict of Interest. The authors declare no conflicts of interest.
References
- 1.Lisher JP, Giedroc DP. Front. Cell. Infect. Microbiol. 2013;3:91. doi: 10.3389/fcimb.2013.00091. [DOI] [PMC free article] [PubMed] [Google Scholar]
- 2.Brophy MB, Nolan EM. ACS Chem. Biol. 2015 doi: 10.1021/cb500792b. dx.doi.org/10.1021/cb500792b. [DOI] [PMC free article] [PubMed] [Google Scholar]
- 3.Kehl-Fie TE, Skaar EP. Curr. Opin. Chem. Biol. 2010;14:218–224. doi: 10.1016/j.cbpa.2009.11.008. [DOI] [PMC free article] [PubMed] [Google Scholar]
- 4.Diaz-Ochoa VE, Jellbauer S, Klaus S, Raffatellu M. Front. Cell. Infect. Microbiol. 2014;4:2. doi: 10.3389/fcimb.2014.00002. [DOI] [PMC free article] [PubMed] [Google Scholar]
- 5.Papp-Wallace KM, Maguire ME. Annu. Rev. Microbiol. 2006;60:187–209. doi: 10.1146/annurev.micro.60.080805.142149. [DOI] [PubMed] [Google Scholar]
- 6.Kadioglu A, Weiser JN, Paton JC, Andrew PW. Nat. Rev. Microbiol. 2008;6:288–301. doi: 10.1038/nrmicro1871. [DOI] [PubMed] [Google Scholar]
- 7.Liu JZ, Jellbauer S, Poe AJ, Ton V, Pesciaroli M, Kehl-Fie TE, Restrepo NA, Hosking MP, Edwards RA, Battistoni A, Pasquali P, Lane TE, Chazin WJ, Vogl T, Roth J, Skaar EP, Raffatellu M. Cell Host Microbe. 2012;11:227–239. doi: 10.1016/j.chom.2012.01.017. [DOI] [PMC free article] [PubMed] [Google Scholar]
- 8.Corbin BD, Seeley EH, Raab A, Feldmann J, Miller MR, Torres VJ, Anderson KL, Dattilo BM, Dunman PM, Gerads R, Caprioli RM, Nacken W, Chazin WJ, Skaar EP. Science. 2008;319:962–965. doi: 10.1126/science.1152449. [DOI] [PubMed] [Google Scholar]
- 9.Brophy MB, Hayden JA, Nolan EM. J. Am. Chem. Soc. 2012;134:18089–18100. doi: 10.1021/ja307974e. [DOI] [PMC free article] [PubMed] [Google Scholar]
- 10.Hayden JA, Brophy MB, Cunden LS, Nolan EM. J. Am. Chem. Soc. 2013;135:775–787. doi: 10.1021/ja3096416. [DOI] [PMC free article] [PubMed] [Google Scholar]
- 11.Brophy MB, Nakashige TG, Gaillard A, Nolan EM. J. Am. Chem. Soc. 2013;135:17804–17817. doi: 10.1021/ja407147d. [DOI] [PMC free article] [PubMed] [Google Scholar]
- 12.Kehl-Fie TE, Chitayat S, Hood MI, Damo S, Restrepo N, Garcia C, Munro KA, Chazin WJ, Skaar EP. Cell Host Microbe. 2011;10:158–164. doi: 10.1016/j.chom.2011.07.004. [DOI] [PMC free article] [PubMed] [Google Scholar]
- 13.Damo SM, Kehl-Fie TE, Sugitani N, Holt ME, Rathi S, Murphy WJ, Zhang Y, Betz C, Hench L, Fritz G, Skaar EP, Chazin WJ. Proc. Natl. Acad. Sci. U. S. A. 2013;110:3841–3846. doi: 10.1073/pnas.1220341110. [DOI] [PMC free article] [PubMed] [Google Scholar]
- 14.Donato R. Biochim. Biophys. Acta. 1999;1450:191–231. doi: 10.1016/s0167-4889(99)00058-0. [DOI] [PubMed] [Google Scholar]
- 15.Heizmann CW, Cox JA. Biometals. 1998;11:383–397. doi: 10.1023/a:1009212521172. [DOI] [PubMed] [Google Scholar]
- 16.Hunter MJ, Chazin WJ. J. Biol. Chem. 1998;273:12427–12435. doi: 10.1074/jbc.273.20.12427. [DOI] [PubMed] [Google Scholar]
- 17.Leukert N, Vogl T, Strupat K, Reichelt R, Sorg C, Roth J. J. Mol. Biol. 2006;359:961–972. doi: 10.1016/j.jmb.2006.04.009. [DOI] [PubMed] [Google Scholar]
- 18.Korndörfer IP, Brueckner F, Skerra A. J. Mol. Biol. 2007;370:887–898. doi: 10.1016/j.jmb.2007.04.065. [DOI] [PubMed] [Google Scholar]
- 19.Vogl T, Roth J, Sorg C, Hillenkamp F, Strupat K. J. Am. Soc. Mass Spectrom. 1999;10:1124–1130. doi: 10.1016/s1044-0305(99)00085-9. [DOI] [PubMed] [Google Scholar]
- 20.Gifford JL, Walsh MP, Vogel HJ. Biochem. J. 2007;405:199–221. doi: 10.1042/BJ20070255. [DOI] [PubMed] [Google Scholar]
- 21.Persechini A, Moncrief ND, Kretsinger RH. Trends Neurosci. 1989;12:462–467. doi: 10.1016/0166-2236(89)90097-0. [DOI] [PubMed] [Google Scholar]
- 22.Santamaria-Kisiel L, Rintala-Dempsey AC, Shaw GS. Biochem. J. 2006;396:201–214. doi: 10.1042/BJ20060195. [DOI] [PMC free article] [PubMed] [Google Scholar]
- 23.Eckert RL, Broome A-M, Ruse M, Robinson N, Ryan D, Lee K. J. Invest. Dermatol. 2004;123:23–33. doi: 10.1111/j.0022-202X.2004.22719.x. [DOI] [PubMed] [Google Scholar]
- 24.Garrett SC, Hodgson L, Rybin A, Toutchkine A, Hahn KM, Lawrence DS, Bresnick AR. Biochemistry. 2008;47:986–996. doi: 10.1021/bi7021624. [DOI] [PMC free article] [PubMed] [Google Scholar]
- 25.Donato R. Cell Calcium. 1986;7:123–145. doi: 10.1016/0143-4160(86)90017-5. [DOI] [PubMed] [Google Scholar]
- 26.Morin A, Eisenbraun B, Key J, Sanschagrin PC, Timony MA, Ottaviano M, Sliz P. eLife. 2013;2:e01456. doi: 10.7554/eLife.01456. [DOI] [PMC free article] [PubMed] [Google Scholar]
- 27.Minor W, Cymborowski M, Otwinowski Z, Chruszcz M. Acta Crystallogr. D. 2006;62:859–866. doi: 10.1107/S0907444906019949. [DOI] [PubMed] [Google Scholar]
- 28.McCoy AJ, Grosse-Kunstleve RW, Adams PD, Winn MD, Storoni LC, Read RJ. J. Appl. Crystallogr. 2007;40:658–674. doi: 10.1107/S0021889807021206. [DOI] [PMC free article] [PubMed] [Google Scholar]
- 29.Adams PD, Afonine PV, Bunkóczi G, Chen VB, Davis IW, Echols N, Headd JJ, Hung L-W, Kapral GJ, Grosse-Kunstleve RW, McCoy AJ, Moriarty NW, Oeffner R, Read RJ, Richardson DC, Richardson JS, Terwilliger TC, Zwart PH. Acta Crystallogr. D. 2010;66:213–221. doi: 10.1107/S0907444909052925. [DOI] [PMC free article] [PubMed] [Google Scholar]
- 30.Emsley P, Lohkamp B, Scott WG, Cowtan K. Acta Crystallogr. D. 2010;66:486–501. doi: 10.1107/S0907444910007493. [DOI] [PMC free article] [PubMed] [Google Scholar]
- 31.Sienkiewicz A, Smith BG, Veselov A, Scholes CP. Rev. Sci. Instrum. 1996;67:2134–2138. [Google Scholar]
- 32.Mims WB. Proc. R. Soc. Lond. 1965;283:452–457. [Google Scholar]
- 33.Gemperle C, Aebli G, Schweiger A, Ernst RR. J. Magn. Reson. 1990;88:241–256. [Google Scholar]
- 34.Van Doorslaer S, Sierra GA, Schweiger A. J. Magn. Reson. 1999;136:152–158. doi: 10.1006/jmre.1998.1609. [DOI] [PubMed] [Google Scholar]
- 35.Stoll S, Schweiger A. J. Magn. Reson. 2006;178:42–55. doi: 10.1016/j.jmr.2005.08.013. [DOI] [PubMed] [Google Scholar]
- 36.Hoogstraten CG, Britt RD. RNA. 2002;8:252–260. doi: 10.1017/s1355838202014826. [DOI] [PMC free article] [PubMed] [Google Scholar]
- 37.Hoogstraten CG, Grant CV, Horton TE, DeRose VJ, Britt RD. J. Am. Chem. Soc. 2002;124:834–842. doi: 10.1021/ja0112238. [DOI] [PubMed] [Google Scholar]
- 38.Mims WB, Peisach J. Biological Magnetic Resonance. Vol. 3. Springer US; Boston, MA: 1981. pp. 213–263. [Google Scholar]
- 39.Dikanov SA, Shubin AA, Parmon VN. J. Magn. Reson. 1981;42:474–487. [Google Scholar]
- 40.Dong G-Y, Liu T-F, He C-H, Deng X-C, Shi X-G. Acta Crystallogr. Sect. E. 2011;67:m960. doi: 10.1107/S1600536811023531. [DOI] [PMC free article] [PubMed] [Google Scholar]
- 41.Niu S-Y, Zhang S-S, Li X-M, Wen Y-H, Jiao K. Acta Crystallogr. Sect. E. 2004;60:m209. [Google Scholar]
- 42.Durot S, Policar C, Cisnetti F, Lambert F, Renault J-P, Pelosi G, Blain G, Korri-Youssoufi H, Mahy J-P. Eur. J. Inorg. Chem. 2005;2005:3513–3523. [Google Scholar]
- 43.Lemoine P, Viossat V, Dayan E, Dung N-H, Viossat B. Inorg. Chim. Acta. 2006;359:4274–4280. [Google Scholar]
- 44.Dev S, Ramli E, Rauchfuss TB, Wilson SR. Inorg. Chem. 1991;30:2514–2519. [Google Scholar]
- 45.Garrett TPJ, Guss JM, Freeman HC. Acta Crystallogr. C. 1983;39:1027–1031. [Google Scholar]
- 46.García-Rubio I, Angerhofer A, Schweiger A. J. Magn. Reson. 2007;184:130–142. doi: 10.1016/j.jmr.2006.09.013. [DOI] [PubMed] [Google Scholar]
- 47.Angerhofer A, Moomaw EW, García-Rubio I, Ozarowski A, Krzystek J, Weber RT, Richards NGJ. J. Phys. Chem. B. 2007;111:5043–5046. doi: 10.1021/jp0715326. [DOI] [PubMed] [Google Scholar]
- 48.Meirovitch E, Luz Z, Kalb AJ. J. Am. Chem. Soc. 1974;96:7542–7546. doi: 10.1021/ja00831a025. [DOI] [PubMed] [Google Scholar]
- 49.Reed GH, Markham GD. Biological Magnetic Resonance. 1984:73–142. [Google Scholar]
- 50.Walsby CJ, Telser J, Rigsby RE, Armstrong RN, Hoffman BM. J. Am. Chem. Soc. 2005;127:8310–8319. doi: 10.1021/ja044094e. [DOI] [PubMed] [Google Scholar]
- 51.Duboc C, Phoeung T, Zein S, Pécaut J, Collomb M-N, Neese F. Inorg. Chem. 2007;46:4905–4916. doi: 10.1021/ic062384l. [DOI] [PubMed] [Google Scholar]
- 52.Duboc C, Collomb M-N, Neese F. Appl. Magn. Reson. 2010;37:229–245. [Google Scholar]
- 53.Un S. Inorg. Chem. 2013;52:3803–3813. doi: 10.1021/ic302415s. [DOI] [PubMed] [Google Scholar]
- 54.Campomanes P, Kellett WF, Easthon LM, Ozarowski A, Allen KN, Angerhofer A, Rothlisberger U, Richards NGJ. J. Am. Chem. Soc. 2014;136:2313–2323. doi: 10.1021/ja408138f. [DOI] [PMC free article] [PubMed] [Google Scholar]
- 55.Espe MP, Hosler JP, Ferguson-Miller S, Babcock GT, McCracken J. Biochemistry. 1995;34:7593–7602. doi: 10.1021/bi00023a005. [DOI] [PubMed] [Google Scholar]
- 56.Bleaney B, Rubins RS. Proc. Phys. Soc. 1961;77:103–112. [Google Scholar]
- 57.Mims WB, Peisach J. J. Chem. Phys. 1978;69:4921–4930. [Google Scholar]
- 58.Zweier J, Aisen P, Peisach J, Mims WB. J. Biol. Chem. 1979;254:3512–3515. [PubMed] [Google Scholar]
- 59.Deligiannakis Y, Louloudi M, Hadjiliadis N. Coord. Chem. Rev. 2000;204:1–112. [Google Scholar]
- 60.Matar K, Goldfarb D. J. Magn. Reson. Ser. A. 1994;111:50–61. [Google Scholar]
- 61.Vogt M, Lahiri S, Hoogstraten CG, Britt RD, DeRose VJ. J. Am. Chem. Soc. 2006;128:16764–16770. doi: 10.1021/ja057035p. [DOI] [PMC free article] [PubMed] [Google Scholar]
- 62.Geue RJ, Hambley TW, Harrowfield JM, Sargeson AM, Snow MR. J. Am. Chem. Soc. 1984;106:5478–5488. [Google Scholar]
- 63.Martin LL, Martin JRL, Murray IKS, Ja AM. S. Inorg. Chem. 1990;29:1387–1394. [Google Scholar]
- 64.Horton TE, Clardy DR, DeRose VJ. Biochemistry. 1998;37:18094–18101. doi: 10.1021/bi981425p. [DOI] [PubMed] [Google Scholar]
- 65.Cohn M, Townsend J. Nature. 1954;173:1090–1091. [Google Scholar]
- 66.Whittaker JW, Whittaker MM. J. Am. Chem. Soc. 1991;113:5528–5540. [Google Scholar]
- 67.Smoukov SK, Telser J, Bernat BA, Rife CL, Armstrong RN, Hoffman BM. J. Am. Chem. Soc. 2002;124:2318–2326. doi: 10.1021/ja012480f. [DOI] [PubMed] [Google Scholar]
- 68.Berliner LJ, Ellis PD, Murakami K. Biochemistry. 1983;22:5061–5063. doi: 10.1021/bi00291a002. [DOI] [PubMed] [Google Scholar]
- 69.Senguen FT, Grabarek Z. Biochemistry. 2012;51:6182–6194. doi: 10.1021/bi300698h. [DOI] [PMC free article] [PubMed] [Google Scholar]
- 70.Moroz OV, Blagova EV, Wilkinson AJ, Wilson KS, Bronstein IB. J. Mol. Biol. 2009;391:536–551. doi: 10.1016/j.jmb.2009.06.004. [DOI] [PubMed] [Google Scholar]
- 71.Koch M, Diez J, Fritz G. J. Mol. Biol. 2008;378:933–942. doi: 10.1016/j.jmb.2008.03.019. [DOI] [PubMed] [Google Scholar]
Associated Data
This section collects any data citations, data availability statements, or supplementary materials included in this article.


