

Abstract
Objectives
Pharmaceutical supply chain is a significant component of the health system in supplying medicines, particularly in countries where main drugs are provided by local pharmaceutical companies. No previous studies exist assessing risks and disruptions in pharmaceutical companies while assessing the pharmaceutical supply chain. Any risks affecting the pharmaceutical companies could disrupt supply medicines and health system efficiency. The goal of this study was the risk assessment in pharmaceutical industry in Iran considering process's priority, hazard and probability of risks.
Methods
The study was carried out in 4 phases; risk identification through literature review, risk identification in Iranian pharmaceutical companies through interview with experts, risk analysis through a questionnaire and consultation with experts using group analytic hierarchy process (AHP) method and rating scale (RS) and risk evaluation of simple additive weighting (SAW) method.
Results
In total, 86 main risks were identified in the pharmaceutical supply chain with perspective of pharmaceutical companies classified in 11 classes. The majority of risks described in this study were related to the financial and economic category. Also financial management was found to be the most important factor for consideration.
Conclusion
Although pharmaceutical industry and supply chain were affected by current political conditions in Iran during the study time, but half of total risks in the pharmaceutical supply chain were found to be internal risks which could be fixed by companies, internally. Likewise, political status and related risks forced companies to focus more on financial and supply management resulting in less attention to quality management.
Keywords: Pharmaceutical supply chain, Risk assessment, analytic hierarchy process (AHP) method, Simple additive weighting (SAW) method, Iran pharmaceutical industry
Introduction
Medicines Supply is one of the major priorities in developing countries. Therefore efficient pharmaceutical supply chain management is of high importance [1,2]. The efficient pharmaceutical supply chain supplies medicines in the right quantity, and to the customers with the acceptable quality, at the proper time and with optimum price to produce benefits for all the stakeholders [2,3]. The pharmaceutical supply chain is a significant component of the health scheme which includes all procedures, information, resources and players such as suppliers, manufacturers, intermediaries, third-party service providers, logistics activities, merchandising and sales activities, finance and information technology [2,4]. Pharmaceutical companies play an important role in supplying medicines, particularly in countries where the volume is supplied by local companies [5]. Pharmaceutical companies in Iran are important players in the supply chain as more than 95% of drug market in Iran (in terms of volume) is supplied by local manufacturers [6]. In this context, any risks affecting the pharmaceutical companies could disrupt the supply of medicines and affect the health system efficiency [7,8].
Local pharmaceutical companies face several risks and vulnerabilities due to nature of Pharmaceutical industry and its complex processes in one hand and political condition of Iran in the other hand [2,6,9,10]. In addition, medicine is a highly regulated good and under the controls and restrictions of public regulatory authorities [2,11,12]. To overcome supply chain vulnerabilities, it is essential to identify and prioritize obstacles to create best practice for proper configuration and adaptability in pharmaceutical industry [13,14].
Supply chain risk management can help organizations to monitor the expecting hazards and control possible risks and thus improve efficiency of the supply chain [15]. This approach can help to improve and build up business processes, prevent potential problems, minimize loss of commercial enterprise, reduce costs and liability, protect the supply chain and avoid waste [16,17].
Referring to International Conference on Harmonization (ICH) Q9 definition; risk assessment is defined as “A systematic process of organizing information to support a risky decision to be made within a risk management process. It consists of the identification of hazards and the analysis and evaluation of risks associated with exposure to those hazards.”
The risk identification stage represents an important initiating point in the overall risk management process and forms the basis for the next stages [18]. Potential hazards which are outputs from the risk identification stage will be subject to detailed scrutiny during the hazard analysis and evaluation stages [19,20]. At the following step as risk analysis, level of risk in terms of severity of hazard, the likelihood of occurrence and detection should be estimated that provides a quantitative idea of each risk. And at the last step of risk assessment, output of risk analysis should be organized (filtered, ranked and etc.) and most significant risks should be highlighted and identified for risk management strategies [21-23].
There are several reports which report risks in the pharmaceutical supply chain and some of them attempted to quantify or measure them [2,6,16,24]. Supply and supplier issue, fragmentation, delivery reliability, information flow, quality management system, inventory management, customer service disruption, research and development, skill of workers, planning, organization and processes, company strategies, production cost and waste management, fiscal management, currency rate, logistic, demand, regulations are some topics which were described in previous studies as source of risks for pharmaceutical companies. The objectives of this study were to identify and categorize pharmaceutical supply chain risks with perspective of local companies. In addition, main risks of supply chain functions in local companies were measured considering priority of functions, hazard and probability of risks in pharmaceutical supply chain.
Methods
This study was carried out in four phases; risk identification through literature review (carried out on September 2012), risk identification in Iranian pharmaceutical companies through interview with experts, risk analysis through questionnaire, risk evaluation (carried out from November 2012 till December 2013).
Phase 1: A literature review to identify pharmaceutical supply chain risks; a systematic review via scientific search engines, Scopus, PubMed, Web of Science and Google scholar, was done for risk identification by several keywords; Supply chain management, risk, risk management, risk assessment, pharmaceutical, pharmaceutical industry, Iran. Also investigating in each data base was done based on data base characteristics and Medical Subject Headings (MeSH) was noted when searching via PubMed.
In addition, categorization of pharmaceutical supply chain processes and functions was investigated in the literatures, in this phase.
All studies were screened through 4 steps:
Reviewing reports and non-relevant articles were excluded considering outcome of interests and scope of the study;
Excluding duplicated articles;
Excluding non-relevant articles, based on abstract review
Finally, full texts of all remained studies were investigated and some of articles were excluded by outcome of interest.
This study focused on pharmaceutical supply chain risk management with perspective of the production manufacturers so, studies with consumer safety, environmental risk management, health policy and third parties’ subject were eliminated.
Phase 2: Risk identification in Iran pharmaceutical companies through expert opinion with an open questionnaire; for identifying pharmaceutical supply chain risks in Iran, investigation risks through expert opinion was carried out. In this step, a group of 16 experts who had at least 5 years experience in pharmaceutical industry management was selected to interview for risk identification. It is trying to select experts from different kind of companies and organizations with different ownerships and field of work to cover all points of view in the Iran’s pharmaceutical industry.
Before each interview, an introductory letter and open questionnaire, which was validated in the pilot study, were sent to experts. 1–2.5 hour interview with each expert was carried out and the questions related to risks and best practice for categorization of pharmaceutical supply chain processes and functions were asked. After coding and extracting risks from questionnaires, a summary of interview and identified risks were sent to interviewees for review and final confirmation.
Phase 3: Risk analysis through a questionnaire and interview with experts; all risks extracted from literature review and expert interview (phase 1 and 2) collected in a questionnaire for risk analysis. The questionnaire was designed in two parts with two tables; first part included a table for pair wise comparison to prioritize supply chain functions based on group AHP method and the second part included a table for scoring hazard of risks on supply chain functions and probability of risks in Iran pharmaceutical industry simultaneously by 0–10 rating scale.
A questionnaire was validated by 3 experts in the pilot study before sending a questionnaire to the experts. After sending questionnaires to the experts, an interview meeting was set with each expert to fill questionnaire in the face to face interview meeting. Except one, all questionnaires were responded by the expert team.
Phase 4: Risk evaluation; risk evaluation was based on considering three factors; probability of risks, hazards of risks on each function in supply chain and priority of managing supply chain functions. AHP group decision making method was selected for prioritizing functions in the supply chain and rating scale was selected for scoring hazard of risks on functions of the supply chain and probability of risks in Iran pharmaceutical industry. After gathering the data, simple additive weighting (SAW) method was applied for evaluation. Figure 1 shows a risk assessment process which is applied in this study.
Figure 1.
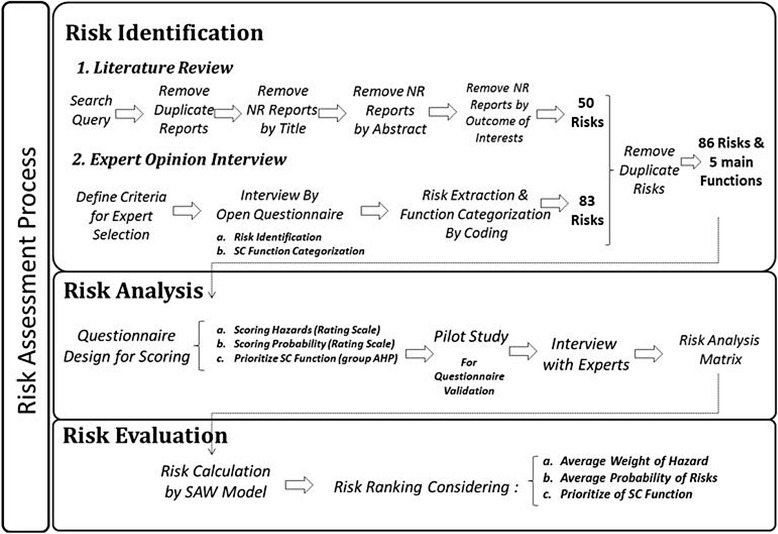
Risk assessment process.
Rating scale: A rating scale is widely used in studies by applying questionnaires to elicit information about a quantitative or a qualitative attribute. In this method, a person selects the number which is considered to reflect the intensity to an item [25].
AHP group decision making: AHP is a type of multi attribute decision making (MADM) introduced by Thomas L Saaty (1971) which helps in complex decision making involving multiple scenarios, criteria and actors [26]. AHP is selected because it allows decision-makers to model a complex problem in a hierarchical structure with considering goals and criteria [27]. In AHP, pairwise comparisons are used to determine preferences between criteria or alternatives [28] (Table 1).
Table 1.
The AHP Pair-wise comparison values or scale of preference between two elements
| Preference weights or level of importance (value of a ij ) | Definition of verbal scale | Explanation |
|---|---|---|
| aij = 1 | If the two criteria are equally preferred | Two activities or criteria contribute equally to the objective or goal |
| aij = 3 | If criteria i is moderately preferred than criteria j | Experience and judgment slightly favor criteria over another |
| aij = 5 | If criteria i is strongly preferred than criteria j | Experience and judgment strongly favor one criteria over another |
| aij = 7 | If criteria i is very strongly preferred than criteria j | An criteria is strongly favored over another and its importance demonstrated in practice |
| aij = 9 | If criteria i is absolutely preferred than criteria j | The evidence favoring one criteria over another is of the highest degree possible of affirmation |
| 2,4,6,8 | Intermediate values | Use to compromise between two judgments |
In this study group, decision AHP is applied in which comparative judgment of all decision makers gathered and aggregated. So, using aggregation functions in group AHP method makes it more applicable than AHP [29]. Four basic steps are needed to apply the AHP method; hierarchy construction, individual comparative judgments (pairwise comparison), aggregation of judgment by the geometric average between each judgment of decision makers, and then synthesizing the results [30].
Typically, hierarchy is structured from the top (goal) to the end (criteria or alternative) which the goal is finding the most appropriate criteria or alternative among others based on the weight of each criteria or alternative. In fact the group AHP method based on the pairwise comparison tries to find differences between criteria or alternatives and obtain the weight of each objective. The goal of this research was to evaluate and prioritize management of supply chain functions from a pharmaceutical production company perspective. Below steps are defined based on the group AHP approach, to prioritize pharmaceutical supply chain functions:
Hierarchy construction: hierarchy structure of supply chain functions which categorized into 5 group ups by experts was drawn (Figure 2).
Comparative judgments (pairwise comparison): after developing the structure, pairwise comparisons were done by experts through questionnaires to determine the relative importance of the function management in the pharmaceutical supply chain.
Aggregation of comparative judgment: using geometric average
Synthesize the results to find the overall score of each function [31]
Figure 2.

Hierarchy structure of pharmaceutical supply chain risks.
Simple additive weighting (SAW) method: SAW is a simple and most applicable multi-attribute decision method which is known as a weighted linear combination or scoring technique. This method is based on the weighted average and an evaluation score is measured by multiplying the normalized value of each criteria for the objectives with the importance of the criteria. Then the objectives could be ranked and objective with the highest score is selected as the preferred one [32].
Based on SAW technique, final score of each risk is calculated and ranked as follow [33]:
Where
Si is total score of the ith objective;
rijis the normalized rating of the ith objective for the jth criterion,
wi is the importance (weight) of the ith criterion;
N is the number of objectives;
M is the number of criterion;
Based on this method, final risk scores were calculated considering the average probability of risks, the average hazard of risks on each function and priority of supply chain functions.
Expert choice version 11 was applied for AHP analysis and Microsoft Excel was applied to calculations based on SAW method.
Results
Outcome of interest
Supply chain risk identification and assessment from pharmaceutical production company’ perspective was defined as the outcome of interest in this study. So, consumer safety, environmental, health policy and third party perspective were not considered.
Phase 1: based on the systematic review on risk identification which was done, after reviewing abstracts, none-relevant studies were excluded. Finally, 28 studies from Google scholar, 10 studies from Web of Science, 44 studies from Scopus and 12 studies from PubMed were evaluated. Full 94 studies were reviewed and 85 out of 94 were eliminated by outcomes of interest. At the end, 9 articles included in the analysis for risk extraction.
Out of these 9 studies, 50 “risks” were identified from the literature from the literature which categorized into 7 main categories; categories were systematic review; supply and supplier issues, organization and strategy issues, financial, logistical, political, market and regulatory issues. Most mentioned items in articles which reported as risk were related to supply and suppliers [33] (Table 2).
Table 2.
Risks identified through systematic review with their frequency of reporting
| Category | Risks | No. | Category | Risks | No. | Category | Risks | No. |
|---|---|---|---|---|---|---|---|---|
| Supply & suppliers issues | Supply and supplier issue | 6 | Supply & suppliers issues | Flexibility in product variety | 1 | Financial issues | Tax payable change | 3 |
| Partnership with supplier | 3 | Timely delivery | 1 | Currency rate | 3 | |||
| Raw material quality | 2 | Quality management system | 1 | Financial risks | 3 | |||
| Ordering cycle time | 2 | Organization & strategies issues | Customer services disruption | 1 | Tariff policies changes | 1 | ||
| Contract & agreements | 2 | Inventory management | 4 | Costs related to supply | 1 | |||
| Customization of supplier | 2 | Operation issues | 3 | Cash Flow | 1 | |||
| Certificate of good manufacturing practices (GMP) | 2 | R & D | 2 | Interest rate | 1 | |||
| Flexibility of supplier | 2 | Skill of workers | 2 | Market issues | Market | 2 | ||
| Fragmentation | 1 | Strategy | 2 | Consumers taste | 2 | |||
| Delivery reliability | 1 | Planning issues | 2 | Demand | 2 | |||
| Environmental assessment | 1 | Information flow | 1 | Political issues | Natural disasters & Terrorism | 3 | ||
| Technology level | 1 | Visibility on stock | 1 | Political issues | 1 | |||
| Information systems | 1 | Organization & process | 2 | Sanction | 1 | |||
| Good will | 1 | Mergers and acquisition | 1 | logistic issues | Counterfeit | 4 | ||
| Technology development | 1 | Time to market | 1 | Transportation | 3 | |||
| Flexibility in delivering | 1 | waste management | 1 | Regulation | Regulation | 6 | ||
| Flexible quantities | 1 | Production cost | 1 |
Phase 2: Totally 442 items as pharmaceutical supply chain risk were mentioned in interviews by experts. After coding and rewording items, 83 items were extracted and considered as “risks” in the pharmaceutical supply chain from production manufacturers perspective. Forty seven out of 83 mentioned risks were reported in the literatures in phase 1. And 36 items out of 83 were new items. After syncing risks from literature and interviews, a list of 86 risks which categorized in 11 groups were identified. Categorization of risks was based on expert opinions which include financial and economic, politics and government, regulatory, company strategies, research and development, supply and suppliers, market and competitors, operation and processes, logistic, human resource, and disaster and accidents.
Also, based on the expert’s opinion, supply chain functions in pharmaceuticals were categorized into five groups; financial management, supply management, operation management, sales and quality management.
Phase 3: Risk assessment was done by considering 3 factors in second questionnaire. These three factors were priority of supply chain functions, probability of risks and hazard of risks on each function.
The pair wise comparison of the supply chain functions shown in Table 3 as well as in Figure 3 indicated that financial management is the most important function to be managed with a priority of 0.380 followed by supply management (0.253), sales management (0.214), operation management (0.092) and quality management (0.062). Overall inconsistency was in the acceptable range (0.02) (Figure 3).
Table 3.
All supply chain risks and ranks
| Rank | Risk | Probability(%) | Weight | Rank | Risk | Probability(%) | Weight |
|---|---|---|---|---|---|---|---|
| 1 | Sanctions | 63.93 | 0.8543 | 11 | Operational cost | 53.57 | 0.5819 |
| 2 | Money transfer | 71.07 | 0.8036 | 12 | Ordering cycle time | 48.85 | 0.5732 |
| 3 | Interest rate | 60.36 | 0.7482 | 13 | Material cost | 45.36 | 0.5639 |
| 4 | Currency fluctuation | 62.50 | 0.7401 | 14 | MOH policy fluctuation | 57.86 | 0.5368 |
| 5 | Cash flow | 51.79 | 0.7158 | 15 | Money collection | 44.29 | 0.5154 |
| 6 | Unstable policies | 63.57 | 0.6766 | 16 | Banking regulation | 46.43 | 0.5142 |
| 7 | Pricing policies | 58.93 | 0.6616 | 17 | Suppliers conditions | 43.46 | 0.4841 |
| 8 | Inflation rate | 56.07 | 0.6411 | 18 | Managerial knowledge | 38.85 | 0.4812 |
| 9 | Information flow | 48.57 | 0.6190 | 19 | Strategies | 36.79 | 0.4703 |
| 10 | Regulation transparency | 56.43 | 0.6074 | 20 | Economic stagnation | 48.86 | 0.4670 |
Figure 3.

Major decision objectives priorities.
Average of probability and hazard of risks of supply chain factors which scored by experts through rating scale, were measured. Then, based on SAW method, the weight of each risk considering the priority of supply chain functions (priorities were measured by AHP method), probability of risks and hazard of risks on each function (which obtained from expert opinion through rating scale) was calculated. Table 4 shows a list of risks with their rank, probability and weight.
Table 4.
Top 20 risks of financial management function
| Rank | Risks | Weight | Rank | Risks | Weight |
|---|---|---|---|---|---|
| 1 | Interest rate | 1.0000 | 11 | Operational cost | 0.6728 |
| 2 | Currency fluctuation | 0.9019 | 12 | Material cost | 0.6000 |
| 3 | Money transfer | 0.8641 | 13 | Regulation transparency | 0.5881 |
| 4 | Sanctions | 0.8627 | 14 | Ordering cycle time | 0.5417 |
| 5 | Cash flow | 0.8372 | 15 | Economic stagnation | 0.5222 |
| 6 | Inflation rate | 0.7665 | 16 | Information flow | 0.4867 |
| 7 | Pricing policies | 0.7008 | 17 | Suppliers conditions | 0.4820 |
| 8 | Unstable policies | 0.6880 | 18 | Return of investment | 0.4810 |
| 9 | Banking regulation | 0.6762 | 19 | Managerial knowledge | 0.4568 |
| 10 | Money collection | 0.6746 | 20 | Biased interpretation of regulations | 0.4279 |
The results showed that the average probability of risks in the pharmaceutical supply chain in Iran is 35.05% and major risks are related to the financial and economical category with a weight of 0.5542, and followed politics and government (0.5171), regulatory (0.3911), strategies (0.3723), research and development (0.3247), supply and suppliers (0.2907), market and competitors (0.2868), operation and process (0.2765), logistic (0.2728), human resource (0.2462) and disaster and accidents (0.0896).51 out of 86 risks are external with an average probability of 36.59% and average weight of 0.3607 and probabilities of internal risk is 32.81% with average weight of 0.3397.
Considering probability and hazard of each risk and normalizing numbers, high important risks in each function of supply chain in pharmaceutical companies were measured as below:
Interest rate [1], currency fluctuation (0.9018), money transfer (0.8641), sanctions (0.8627), cash flow (0.8372), inflation rate (0.7664), pricing policies (0.7007), unstable policies (0.6880), banking regulation (0.6761) and money collection (0.6745) are top ten risks which have more impact on financial management function in Iran pharmaceutical supply chain. Table 5 shows top 20 risks with high impact on financial management function.
Table 5.
Top 20 risks of supply management function
| Rank | Risks | Weight | Rank | Risks | Weight |
|---|---|---|---|---|---|
| 1 | Money transfer | 1.0000 | 11 | Information flow | 0.5289 |
| 2 | Sanctions | 0.8682 | 12 | Inflation rate | 0.5246 |
| 3 | Currency fluctuation | 0.7035 | 13 | Commercial regulation | 0.5170 |
| 4 | Cash flow | 0.6399 | 14 | Limited suppliers | 0.5125 |
| 5 | Ordering cycle time | 0.6275 | 15 | MOH policy fluctuation | 0.4743 |
| 6 | Unstable policies | 0.6145 | 16 | Banking regulation | 0.4601 |
| 7 | Interest rate | 0.6129 | 17 | Biased interpretation of regulations | 0.4317 |
| 8 | Regulation transparency | 0.5799 | 18 | Customs regulations | 0.4237 |
| 9 | Material cost | 0.5660 | 19 | Supplier commitments | 0.4047 |
| 10 | Suppliers conditions | 0.5371 | 20 | Medicine regulations | 0.4011 |
Money transfer (1), sanctions (0.8682), currency fluctuation (0.7035), cash flow (0.6399), ordering cycle time (0.6275), unstable policies (0.6144), interest rates (0.6129), regulatory transparency (0.5799), operational cost (0.5660) and suppliers’ conditions (0.5370) are top ten risks which have more impact on supply management function in Iran pharmaceutical supply chain. Table 6 shows top 20 risks with high effect on supply management function.
Table 6.
Top 20 risks of sales management function
| Rank | Risks | Weight | Rank | Risks | Weight |
|---|---|---|---|---|---|
| 1 | Pricing policies | 1.0000 | 11 | Operational cost | 0.6636 |
| 2 | Lobbing | 0.8199 | 12 | Currency fluctuation | 0.6576 |
| 3 | Inflation rate | 0.7993 | 13 | Cash flow | 0.6503 |
| 4 | Distribution & coverage | 0.7883 | 14 | New competitors (new medicine or new company) | 0.6485 |
| 5 | Unstable policies | 0.7767 | 15 | Interest rate | 0.6350 |
| 6 | Sanctions | 0.7485 | 16 | Time to market | 0.6240 |
| 7 | MOH policy fluctuation | 0.7167 | 17 | Managerial knowledge | 0.6197 |
| 8 | Information flow | 0.6924 | 18 | Strategies | 0.6180 |
| 9 | Regulation transparency | 0.6895 | 19 | Competition | 0.6177 |
| 10 | Product selection | 0.6733 | 20 | Demand forecasting | 0.5939 |
Pricing policies (1), lobbying (0.8199), inflation rate (0.7992), distribution & coverage (0.7883), unstable policies (0.7767), sanctions (0.7485), (Ministry of Health) MOH policy fluctuation (0.7167), information flow (0.6924), regulatory transparency, (0.6895) and product selection (0.6733) are top ten risks which have more impact on sales management in Iran pharmaceutical supply chain. Table 7 shows top 20 risks with high effect on sales management function.
Table 7.
Top 20 risks of operation management function
| Rank | Risks | Weight | Rank | Risks | Weight |
|---|---|---|---|---|---|
| 1 | Sanctions | 1.0000 | 11 | Regulation transparency | 0.6388 |
| 2 | Information flow | 0.9097 | 12 | Motivation | 0.6357 |
| 3 | Money transfer | 0.8192 | 13 | Planning & ordering | 0.6355 |
| 4 | Operation standers | 0.7574 | 14 | Currency fluctuation | 0.6303 |
| 5 | Cash flow | 0.7354 | 15 | Medicine regulations | 0.6252 |
| 6 | Inappropriate production process and technology | 0.6888 | 16 | Location | 0.6111 |
| 7 | Unstable policies | 0.6804 | 17 | Raw material quality | 0.5972 |
| 8 | Ordering cycle time | 0.6635 | 18 | Human errors | 0.5948 |
| 9 | Operational cost | 0.6616 | 19 | Strategies | 0.5906 |
| 10 | MOH policy fluctuation | 0.6430 | 20 | Material cost | 0.5881 |
Sanctions (1), information flow (0.9097), money transfer (0.8191), operation standers (0.7574), cash flow (0.7354), inappropriate production process and technology (0.6887), unstable policies (0.6803), ordering cycle time (0.6635), operational cost (0.6615) and MOH policy fluctuation (0.6430) are top ten risks which have an impact on operations management function in Iran pharmaceutical supply chain. Table 8 shows top 20 risks with high effect on operations management function.
Table 8.
Top 20 risks of quality management function
| Rank | Risks | Weight | Rank | Risks | Weight |
|---|---|---|---|---|---|
| 1 | Operation standers | 1.0000 | 11 | Human errors | 0.7650 |
| 2 | Raw material quality | 0.9302 | 12 | knowledge of regulatory people | 0.7397 |
| 3 | Information flow | 0.9141 | 13 | Motivation | 0.7107 |
| 4 | Inappropriate production process and technology | 0.8248 | 14 | Good storage practices (GSP) | 0.7022 |
| 5 | Sanctions | 0.8081 | 15 | Pricing policies | 0.6952 |
| 6 | Location | 0.8070 | 16 | Supplier quality specifications | 0.6638 |
| 7 | In Process quality | 0.7897 | 17 | Formulation | 0.6606 |
| 8 | MOH policy fluctuation | 0.7801 | 18 | Business awareness of regulators | 0.6156 |
| 9 | Skilled workers | 0.7753 | 19 | Strategies | 0.5890 |
| 10 | Medicine regulations | 0.7720 | 20 | Biased interpretation of regulations | 0.5490 |
Operation standers (1), raw material quality (0.9302), information flow (0.9141) inappropriate production process and technology (0.8247), sanctions (0.8080), location (0.8070), in process quality (0.7897), MOH policy fluctuation (0.7800) and skilled workers (0.7752) are top ten risks which were found to have an impact on quality management function in Iran pharmaceutical supply chain. Table 9 shows top 20 risks with high effect on quality management function.
Table 9.
Risks probability-hazard chart
| High Probability | Low Probability | |
|---|---|---|
| High hazard | Sanction | Civil war |
| Cash flow | In process contamination | |
| Information flow | Natural disasters | |
| Ordering cycle time | Accidents | |
| Counterfeit | ||
| Low hazard | Biased interpretation of regulations | Human resource turnover |
| Government dependency | Supplier agent | |
| Lobbing | Vacations | |
| Mergers and acquisition |
For more focus on probability and hazard, the risk map was developed to show the location of each risk based on its probability and hazard. This map was divided into 16 areas based on 4 divisions on each axis. The risks that are located in 4 extreme areas on the corner of the map have been reported in the table 10 as risks Probability-Hazard chart.
High Probability/High Hazard: sanction, cash flow, information flow and ordering cycle time are top priorities to manage and should be highly considered.
High Probability/Low Hazard: biased interpretation of regulations, government dependency and lobbing are external risks which are not really in control of pharmaceutical companies.
Low Probability/High Hazard: civil war, in process contamination, natural disasters, accidents and counterfeit are high impact on supply chain function if it does happen. So building infrastructures to prevent and minimizing hazards are highly noticeable issue.
Low Probability/Low Hazard: human resource turnover, supplier agent, vacations and mergers and acquisition are considered low priority risks for pharmaceutical supply chain management.
Discussion
The top risks were t financial and economic parameters, politics and then the government. The result of this study shows pharmaceutical industry and supply chain were affected by political condition of Iran, in the study period. In addition, based on expert opinions, financial function is the first priority to manage in the pharmaceutical industry with a priority of 0.380 and this result is inline with the top rank risks identified.
Political status and related risks forcing companies to focus on financial and supply management so quality issues are the last priority to manage. It could contribute to compromising quality which is one of the primary objectives of supply chain management and national drug policy in Iran.
Fifty one out of 86 risk items were external and after ranking it was also observed that top 20 risks were also external. But average weight and probability of internal and external risks have no significant differences statistically. It stands for that half of the total risks in the pharmaceutical supply chain in Iran are internal risks which could be mitigated by companies, internally.
It is interesting to note that this work carried out when Iran was facing rigorous international sanctions. Since the method of risk identification and hazard assessment were based on expert judgment; hence political issues and related risks may get a higher grade than others especially in the case of normal conditions. Also challenges which each expert had faced at the time of field could affect on highlighting or dismissing some items during questionnaire responding.
Considering most important risks affecting on each function, companies could draw mitigation plan to minimize top rank risks based on company’s strategies.
The result shows, top rank risks with high effect on financial management and supply management are closely similar to top rank risks in the pharmaceutical supply chain. But ranking in operation management and quality management are different. These results confirm the result of AHP method that showed financial and supply management are extremely challenging. Operation standers, processes and human resource issues becoming in top rank risks with high effect on quality management and operation management which most of them are internal risks that could be managed inter company. And operation and quality management are affecting internal risk more than external ones and could be easier to manage.
Conclusions
After financial and supply risks which most of them are external issues, the top risk identified in pharmaceutical supply chain include regulation issues. As one of the most significant goals of MOH is to support supply of medicine, also not addressing those risks could potentially harm supply chain. Then efficient relationship between MOH and the pharmaceutical industry could help both MOH and industry to review and mitigate regulatory risks.
Footnotes
Competing interests
The authors declare that they have no competing interests.
Authors' contribution
MJ carried out the study and drafted the manuscript. LO assisted in the design of the project and drafting the interview forms. AH assisted in drafting the forms. AK assisted in the design of the project and selection of the interviewee people. M Abdollahi assisted in drafting and reviewing the manuscript. M Alaeddini assisted in the design of the study and statistical analysis of the results. RD supervised the whole project. All authors read and approved the final manuscript.
Contributor Information
Mona Jaberidoost, Email: jaberi.mona@gmail.com.
Laya Olfat, Email: olfat@atu.ac.ir.
Alireza Hosseini, Email: hosseini.reza7@gmail.com.
Abbas Kebriaeezadeh, Email: kebriaee@tums.ac.ir.
Mohammad Abdollahi, Email: mohammad.abdollahi@utoronto.ca.
Mahdi Alaeddini, Email: mahdi.ala@gmail.com.
Rassoul Dinarvand, Email: dinarvand@tums.ac.ir.
References
- 1.Hogerzeil HV. Essential medicines and human rights: what can they learn from each other? B World Health Organ. 2006;84(5):371–375. doi: 10.2471/BLT.06.031153. [DOI] [PMC free article] [PubMed] [Google Scholar]
- 2.Jaberidoost M, Nikfar S, Abdollahiasl A, Dinarvand R. Pharmaceutical supply chain risks: a systematic review. Daru. 2013;21(1):69. doi: 10.1186/2008-2231-21-69. [DOI] [PMC free article] [PubMed] [Google Scholar]
- 3.Kaufmann L, Thiel C and Becker A. Supply chain management in the Mexican pharmaceutical industry. Paper presented at 16th annual North American research/teaching symposium on purchasing and supply chain management. Conference Year Conference.
- 4.Shah N. Process industry supply chains: advances and challenges. Comput Chem Eng. 2005;29(6):1225–1235. doi: 10.1016/j.compchemeng.2005.02.023. [DOI] [Google Scholar]
- 5.Henry D, Lexchin J. The pharmaceutical industry as a medicines provider. Lancet. 2002;360(9345):1590–1595. doi: 10.1016/S0140-6736(02)11527-3. [DOI] [PubMed] [Google Scholar]
- 6.Mehralian G, Gatari AR, Morakabati M, et al. Developing a suitable model for supplier selection based on supply chain risks: an empirical study from Iranian pharmaceutical companies. Iran J Pharm Res. 2012;11(1):209–219. [PMC free article] [PubMed] [Google Scholar]
- 7.Craighead CW, Blackhurst J, Rungtusanatham MJ, et al. The severity of supply chain disruptions: design characteristics and mitigation capabilities. Decision Sci. 2007;38(1):131–156. doi: 10.1111/j.1540-5915.2007.00151.x. [DOI] [Google Scholar]
- 8.Dinarvand R. New national drug policy in Iran leading to expanded pharmaceutical market and extended access of public to medicines. Iranian J Public Health. 2009; 38(Suppl. 1).
- 9.Enyinda CI, Mbah CH, Ogbuehi A. An empirical analysis of risk mitigation in the pharmaceutical industry supply chain: a developing country perspective. Thunderbird International Business Review. 2010;52(1):45–54. doi: 10.1002/tie.20309. [DOI] [Google Scholar]
- 10.Shah N. Pharmaceutical supply chains: key issues and strategies for optimisation. Comput Chem Eng. 2004;28(6–7):929–941. doi: 10.1016/j.compchemeng.2003.09.022. [DOI] [Google Scholar]
- 11.Farshchi A, Jaberidoost M, Abdollahiasl A et al. Efficacies of regulatory policies to control massive use of diphenoxylate. Int J Pharmacol. 2012; 8(5).
- 12.Dinarvand R. A new pharmaceutical environment in iran: Marketing impacts. Iran J Pharm Res. 2010: 1–2.
- 13.Naraharisetti P, Karimi I. Supply chain redesign and new process introduction in multipurpose plants. Chem Eng Sci. 2010;65(8):2596–2607. doi: 10.1016/j.ces.2009.12.036. [DOI] [Google Scholar]
- 14.Jaberidoost M, Abdollahiasl A, Farshchi A, et al. Risk management in Iranian pharmaceutical companies to ensure accessibility and quality of medicines. Value Health. 2012;15(7):A616–A617. doi: 10.1016/j.jval.2012.08.092. [DOI] [Google Scholar]
- 15.Jüttner U, Christopher M, Baker S. Demand chain management-integrating marketing and supply chain management. Ind Market Manag. 2007;36(3):377–392. doi: 10.1016/j.indmarman.2005.10.003. [DOI] [Google Scholar]
- 16.Breen L. A preliminary examination of risk in the pharmaceutical supply chain (psc) in the national health service (nhs), uk. J Serv Sci Manag. 2008;1(2):6. [Google Scholar]
- 17.Vanany I, Zailani S, Pujawan N. Supply chain risk management: literature review and future research. Int J Inform Syst Suppl Chain Manag. 2009;2(1):16–33. doi: 10.4018/jisscm.2009010102. [DOI] [Google Scholar]
- 18.Al-Bahar JF, Crandall KC. Systematic risk management approach for construction projects. J Constr Eng Manag. 1990;116(3):533–546. doi: 10.1061/(ASCE)0733-9364(1990)116:3(533). [DOI] [Google Scholar]
- 19.Kleindorfer PR, Saad GH. Managing disruption risks in supply chains. Prod Oper Manag. 2005;14(1):53–68. doi: 10.1111/j.1937-5956.2005.tb00009.x. [DOI] [Google Scholar]
- 20.Jüttner U. Supply chain risk management: understanding the business requirements from a practitioner perspective. Int J Logistics Manag. 2005;16(1):120–141. doi: 10.1108/09574090510617385. [DOI] [Google Scholar]
- 21.FDA U. Guidance for industry. Q9 Quality Risk Management. Rockville, MD. 2006.
- 22.Norrman A and Lindroth R. Categorization of supply chain risk and risk management. Suppl Chain Risk. 2004: 14–27.
- 23.Zsidisin GA, Ellram LM, Carter JR, et al. An analysis of supply risk assessment techniques. Int J Phys Distr Log. 2004;34(5):397–413. doi: 10.1108/09600030410545445. [DOI] [Google Scholar]
- 24.Enyinda CI, Mbah CHN, Ogbuehi A. An empirical analysis of risk mitigation in the pharmaceutical industry supply chain: a developing-country perspective. Thunderbird International Business Review. 2010;52(1):45–54. doi: 10.1002/tie.20309. [DOI] [Google Scholar]
- 25.Andrich D. Application of a psychometric rating model to ordered categories which are scored with successive integers. Appl Psychol Meas. 1978;2(4):581–594. doi: 10.1177/014662167800200413. [DOI] [Google Scholar]
- 26.Saaty TL. The analytic hierarchy process. Springer; 1989:59–67.
- 27.Saaty TL. Analytic hierarchy process. Encyclopedia of Operations Research and Management Science. 2001: 19–28
- 28.Saaty TL. How to make a decision: the analytic hierarchy process. Eur J Oper Res. 1990;48(1):9–26. doi: 10.1016/0377-2217(90)90057-I. [DOI] [PubMed] [Google Scholar]
- 29.Altuzarra A, Moreno-Jiménez JM, Salvador M. Consensus building in ahp-group decision making: a Bayesian approach. Oper Res. 2010;58(6):1755–1773. doi: 10.1287/opre.1100.0856. [DOI] [Google Scholar]
- 30.Chen C-F. Applying the analytical hierarchy process (ahp) approach to convention site selection. J Travel Res. 2006;45(2):167–174. doi: 10.1177/0047287506291593. [DOI] [Google Scholar]
- 31.Escobar MT, Moreno-jiménez JM. Aggregation of individual preference structures in ahp-group decision making. Group Decis Negot. 2007;16(4):287–301. doi: 10.1007/s10726-006-9050-x. [DOI] [Google Scholar]
- 32.Memariania A, Aminib A, Alinezhadc A. Sensitivity analysis of simple additive weighting method (saw): The results of change in the weight of one attribute on the final ranking of alternatives. J Ind Eng. 2009;4:13–18. [Google Scholar]
- 33.Yoon KP and Hwang C-L. Multiple attribute decision making: An introduction. Sage; 1995.