Abstract
Digital droplet PCR (ddPCR) is an assay that combines state-of-the-art microfluidics technology with TaqMan-based PCR to achieve precise target DNA quantification at high levels of sensitivity and specificity. Because quantification is achieved without the need for standard assays in an easy to interpret, unambiguous digital readout, ddPCR is far simpler, faster, and less error prone than real-time qPCR. The basic protocol can be modified with minor adjustments to suit a wide range of applications, such as CNV analysis, rare variant detection, SNP genotyping, and transcript quantification. This unit describes the ddPCR workflow in detail for the Bio-Rad QX100 system, but the theory and data interpretation are generalizable to any ddPCR system.
Keywords: ddPCR, TaqMan, CNV, genotyping, rare variant detection, transcript quantification, copy number variant
INTRODUCTION
Digital droplet polymerase chain reaction (ddPCR) is a robust and powerful method for detecting and quantifying nucleic acids with exceptionally high sensitivity and specificity. ddPCR is rapidly gaining in popularity over standard real-time PCR assays for its relative ease of use, precise and accurate results, and ability to quantify nucleic acid concentration without the need for standard samples (Hindson et al., 2011). Learning to perform ddPCR is simple and straightforward, and the technique can be mastered in a matter of days. ddPCR can be adapted for a wide variety of applications, such as copy number variant analysis, rare variant detection, gene expression analysis, and SNP genotyping, with few adjustments to the same basic protocol.
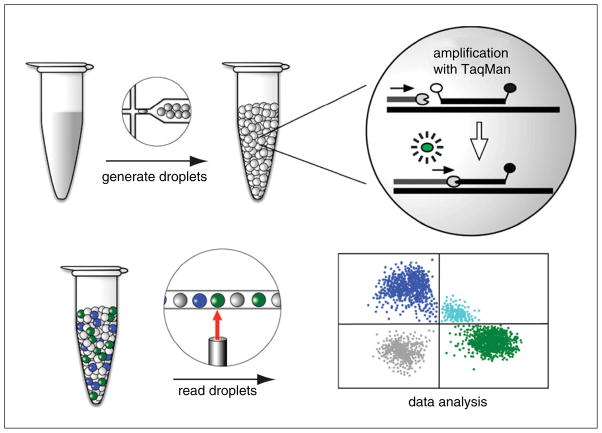
The ddPCR workflow begins like any other PCR assay (Fig. 7.24.1). DNA template material, either from a genomic or cDNA preparation, is combined with buffer, dNTPs, primers, and DNA polymerase. In addition, ddPCR makes use of fluorescently labeled internal hybridization probes (TaqMan probes) for detection of the amplification product (UNIT 2.10). The reaction is normally set up as a duplex PCR where one primer/probe pair is targeted for the region of interest (ROI) and a second primer/probe pair is targeted for any standard reference (REF) gene. The two probes are labeled with different fluorophores (usually FAM and VIC) and fluorescence is detected only when the corresponding amplification product is present (for a reference on TaqMan assays, please see UNIT 2.10). The next steps are what make ddPCR unique. Using microfluidic technology, the reaction mix is partitioned into thousands of tiny spherical droplets composed of an oil surface and an aqueous core containing the PCR reaction mix. Instead of one 20 μl reaction, there are now 20,000 reactions of ~1 nl each. The reaction is designed such that all of the droplets will contain the standard materials (enzyme, primers, probes) but there will be a random distribution of droplets containing the ROI and/or REF targets such that droplets will contain 0, 1, 2, or more copies of each target.
Figure 7.24.1.
Overview of digital droplet PCR workflow. The PCR mix is partitioned into thousands of nanoliter-sized droplets using specialized oil and microfluidics technology. The droplets are subjected to thermal cycling in a standard PCR machine. A PCR reaction only occurs in those droplets carrying the target DNA. PCR products are detected by a TaqMan assay. Briefly, the TaqMan probe hybridizes to an internal site of the PCR product. The probe has a 5′ fluorophore whose fluorescence is quenched by a 3′ quencher. Once the DNA polymerase reaches the probe during the extension step, the probe is cleaved by the polymerase’s 5′ to 3′ exonuclease activity. This action liberates the fluorophore from the quencher so that the fluorescence can be detected when excited by the appropriate wavelength of light. Droplets are read one by one using a droplet reader for fluorescence in each of two channels (FAM in blue and VIC in green). The data are displayed in a 2-D plot of positive droplets in the FAM and VIC channels, double-positive (aqua), and double-negative (gray). See text for further details.
The PCR reaction is carried out using a standard thermal cycler. After amplification, the fluorescence of each droplet is read in succession by a droplet reader (an instrument similar to a flow cytometer). Droplets that contain the target ROI or REF will fluoresce in the corresponding channel (positive droplets), while those without target will not (negative droplets)—thus the “digital” nature of ddPCR. The counts of positive and negative droplets for each target are related to the target’s concentration in the sample by the Poisson function
where λ is the average number of copies per droplet and p is the ratio of positive droplets to the total number of droplets (Hindson et al., 2011). The copies per droplet, λ, can be converted to the number of copies per μl by knowing the volume of reaction per droplet (~1 nl). In this way, the concentration of the target DNA (ROI or REF) can be calculated without using standard samples.
Here, we present a Basic Protocol for quantifying nucleic acids with ddPCR. In this protocol, we illustrate the use of ddPCR in copy number variant (CNV) analysis. Alternate Protocols are provided for three other applications: rare variant detection, SNP genotyping, and transcript quantification. For more information on these assays, please see Background Information.
STRATEGIC PLANNING
Designing Assays
TaqMan PCR assays are designed to amplify 60 to 150 bp within the target region. Smaller products are preferred as longer amplicons generally amplify less efficiently. We typically design primers with a melting temperature (Tm) of 60°C. Other primer melting temperatures are acceptable, provided that the temperature for the annealing/extension step is changed accordingly (see Critical Parameters). The Tm for the internal hybridization probe should be ~8° to 10°C higher than the primer Tm (see UNIT 2.10 for discussion of TaqMan assays). Avoid designing probes with a 5′ guanine, as this may partially quench the fluorescence (if unavoidable, the reverse complement of the probe can be used). In addition, avoid homopolymer runs of greater than 3 bases (particularly guanine bases) in the probe sequence to reduce secondary structure. Duplex PCR is performed with one assay to the region of interest (ROI) and one to a reference region (REF).
For CNV analysis, the ROI amplicon is designed to be fully within the putative CNV and RPP30 is recommended as the standard reference gene (Hindson et al., 2011; see Reagents and Solutions for primer/probe sequences). We design our ROI amplicon region based on a reference genome that has been masked with RepeatMasker (also available from the UCSC genome browser) to avoid known repeats (Tarailo-Graovac and Chen, 2009). In addition, we ensure that our PCR primers amplify a single product by running the “in silico PCR” tool available on the UCSC browser.
Preparing DNA
We suggest using an input of 100 ng of DNA; however, the dynamic range of the assay is relatively broad compared to traditional real-time PCR. Depending on the application, the assay can yield results with a minimum of 10 pg per reaction to a maximum of 350 ng. For optimization, a dilution series can be performed.
We typically perform an enzymatic digestion of genomic DNA prior to generating droplets. The viscosity of undigested genomic DNA can theoretically interfere with proper partitioning of droplets; however, we have obtained excellent results without digestion. When attempting to detect a CNV duplication event, we do digest the sample to separate any closely linked duplications. We digest with AluI (a 4-cutter that will cut on average once every 44 bp or 256 bp). However, any restriction enzyme can be used as long as the cleavage site is not present within the target amplicon sequence.
BASIC PROTOCOL: CNV DETECTION USING BIO-RAD’s QX100 DIGITAL DROPLET PCR PLATFORM
There are several ddPCR systems commercially available. Here we present our protocol for CNV analysis using the Bio-Rad QX100 system (Bio-Rad, 2012). The basic work-flow consists of digesting DNA, setting up reactions, making droplets, thermal cycling, and running on the droplet reader (see Fig. 7.24.1 and Introduction). This protocol is instrument specific but data analysis and interpretation of results are generalizable to other platforms. See alternate protocols for adjustments that can be made for other applications: rare variant detection, SNP genotyping, or transcript quantification.
Materials
DNA
Nuclease-free water
10× restriction enzyme buffer
AluI or alternate restriction enzyme
2× ddPCR master mix (includes hot-start DNA Polymerase, dNTPs including dUTP; Bio-Rad)
20× ROI target primer/TaqMan probe mix (see recipe)
20× REF target (RPP30) primer/TaqMan probe mix (see recipe)
2× control buffer (Bio-Rad, cat. no. 186-3052)
Heat block or water bath
96-well plates
Centrifuge
DG8 droplet generator cartridges (single-use; Bio-Rad)
DG8 droplet generator cartridge holder (Bio-Rad)
ddPCR droplet generation (DG) oil (Bio-Rad)
DG8 gaskets (single-use; Bio-Rad)
QX100 droplet generator (Bio-Rad)
Eppendorf twin.tec semi-skirted 96-well plate
Heat sealer
Heat sealing PCR foil
Thermal cycler
Bio-Rad QX100 droplet reader
QuantaSoft software
Digest the DNA
-
1
Check the sequence of both ROI and REF amplicons for AluI (or other preferred restriction enzyme) sites.
-
2
Calculate the volumes of components required based on the number of reactions as follows (include excess):
200 ng of DNA diluted in nuclease-free water to 8.9 μl
1 μl of 10× restriction enzyme buffer
0.1 μl AluI enzyme 10,000 U/ml.
-
3
Incubate for at least 1 hr at 37°C (or active temperature of alternate enzyme) in PCR/heat block or water bath.
-
4
After incubation, dilute the reaction 1:2 by adding 10 μl of nuclease-free water.
This will stop the reaction and dilute salts present in the digest buffer that may interfere with PCR. -
5
Mix well by pipetting up and down.
Assemble PCR reactions
-
6
Assemble the components of the reaction in a standard 96-well plate as follows:
12.5 μl of 2× Bio-Rad ddPCR mix (contains buffer, DNA polymerase, dideoxynucleotide triphosphates)
1.25 μl of 20× ROI target Primer/TaqMan probe mix
1.25 μl of 20× RPP30 (REF target) primer/TaqMan probe mix
-
10 μl digested DNA diluted in nuclease-free water to 10 μl (from step 5).
The Bio-Rad 2× ddPCR mix has been optimized for droplet generation. Substitution of this mix will result in failure of droplet formation. We assemble reactions in a total volume of 25 μl, although droplet generation only uses 20 μl. Excess volume helps to ensure that no air bubbles are transferred to the droplet generator cartridge.See Reagents and Solutions for oligo concentrations present in the 20× primer/TaqMan probe mix for both ROI and REF targets, and for oligo sequences of the REF target assay that we suggest for CNV analysis (RPP30).
-
7
Centrifuge the plate of reactions briefly (15 sec) at 150 × g, room temperature, to ensure the contents of the reaction are at the bottom of the well.
-
8
Mix the reactions by pipetting 15 to 20 μl up and down ~15 times to ensure a completely homogeneous reaction mixture.
-
9
If necessary, briefly centrifuge the plate again to ensure the contents of the reaction are at the bottom of the well.
Droplet generation via QX100 droplet generator
-
10
Insert Bio-Rad consumable microfluidics cartridge into cartridge holder and slide edges of the holder to snap closed.
-
11
Pipet 70 μl droplet generator oil into all of the wells of the cartridge designated “oil” by the cartridge holder.
-
12
Pipet 20 μl of the assembled reaction (from step 9) into cartridge wells designated “sample.” Avoid pipetting any air bubbles into the well as this may prevent droplet generation.
When dispensing sample into the cartridge, start with the pipet tip at the bottom of the well and move up slowly while depressing the plunger to prevent bubbles from forming at the bottom of the well. Do not depress the plunger of pipet further than the first stop when dispensing. A small amount of sample (<1 μl) may remain in the pipet tip after dispensing to the first stop. -
13
If the number of reactions is less than eight per cartridge, fill the remaining sample wells with 20 μl of control buffer (supplied at 2×) so that none of the sample wells are empty during droplet generation.
-
14
Manually inspect each sample well for air bubbles and carefully remove bubbles with a pipet tip, if necessary.
The droplet generator may fail to make droplets when air bubbles are present in the well, as the air may clog the microfluidic channel. -
15
Attach the consumable gasket to the top of the holder/cartridge.
-
16
Insert the holder/cartridge into the QX100 Droplet Generator and close the door.
All eight positions must have oil and sample/buffer in the wells. -
17
Wait 2 min for droplet generation to complete.
-
18
Open the door and remove the holder/cartridge from the QX100 Droplet Generator.
-
19
Remove the gasket and manually inspect droplet wells to ensure droplet generation was successful.
When droplets are generated successfully, the wells will appear slightly opaque. -
20
Transfer the entire volume of the droplet well (approximately 40 μl) from the cartridge holder into an Eppendorf twin.tec semi-skirted 96-well plate PCR plate.
We suggest using a multichannel pipet and pipetting extremely slowly in order to prevent droplets from being disturbed or broken. Pipet tip should never directly contact the bottom of the well, as this may cause droplets to break. -
21
Seal the plate with an Easy Pierce thermal foil seal.
Do not centrifuge the plate once droplets have been generated.
Thermal cycling
-
22
Thermal cycle the plate in a standard 96-well thermal cycler using the protocol in Table 7.24.1 as per Bio-Rad’s standard protocol.
The anneal/extend temperature may need to be adjusted, especially if a different Tm combination of primer/probe was used (i.e., 60°C for primers and 68°C for probes).
Table 7.24.1.
Standard Thermal Cycling Conditions (Bio-Rad)
| Cycling step | Temperature | Time | # of cycles |
|---|---|---|---|
| Enzyme activation | 95°C | 10 min | 1 |
| Denaturation | 94°C | 30 sec | 40a |
| Anneal/extend | 60°C | 60 sec | |
| Enzyme deactivation | 98°C | 10 min | 1 |
| Hold | 4°C | Infinite | 1 |
The denaturation and anneal/extend steps are combined for a total of 40 cycles.
Droplet reader: setup and reading
-
23
Check that the droplet reader has sufficient droplet reader oil in supply bottle and that the waste container does not need to be emptied.
Indicator light will blink amber when oil needs to be refilled or waste emptied. Always add 50 ml of 10% bleach to the empty waste container. -
24
Secure the PCR plate containing the droplets in the plate reader holder.
-
25
Enter experiment information into the template and apply the following to each well:
-
Experiment
For CNV analysis choose number of copies of reference gene (two copies for a diploid genome)
Sample name
Define assay 1 (FAM)
Define assay 2 (VIC or HEX).
-
-
26
Save the template.
-
27
Start the plate run.
-
28
Select the dye pair in use (FAM/VIC or FAM/HEX) and the direction for the wells to be read (by column or by row).
Droplet reader: analysis
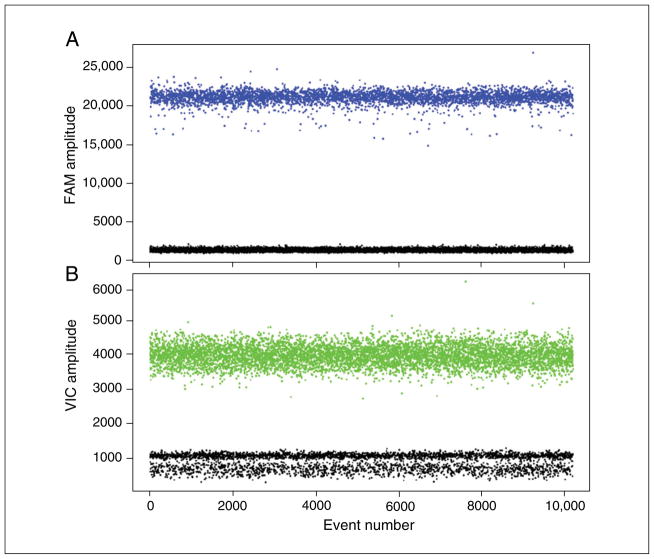
The figures we present here can be generated by the QuantaSoft software, which graphically represents each droplet by a single dot in the 1-D and 2-D Amplitude views. The QuantaSoft software will automatically set a fluorescence threshold for each well to differentiate positive and negative droplets. Once the threshold has been set, all of the droplets with fluorescence above the threshold (blue in Fig. 7.24.2) are considered positive and all droplets below the threshold (black) are negative.
Figure 7.24.2.
Fluorescence amplitude plots for droplets in the (A) FAM channel and (B) VIC channel. Each dot represents a single droplet or “event.” The horizontal axis represents the event number and the vertical axis represents the fluorescence amplitude in the respective channel. Two distinct populations are seen in each channel, one with high fluorescence intensity (positive droplets) and one with low intensity (negative droplets).
-
29
After the plate is run (approximately 2 min/well), run analysis of results to convert positive and negative droplets to concentration (in QuantaSoft software click “Analyze” icon).
-
30
Manually inspect the results of each well. Each dot on the graph represents the fluorescence detected from a single droplet. If necessary, set or reset the threshold to differentiate positive and negative droplets. See Figure 7.24.2.
The QuantaSoft software will automatically set a threshold for most wells, but occasionally results will appear as described in the “Troubleshooting” section and a well will display a “No call” status. In this case, a threshold must be manually set.
Interpretation of results
-
31
Open the “Analyze” section to find the concentration of each target in copies per microliter.
The concentration in copies per microliter is automatically calculated using the Poisson equation in the “Introduction.” -
32
Find the CNV for each ROI in the results table.
The software calculates the copy number automatically. The ratio of the ROI to REF concentration is multiplied by the number of copies per genome of the REF (two for diploid genomes). See the Troubleshooting section for interpretation of non-integer values.In Table 7.24.2, we show results for three samples in a representative CNV experiment. In this experiment, amplification of the ROI is detected in the FAM channel, while the REF gene is detected in the VIC channel. We used RPP30 as a reference with two copies per diploid genome (Hindson et al., 2011). When the ratio of ROI:REF concentrations is close to 1 (sample 1 in Table 7.24.2), the ROI has a copy number of 2 (2.003). This is calculated by multiplying the ROI:REF ratio (1.002) by the number of copies of REF per diploid genome. The assay for sample 2 shows a copy number loss in the ROI region, where the ROI concentration is half of the reference (0.494) and therefore a copy number of 1 (0.988). Finally, a copy number gain is seen for sample 3. In this case, the ROI has one and a half (1.463) times the copies per microliter compared to the reference of 2, therefore a copy number of 3 (2.926).
Table 7.24.2.
Sample Results from a Representative CNV Experiment
| Positive droplets | Negative droplets | Concentration (copies/μl) | Concentration ratio | CNV | |
|---|---|---|---|---|---|
| Sample1 FAM | 5798 | 7422 | 634 | 1.002 | 2.003 |
| Sample1 VIC | 5788 | 7432 | 633 | ||
| Sample2 FAM | 3702 | 9304 | 368 | 0.494 | 0.988 |
| Sample2 VIC | 6405 | 6601 | 745 | ||
| Sample3 FAM | 9567 | 1865 | 1990 | 1.463 | 2.926 |
| Sample3 VIC | 8115 | 3317 | 1360 |
ALTERNATE PROTOCOL 1: RARE VARIANT DETECTION
The rare variant may be a SNP or translocation. Assays for SNPs can be designed as described below in Alternate Protocol 2. Assays for translocations can be designed by choosing primers that amplify across the translocation junction for the ROI assay, and RPP30 (for example) for the REF assay. For materials, see the Basic Protocol.
Follow Basic Protocol, steps 1 to 31. At step 25a choose “Rare Event Detection” for experiment type.
-
Find the concentration for each allele (rare allele = ROI, common allele = REF) from the results Table.
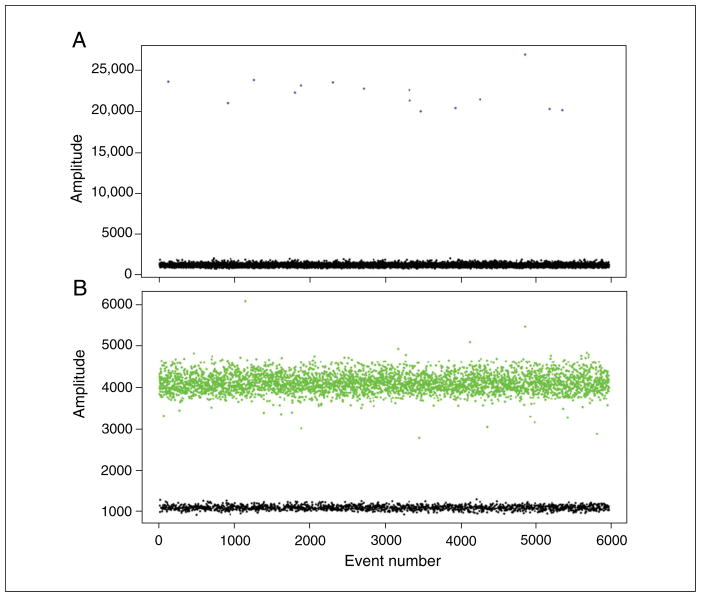
An example experiment is shown in Figure 7.24.3. The concentration of the ROI, a rare SNP, is 2.3 copies/μl while the REF concentration (reference allele) is 455 copies/μl. -
Calculate the percentage of cells heterozygous for the rare SNP.
The ratio of ROI to REF concentrations multiplied by 2 (for diploid genomes) yields the percentage of cells that are heterozygous for the event (see Background Information for more details). In this example, 2.3/455 multiplied by 2 equals 0.01, or 1% of cells heterozygous for the rare SNP.Depending on the rarity of the event, several assays over a varying spread of input DNA concentrations may be required (where higher input DNA concentrations are used for very rare events).
Figure 7.24.3.
Rare variant detection. Genomic DNA was prepared from tissue containing a rare somatic SNP (1% of cells are heterozygous for the SNP). A FAM-labeled probe detects the SNP (A) while the reference allele is detected with VIC (B). See text for details.
ALTERNATE PROTOCOL 2: SNP GENOTYPING
The TaqMan probes are designed to anneal to the SNP locus. Shorter probe lengths are used (12 to 18 bp) to increase the specificity of the hybridization, and the SNP locus should be located near the center of the probe. Since shorter probes generally have lower melting temperatures, the addition of a minor groove-binding protein to the 3′ end of the probe can be used to increase its Tm to within the target range (Kutyavin et al., 2000). The ROI probe is designed against the alternate allele of the SNP, while the REF probe is designed against the wild-type allele.
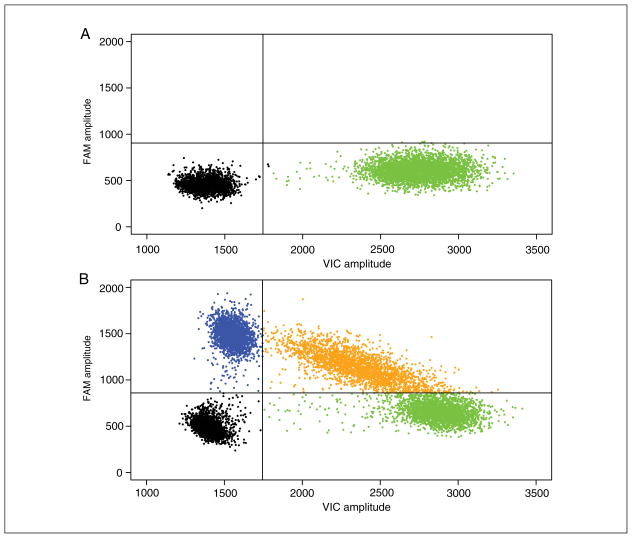
Follow the Basic Protocol, steps 1 to 31. At step 25a, choose “Rare Event Detection” for the experiment type. The concentrations calculated for each allele will inform whether the sample is positive for the wild-type allele, reference allele, or both. Figure 7.24.3 shows an example of 2-D amplitude plot of a genotyping experiment. Each dot represents a single droplet. The x axis shows fluorescence of the reference/wild-type probe in the VIC channel, and the y axis shows the fluorescence of the alternate allele in the FAM channel. The sample in Figure 7.24.4A is homozygous for the reference allele (the absence of FAM-positive droplets indicates the absence of the alternate allele). Figure 7.24.4B shows a sample heterozygous for this SNP, as there are positive populations for both probes in roughly equal proportions.
Figure 7.24.4.
Example of results generated from a SNP genotyping experiment. In this 2-D Amplitude view each axis represents the amplitude of fluorescence for either FAM (vertical axis) or VIC (horizontal axis). The FAM probe can hybridize only to the alternate allele, while the VIC probe hybridizes only to reference allele. (A) A homozygous reference sample exhibits positive droplets in only the VIC channel. (B) A heterozygous sample yields positive droplets in both the FAM and VIC channels in roughly equal proportions.
ALTERNATE PROTOCOL 3: TRANSCRIPT QUANTIFICATION
Prepare cDNA using standard protocols (e.g., Fraga et al., 2014). The ROI assay is designed against the transcript of interest, while the REF can be any standard housekeeping gene.
Follow the Basic Protocol steps 1 to 31. At step 25a, choose “Absolute Quantification” as the experiment type. The ratio of the ROI and REF concentrations provides normalized gene expression (normalized to a housekeeping gene). This value can be compared to similar values across varying experimental conditions to obtain gene expression changes.
REAGENTS AND SOLUTIONS
Use deionized, nuclease-free water in all recipes and protocol steps. For common stock solutions, see APPENDIX 2D; for suppliers, see SUPPLIERS APPENDIX.
Primer/TaqMan probe mix, 20×
20 × primer/TaqMan probe mix for ROI and REF targets is a combination of both primers and fluorescently labeled probes at the following concentrations:
Forward primer: 18 μM
Reverse primer: 18 μM
Labeled probe(s): 5 μM
RPP30 assay (Hindson et al., 2011): Primer and probe sequences
Forward primer: GATTTGGACCTGCGAGCG
Reverse primer: GCGGCTGTCTCCACAAGT
Probe: VIC-CTGACCTGAAGGCTCT-MGB-NFQ
COMMENTARY
Background Information
Digital droplet PCR is an easy-to-use method for detecting and quantifying nucleic acids with unparalleled sensitivity and specificity. The power of ddPCR is best illustrated by a discussion of the various applications that take full advantage of this technique’s unique attributes. Here we discuss how ddPCR is used in CNV analysis, rare variant detection, SNP genotyping, and transcript quantification.
A copy number variation (CNV) is a duplication or deletion event that occurs at an interval in the genome. Traditionally, these events can be difficult to measure using standard real-time PCR assays, as systematic errors can easily be made while normalizing DNA concentrations used in standard samples and in taking cycle threshold (Ct) measurements (UNIT 2.13). These systematic errors can lead to ambiguous results with non-integer copy numbers. However, with ddPCR, nucleic acid concentrations are obtained without using standard samples. In addition, concentrations are determined in ddPCR by counting positive droplets rather than finding cycle thresholds, which is inherently far less error-prone. Therefore, CNV measurements by ddPCR are more accurate and less ambiguous. The relative ease of CNV detection by ddPCR also allows one to run assays more quickly and at higher throughput than with traditional qPCR.
The remarkable sensitivity of ddPCR is highlighted by the ability to detect and quantify rare events. For example, consider the case where genomic DNA was prepared from a heterogeneous tissue consisting of two populations of cells. One population was present as a minority (less than 1%) and contained a rare and unique somatic variant (such as a translocation or SNP) while the other, majority, population did not. The duplex PCR assay is designed such that one channel targets the variant allele (allele A) while the other targets the reference allele (allele B). Since the PCR reaction is partitioned into thousands of droplets, it is relatively easy to find a very rare allele that is represented by just one positive droplet in the assay. This level of sensitivity is unparalleled compared to standard PCR or qPCR methods. An estimate of tissue heterogeneity can be directly calculated from the ratio of the A and B allele concentrations (as in Alternate Protocol 1. NOTE: If A is a common allele, the ratio of A to the total, A + B, is used). This ratio is multiplied by 2 to obtain the proportion of cells heterozygous for the rare A allele (for diploid genomes). Figure 7.24.3 shows an example of a rare somatic SNP where 1% of the cells are heterozygous for the variant allele.
The ability to detect one positive droplet out of several thousand highlights ddPCR’s remarkable sensitivity (Hindson et al., 2011). Less obvious, however, is how droplet generation results in improved specificity. Due to the random distribution of targets into droplets, there is less opportunity for nonspecific am-plification and background signal, which increases specificity. The use of the TaqMan internal hybridization probes also contributes to increased specificity. The specificity of a ddPCR experiment can be empirically determined by the number of populations of positive droplets observed in the amplitude plots (contrast Fig. 7.24.2 with Fig. 7.24.6). An experiment with high specificity exhibits only one population (Fig. 7.24.2). The high specificity of ddPCR makes it possible to conclude that rare positive droplets are true positive events; however, appropriate controls are still needed to demonstrate a given primer/probe pair’s true specificity.
Figure 7.24.6.
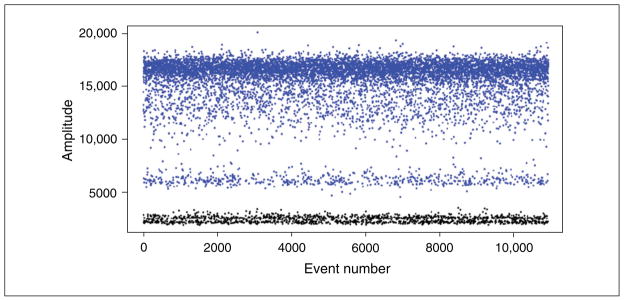
Example result from a PCR assay that has homology to another region. The nonspecific amplification is less efficient and results in a second positive population at lower intensity.
A simple variation of the ddPCR protocol allows for relatively easy single-nucleotide polymorphism (SNP) genotyping that can offer higher throughput than standard Sanger sequencing. The procedure is exactly the same as described above for rare variant detection, except in this case the sample is homogeneous and the A allele is “common.” The ratio of positive droplets from the two channels informs whether the sample is homozygous reference, heterozygous, or homozygous variant for the SNP (Fig. 7.24.4).
Transcript quantification, or gene expression analysis, is refreshingly straightforward with ddPCR. With absolute quantification, the exact copies per reaction of the transcript of interest and a housekeeping reference gene can be deduced. In addition, a simple ratio of the two provides normalized expression. Since quantification by ddPCR is not experiment-specific, fold expression of the transcript can be calculated across several experimental conditions. There is no need for standard assays or determining cycle thresholds, etc. as in qPCR, which can introduce error. The high sensitivity of ddPCR also allows for the quantification of very rare transcripts.
Critical Parameters
PCR conditions
The temperature setting for the anneal/ extend step in the thermal cycling protocol should be approximately the same as the Tm for the primers. Therefore, if primers are chosen with a Tm other than 60°C, the thermal cycling protocol should be adjusted accordingly.
Probe selection
When selecting primer-probe sets, it is critical that the Tm of the hybridization probe be ~8° to 10°C higher than that of the primer pair. If a suitable probe cannot be found, a probe with a lower Tm can be used provided that a 3′-minor groove binder is added (Kutyavin et al., 2000). The 3′ MGB typically adds about 10°C to the Tm; however, we have had success with probes of even lower Tm when this moiety is added.
Troubleshooting
See Table 7.24.3 for a list of troubleshooting issues that might be encountered.
Table 7.24.3.
Troubleshooting of ddPCR Results
| Problem | Cause | Solution |
|---|---|---|
| LED indicator on droplet generator flashes amber and droplets are not generated | Samples have been dispensed with air bubbles and droplets cannot be generated | Remove air bubbles with a 10 μl pipet tip and repeat |
| Only one population exists (no discrimination between positive and negative) in ROI or REF channel | Restriction site exists within putative amplicon and all droplets are negative for given assay Too much DNA was used and all droplets are positive |
Digest DNA with a different restriction enzyme that is absent from both ROI and REF amplicons and repeat assay Repeat assay with a lower amount of input DNA |
| Resulting fluorescence amplitudes have negative values | Incorrect dye pair was selected when plate was run and resulting amplitudes are negative | Reprocess raw data (under “options” in Quantasoft software) with correct dye pair |
| “Raining” effect with samples (Fig. 7.24.5) | Reaction is not completely homogenized before droplets are generated and probe is not sufficiently distributed | Mix reaction more thoroughly before partitioning into droplets |
| More than one population of positive droplets (Fig. 7.24.6) | Assay may be designed in a region that has high homology to another region that is amplifying less robustly | Design a new assay |
| CNV values are not near integers | DNA may not be fully digested preventing closely linked duplications from being distributed into different droplets Assay may be designed in a region that has high homology to another region |
Increase digest time and repeat Design a new assay |
| CNV values are not near integers | CNV exists as a somatic mutation (chimeric sample) | None |
Anticipated Results
Ideally, there will be a clear differentiation between positive and negative droplets. See Figure 7.24.2 for an example.
Time Considerations
The entire protocol from digest to analysis can be done in a single day (approximately 7 hr). See Table 7.24.4 for time considerations.
Table 7.24.4.
Time Considerations for ddPCR Workflow
| Digest prep, incubation, and dilution | 90 mina |
| Reaction plate setup | 15–30 min |
| Droplet generation | 60 min |
| Thermal cycling protocol | 120 mina |
| Plate reader | 120 min |
Stopping point.
Digests can be performed at any time and stored indefinitely at −20°C prior to ddPCR reaction setup. After thermal cycling, the droplets can be left up to 24 hr at 4°C before reading on the plate reader.
Figure 7.24.5.
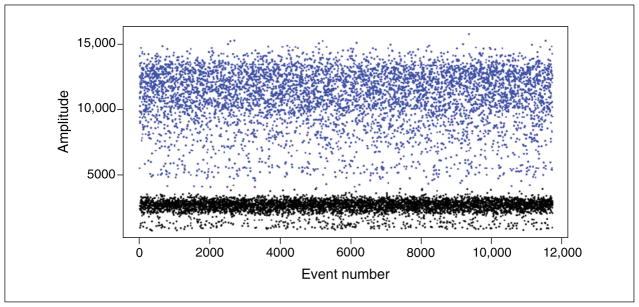
Example result when the PCR mix has not been mixed sufficiently before droplet generation. The non-homogeneous reaction has different amounts of primer/probe mix in each droplet which creates a “raining” effect (fluorescence across a gradient of intensities).
Acknowledgments
Jason Homsy is supported by the John S. LaDue Memorial Fellowship at Harvard Medical School.
Literature Cited
- Bio-Rad. QX100 Droplet Digital PCR System Guide. Bio-Rad; Pleasanton, Calif: 2012. [Google Scholar]
- Fraga D, Meulia T, Fenster S. Real-time PCR. Curr Protoc Essential Lab Techn. 2014;8:10.3.1–10.3.40. [Google Scholar]
- Hindson BJ, Ness KD, Masquelier DA, Belgrader P, Heredia NJ, Makarewicz AJ, Bright IJ, Lucero MY, Hiddessen AL, Legler TC, Kitano TK, Hodel MR, Petersen JF, Wyatt PW, Steenblock ER, Shah PH, Bousse LJ, Troup CB, Mellen JC, Wittmann DK, Erndt NG, Cauley TH, Koehler RT, So AP, Dube S, Rose KA, Montesclaros L, Wang S, Stumbo DP, Hodges SP, Romine S, Milanovich FP, White HE, Regan JF, Karlin-Neumann GA, Hindson CM, Saxonov S, Colston BW. High-throughput droplet digital PCR system for absolute quantitation of DNA copy number. Anal Chem. 2011;83:8604–8610. doi: 10.1021/ac202028g. [DOI] [PMC free article] [PubMed] [Google Scholar]
- Kutyavin IV, Afonina IA, Mills A, Gorn VV, Lukhtanov EA, Belousov ES, Singer MJ, Walburger DK, Lokhov SG, Gall AA, Dempcy R, Reed MW, Meyer RB, Hedgpeth J. 3′-Minor groove binder-DNA probes increase sequence specificity at PCR extension temperatures. Nucleic Acids Res. 2000;28:655–661. doi: 10.1093/nar/28.2.655. [DOI] [PMC free article] [PubMed] [Google Scholar]
- Tarailo-Graovac M, Chen N. Using RepeatMasker to identify repetitive elements in genomic sequences. Curr Protoc Bioinform. 2009;25:4, 10.1–4.10.14. doi: 10.1002/0471250953.bi0410s25. [DOI] [PubMed] [Google Scholar]


