

Abstract
Objectives
We propose a novel computational approach for the automated classification of classic versus atypical usual interstitial pneumonia (UIP).
Materials and Methods
33 patients with UIP were enrolled in this study. They were classified as classic versus atypical UIP by a consensus of two thoracic radiologists with more than 15 years of experience using the American Thoracic Society evidence–based guidelines for CT diagnosis of UIP. Two cardiothoracic fellows with one year of subspecialty training provided independent readings. The system is based on regional characterization of the morphological tissue properties of lung using volumetric texture analysis of multiple detector CT images. A simple digital atlas with 36 lung subregions is used to locate texture properties, from which the responses of multi-directional Riesz wavelets are obtained. Machine learning is used to aggregate and to map the regional texture attributes to a simple score that can be used to stratify patients with UIP into classic and atypical subtypes.
Results
We compared the predictions based on regional volumetric texture analysis with the ground truth established by expert consensus. The area under the receiver operating characteristic curve of the proposed score was estimated to be 0.81 using a leave-one-patient-out cross-validation, with high specificity for classic UIP. The performance of our automated method was found to be similar to that of the two fellows and to the agreement between experienced chest radiologists reported in the literature. However, the errors of our method and the fellows occurred on different cases, which suggests that combining human and computerized evaluations may be synergistic.
Conclusions
Our results are encouraging and suggest that an automated system may be useful in routine clinical practice as a diagnostic aid for identifying patients with complex lung disease such as classic UIP, obviating the need for invasive surgical lung biopsy and its associated risks.
Introduction
Idiopathic pulmonary fibrosis (IPF) is a specific form of progressive fibrosing parenchymal pneumonia of unknown cause, and is the leading cause of end-stage lung disease requiring transplantation accounting for over 50% of lung transplants [1]. Median survival for patients with IPF remains dismal at 3 years after diagnosis. [2, 3, 4]. IPF is associated with the histologic and/or radiologic pattern of usual interstitial pneumonia (UIP) [5, 6]. Candidates for surgical biopsy must be carefully selected as the procedure is invasive, costly and carries significant risks in patients with possible UIP. Specifically, an acute exacerbation of their lung disease is an uncommon but potentially fatal complication following biopsy [2]. Surgical lung biopsy can be obviated when the clinical and radiographic impression are typical of UIP [7, 8, 9, 10]. However, atypical appearances of UIP are common, accounting for 30% to 50% of patients [2, 11]. In this context, candidate selection for lung biopsy requires a multidisciplinary consensus of clinicians and radiologists experienced in intersitial lung diseases, found only in specialized centers of practice.
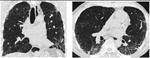
The classic computed tomography (CT) appearance of UIP is characterized by basal- and peripheral-predominant reticular abnormality and honeycombing [2, 12] (see Table 1). Importantly, a confident CT diagnosis of UIP also requires the absence of atypical findings. The accurate identification of classic UIP requires meticulous characterization of parenchymal abnormalities as well as appropriate anatomic localization, mosty accurately performed by experienced thoracic radiologists [13]. The characterization of lung parenchymal abnormalities such as honeycombing, reticulation and ground glass requires the appreciation of subtle three-dimensional (3D) morphological tissue properties (e.g., parenchymal texture) shown in Figure 1. A challenge is that visual inspection demonstrates low reproducibility [14]. The importance of relating these patterns to their anatomical location in the lungs (upper, middle, lower zones, etc.) adds another level of complexity and is subject to high inter-observer variation.
Table 1.
Radiological criteria for UIP [1].
| Classic UIP (all required) | Inconsistent with UIP (any) |
|---|---|
|
|
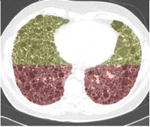
Figure 1.
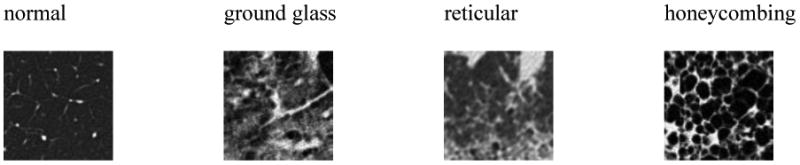
Common parenchymal appearances of UIP in CT.
The automated computerized recognition of lung tissue types in chest CT has been an active research domain to assist image interpretation and enhance diagnosistic accuracy [15]. Most studies are based on 2-D texture analysis on a slice basis [16, 17, 18]. Few studies fully leverage the wealth of 3-D data contained in contemporary volumetric CT datasets, specifically employing 3-D solid texture analysis [14, 19, 20]. Even more infrequent is an approach which localizes tissue texture properties in the lung anatomy. The latter is of crucial importance, not only for the differential diagnosis of diffuse lung diseases, but also because the typical appearance of most tissue types differs in distinct regions of the lung. The elaboration of a detailed digital atlas of the lungs is challenging mainly due to substantial inter-subject variations in pulmonary architecture and breathing cycle, especially for patients with IPF in whom fibrotic architectural distortion is a characteristic feature. A digital lung tissue atlas based on inter-subject 3-D image registration has been proposed to overcome this challenge [21]. This approach has recently been refined with a landmark-based coordinate system [22], which proved to be more robust to changes in structures across individuals. To our knowledge, this approach has not yet been used to characterize interstitial lung disease. Zrimec et al. developed a basic atlas to improve classification of honeycombing [23]. However, their approach is based on peripheral lung regions only (neither vertical nor lateral characterization), which are analysed with 2-D texture features extracted on axial slices.
In this paper, we used a basic anatomic atlas to define and extract morphological tissue properties (i.e., 3-D texture) from 36 anatomical subregions of the lung parenchyma. The latter were aggregated to create computational models of the radiological phenotypes for classic and atypical UIP. We hypothesize that the characterization of these radiological phenotypes differentiates the UIP subtypes, specifically classic versus atypical UIP. In order to produce an automated system for this classification task, machine learning was employed to derive a score from the regional texture attributes. This score identified patients with typical versus atypical UIP, the latter requiring further evaluation (e.g., biopsy) to confirm the diagnosis of IPF. To the best of our knowledge, our work is the first attempt to automatically differentiate the UIP subtypes using computational methods.
Materials and Methods
Dataset
CT examinations of 33 patients with biopsy-proven UIP/IPF from – anonymous – were retrospectively reviewed. Examinations were performed in compliance with national legislation and Declaration of Helsinki guidelines, with institutional review board (IRB) waiver of informed consent for this retrospective analysis. Two thoracic radiologists with more than 15 years of experience worked in consensus to classify each patient as classic versus atypical UIP based on the American Thoracic Society evidence-based guidelines for CT diagnosis of IPF/UIP listed in Table 1 [1]. There were 15 patients categorized as having a classic UIP and 18 patients with an atypical UIP appearance on CT. Additional readings were performed by two cardiothoracic fellows, each having one year specialty training to establish an optimal human performance. A volumetric CT scan was available for each patient, which was acquired within the year of the biopsy proven diagnosis. The standard routine protocols yielded a computed tomography dose index (CTDI) of 19.51 ± 8.81mGy and a dose length product (DLP) of 622.11 ± 269.97mGy-cm. CT scans were reconstructed with slice thicknesses of 0.625mm (1), 1mm (15), 1.25mm (14) and 2mm (3). The spacing between slices are 0.6mm (3), 1mm (13), 1.25mm (14), 2mm (3), and the pixel spacings are in the range of 0.59 to 0.82mm. All volumes were resampled to have isotropic cubic voxels of 0.59 × 0.59 × 0.59mm3 using cubic spline interpolation. This ensures that the physical dimensions (i.e., image scales and directions) are comparable between patients.
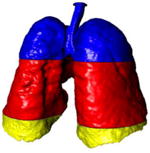
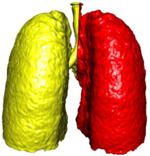
3-D anatomical atlas of the lungs
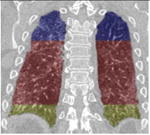
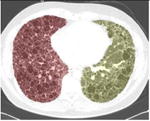
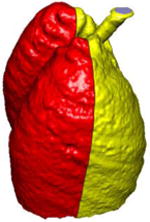
A simple anatomical atlas of the lung served as a 3-D reference to localize the various lung tissue types. The locations were chosen according to the predominant pattern sites of classic UIP (see Table 1). First, semi-automated segmentation of the lung volumes was carried out with a graphical user interface [24]. The user initiated a region growing algorithm from a seed point placed inside the lungs. The growing 3-D region mimics the propagation of air in lungs, where each neighboring voxel is added to the region Mlung if the summed value of its own neighbors differs by less than a threshold value defined by the user. The lungs are divided vertically into apical, middle lung and basal regions based on the center of mass of Mlung (see Table 2). The axial division results into central, intermediate and peripheral lung regions. Left, right, anterior and posterior regions are defined based on the intersections of the coronal and sagittal plane. The intersections of all 10 lung divisions results in 36 subregions.
Table 2.
Localization of the lung masks. The lungs are split perpendicularly to 4 axes [24].
| ⊥ vertical | ⊥ axial | ⊥ coronal | ⊥ sagittal |
|---|---|---|---|
| apical, central, basal | peripheral, middle, axial | left, right | anterior, posterior |
|
|
|
|
|
|
|
|
3-D texture quantification using Riesz wavelets
3-D multiscale Riesz filterbanks were used to characterize the morphological properties of the lung parenchyma in volumetric CT. These filters are advantageous for texture characterization because they quantify the local amount of directional image patterns at multiple scales. Second-order Riesz wavelets were used [25, 26], yielding 6 filters per image scale that are oriented along the main image directions X, Y, Z and three diagonals XY, XZ and YZ (see Figure 2). Likewise, Riesz wavelets allow for a complete coverage of image scales and directions. We hypothesize that the local morpholgical tissue properties of the normal lung, ground glass, reticulation and honeycombing can be expressed as the combinations of the responses of the oriented filters. The filters were implemented at multiple scales to analyze both fine morphological structures and coarser reticulations of the lung parenchyma.
Figure 2.
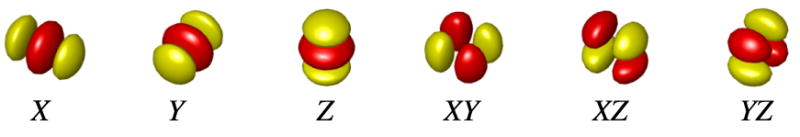
Second-order Riesz filters characterizing edges along the main image directions X, Y, Z and three diagonals XY, XZ and YZ.
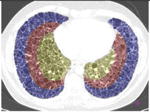
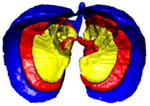
Regional lung texture analysis
The prototype regional distributions of the morphological tissue properties of classic versus atypical UIPs were learned using support vector machines (SVM). The SVM is a supervised machine learning algorithm that can learn the complex relationship between a group of variables (i.e., the vector vl) and the presence or absence of a class from an ensemble of examples called the training set [27]. Once the SVM model has been built from the example cases, it can predict the class of an unseen case with a confidence score (called “computer score” thereinafter). The group of variables feeding SVMs consisted of the responses (i.e., energies) of the multiscale Riesz filters in each of the 36 anatomical regions of the lungs (see Figure 3). The size of the vector vl regrouping the responses of the 6 Riesz filters at 4 scales from the 36 regions was equal to 864.
Figure 3.
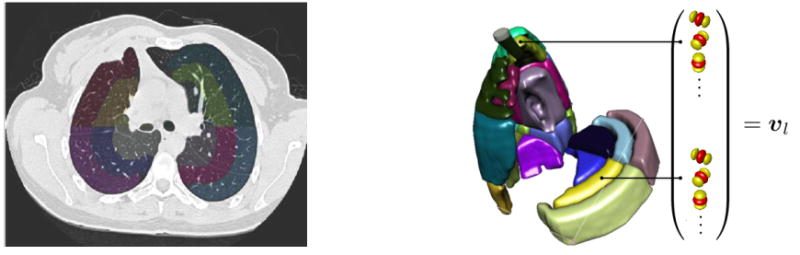
The 36 sub-regions of the lungs localized the prototype regional distributions of the texture properties.
In order to compare Riesz wavelets with other features that could capture the radiological phenotype of diffuse lung disease, two different feature groups were extracted for each region to provide a baseline performance: 15 histogram bins of the gray levels in the extended lung window [-1000; 600] Hounsfield Units (HU), and 3-D gray-level co-occurrence matrices (GLCM) [28]. Statistical measures from GLCMs are popular texture attributes that were used by several studies in the literature to characterize the morphological properties of lung tissue associated with interstitial lung diseases [19, 20, 16, 17]. They consist in counting the co-occurrence of voxels with identical gray level values that are separated by a distance d, which results in a co-occurrence matrix. Eleven statistics were extracted from the se matrices [28] as texture attributes. The choices of d and the number of gray levels were optimized by considering values in {-3; 3} and {8, 16, 32}, respectively. The size of the vector of attributes vl was 540 for the gray-level histogram attributes (called “HU” thereinafter) and 396 for the GLCM attributes.
Results
A leave-one-patient-out cross-validation (LOPO CV) evaluation was employed to estimate the performance of the proposed approach. The LOPO CV consisted of using all patients but one to train the SVM model and to measure the predition performance on the remaining test patient. The prediction performance was then averaged over all possible combinations of training and test patients. Receiver operating characteristic (ROC) curves of the system's performance in classifying between classic and atypical UIP are shown in Figure 4 for different feature groups and their combinations. ROC curves were obtained by varying the decision threshold between the minimum and the maximum of the score provided by the SVMs. A maximum area under the ROC curve (AUC) of 0.81 was obtained with the regional Riesz attributes, which suggests that prediction was correct for more that 4 out of 5 patients. The performance of HU and GLCMs attributes was close to random (0.54 and 0.6 for HU and GLCMs, respectively). On the other hand, predictive SVM models based on the responses of the Riesz filters, averaged over the entire lungs, had an AUC of 0.72.
Figure 4.

ROC analysis of the system's performance. Classic UIP is the positive class. Left: comparison of various feature groups using the digital lung tissue atlas. 3-D Riesz wavelets provide a superior area under the ROC curve (AUC) of 0.81. Right: importance of the anatomical atlas when compared to an approach based on the global tissue properties and comparison of the computer's and cardiothoracic fellows' performance. Bottom: probability density functions of the computer score for classic (red) and atypical UIP (blue) based on regional Riesz texture analysis and the computer's operating point highlighted in the upper right subfigure. Atypical UIP is associated with a negative score, which implies that positive scores predict classic UIPs with high specificity.
Our system's performance was also compared with the interpretations of two fellowship-trained cardiothoracic fellows, each having one year of experience. Interobserver agreement was assessed with Cohen's kappa statistic [29] and percentage of agreement (i.e., number of times the two observer agreed). The comparisons are detailed in Tables 3 and 4. The operating points of the two independent observers are reported in Figure 4 (top right). A detailed analysis of the six cases that were misclassified by our system is shown in Table 5 with representative CT images, including predictions from the computer and the two fellows compared with the consensus classification. The system predicted 2 classic UIP cases as atypical UIP, and 3 atypical UIP cases as classic UIP. A comprehensive analysis of all 33 cases is illustrated in the supplemental Table. Overall, 7 incorrect predictions were made by the fellows and 6 incorrect predictions by the computer. The fellows and the computer made only two common errors (cases 1 and 13).
Table 3.
Interobserver agreement (Cohen's kappa statistic).
| Cohen's kappa | consensus | fellow 1 | fellow 2 | computer (regional Riesz texture analysis) |
|---|---|---|---|---|
| consensus | 1 | - | - | - |
| fellow 1 | 0.629 | 1 | - | - |
| fellow 2 | 0.569 | 0.9374 | 1 | - |
| computer (regional Riesz) | 0.633 | 0.506 | 0.569 | 1 |
Table 4.
Interobserver agreement (% of times that the observers agreed).
| % agreement | consensus | fellow 1 | fellow 2 | computer (regional Riesz texture analysis) |
|---|---|---|---|---|
| consensus | 100 | - | - | - |
| fellow 1 | 81.82 | 100 | - | - |
| fellow 2 | 78.79 | 96.97 | 100 | - |
| computer (regional Riesz) | 81.82 | 75.76 | 78.79 | 100 |
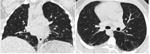
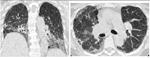
Table 5.
Detailed analysis of the six cases that were missclassified by our system. Coronal and axial views of the lung parenchyma in CT are shown with a window level of -500 HU and a width of 1400 HU.
|
|
| 1. Computer score: -1.13 (atypical UIP) ✗ | 6. Computer score: -0.82 (atypical UIP) ✗ |
| consensus: classic UIP | consensus: classic UIP |
| fellow 1: atypical UIP ✗ | fellow 1: classic UIP ✓ |
| fellow 2: atypical UIP ✗ | fellow 2: classic UIP ✓ |
|
| |
|
|
| 13. Computer score: -0.34 (atypical UIP) ✗ | 20. Computer score: 0.01 (classic UIP) ✗ |
| consensus: classic UIP | consensus: atypical UIP |
| fellow 1: atypical UIP ✗ | fellow 1: atypical UIP ✓ |
| fellow 2: atypical UIP ✗ | fellow 2: atypical UIP ✓ |
|
| |
|
|
| 24. Computer score: 0.1 (classic UIP) ✗ | 27. Computer score: 0.24 (classic UIP) ✗ |
| consensus: atypical UIP | consensus: atypical UIP |
| fellow 1: atypical UIP ✓ | fellow 1: atypical UIP ✓ |
| fellow 2: atypical UIP ✓ | fellow 2: classic UIP ✗ |
Discussion
We developed a novel computational method for the automated classification of classic versus atypical UIP based on regional volumetric texture analysis. This constitutes, to the best of our knowledge, a first attempt to automatically differentiate the UIP subtypes with computational methods. An SVM classifier yielded a score that predicts if the UIP is classic or atypical. The classifier was based on a group of attributes that characterize the radiological phenotype of the lung parenchyma—specifically, the morphological properties (i.e., texture) of the parenchyma. Since diffuse lung diseases can vary in the distribution and severity of abnormalities throughout the lungs, we extracted our quantiative image features from 36 anatomical regions of the lung. To our knowledge, adding this spatial characterization to the computational model is also innovative, and it is particularly relevant for assessing diffuse lung disease.
System performance and comparison with chest specialists
The proposed approach successfully predicted UIP subtypes for more than 4 out of 5 patients (AUC=0.81) with high specificity for classic UIPs. This performance is encouraging and suggests that an automated system may be useful in routine clinical practice for radiologists with limited experience in interpretation of diffuse lung diseases. The detailed case analyses (see supplemental Table) reveal that, with the exception of one case (case 20), the computer score was able to sort and grade patients from highly atypical (e.g., cases 2 and 3) to classic (e.g., case 33). The observer agreement between the computer and the consensus was associated with a kappa value of 0.63 and a percentage of agreement of 81.82, which is considered as being substantial in the literature [29]. The performance of the computer was found to be comparable to cardiothoracic fellows with one year of specialty training (see Figure 4 top right). The agreement between each of the two fellows and the computer was moderate (i.e., 0.51 and 0.57 kappa values and 75.8% and 78.8% agreement) when compared with their excellent inter-reader agreement (i.e., kappa value and percentage of agreeement of 0.94 and 97% respectively). However, the agreement between each of the fellows with the consensus classification (our gold standard) is considerably lower (i.e., 0.63 and 0.57 kappa values and 81.8% and 78.8% agreement). Interestingly, the agreement between the computer and the consensus was comparable to the agreement between the fellows and the consensus, suggesting that while the algorithm can still be improved in terms of agreement with the consensus, the current method performs at least as well as cardiothoracic fellows. The performance was also consistent with the inter-reader agreement between two expert radiologists (i.e., 4 and 8 years of experience, kappa value of 0.67) reported by Assayag et al. in [13]. Since the target application for this algorithm is for general radiologists, the proposed system could considerably improve their performance, a study which we plan to undertake.
Detailed case analysis of the system's performance
Our cohort had a much higher proportion of atypical UIPs accounting for over half the cases, which likely reflects a selection bias. In current practice, only cases that are atypical have histologic/pathologic confirmation, which was required for this cohort analysis. Many of the cases had subtle findings that required adhering very strictly to the guidelines for classification by the consensus, which may account for 3/6 erroneous predictions of atypical UIP by the computer (see Table 5 and the supplemental Table). We believe that the algorithm would perform better in a real-world setting, which does not reflect unusual cases referred to a quaternary academic institution.
Erroneous predictions of classic UIP by the computer occurred in 2 patients (24 and 27) where bronchiectasis was mistaken for honeycombing (see Table 5). This can be a difficult task even for experienced chest radiologists, but will constitute a target for further improvement of the system. One patient with diffuse disease without definite basilar predominance was also misclassified as classic UIP by the computer.
Overall, 7 incorrect predictions were made by the cardiothoracic fellows and 6 incorrect predictions by the computer. Combining these predictions results in only 2 incorrect predictions out of 33 (i.e. 94% correct predictions) demonstrating the potential benefit of computer-assisted diagnosis in the setting of UIP.
Comparison of the quantitative image features
The gray-level histograms (i.e., HU) failed to predict the UIP subtypes and 3-D GLCMs provided a slightly better specificity for classical UIPs. 3-D Riesz wavelets provided an AUC of 0.81, which was found to be higher than 3-D GLCMs and HU. The combination of Riesz and HU did not led to a performance improvement. This can be explained by the fact that the distinction between tissue types associated with UIP requires a fine characterization of the volumetric morphological tissue properties (i.e., 3-D texture) that only 3-D Riesz wavelets were able to extract. The prototype gray-level distributions of ground glass, reticular and honeycombing may not be sufficiently distinct to accurately discriminate among them, as shown in Figure 1. The comparison between global and regional texture analysis (see Figure 4 right) highlights the importance of localizing tissue texture properties, which is consistent with the medical knowledge [1].
Overall, we believe that our automated system may be useful in general radiology practices, accounting for the majority of sites where patients with IPF are initially evaluated, to accurately identify patients with classic UIP for which an unnecessary surgical biopsy can be avoided. The high resolution imaging of lung disease afforded by modern-day CT provides accurate 3-D anatomic/pathologic fidelity in patients with classic UIP features. A confident CT diagnosis of classic UIP can eliminate the need for an invasive surgical biopsy to confirm this diagnosis; this underscores the importance of an accurate and reliable interpretation of the CT examination. This task is often challenging, particularly in less specialized practice centers without access to experts experienced in interstitial lung disease. Nevertheless, reduction of needless invasive biopsies is desired when possible to reduce costs, and more importantly, to avoid unnecessary morbidity/mortalty in UIP patients. We recognize several limitations of the current work, including the small number of cases included in the study and the use of a very simple digital atlas of the lung anatomy. Future work will include validating our results in an independent data set and performing regional learning of 3-D rotation-covariant texture models of normal, ground glass, reticular and honeycombing [26, 30].
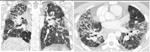
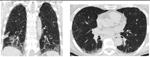
Supplementary Material
Supplemental Table. Detailed analysis of all 33 cases. The patients are ordered based on the computer score ranging from -1.13 (atypical UIP) to 1.74 (classic UIP). Coronal and axial views of the lung parenchyma are shown with a window level of -500 HU and a width of 1400 HU.
References
- 1.Raghu G, Collard HR, Egan JJ, et al. An official ATS/ERS/JRS/ALAT statement: Idiopathic pulmonary fibrosis: Evidence-based guidelines for diagnosis and management. American Journal of Respiratory and Critical Care Medicine. 2011 Feb;183(6):788–824. doi: 10.1164/rccm.2009-040GL. [DOI] [PMC free article] [PubMed] [Google Scholar]
- 2.Lynch DA, Huckleberry JM. Usual interstitial pneumonia: Typical and atypical high-resolution computed tomography features. Seminars in ultrasound, CT, and MR. 2014 Feb;35(1):12–23. doi: 10.1053/j.sult.2013.10.003. [DOI] [PubMed] [Google Scholar]
- 3.Sumikawa H, Johkoh T, Colby TV, et al. Computed Tomography Findings in Pathological Usual Interstitial Pneumonia: Relationship to Survival. American Journal of Respiratory and Critical Care Medicine. 2008 Feb;177(4):433–439. doi: 10.1164/rccm.200611-1696OC. [DOI] [PubMed] [Google Scholar]
- 4.Alhamad EH, Al-Kassimi FA, AlBoukai AA, et al. Comparison of three groups of patients with usual interstitial pneumonia. Respiratory Medicine (2012) 106. 2012 Nov;106(11):1575–1585. doi: 10.1016/j.rmed.2012.07.009. [DOI] [PubMed] [Google Scholar]
- 5.Lynch JP, Saggar R, Weigt SS, Zisman DA, White ES. Usual Interstitial Pneumonia. Seminars in Respiratory and Critical Care Medicine. 2006 Dec;27(6):634–651. doi: 10.1055/s-2006-957335. [DOI] [PubMed] [Google Scholar]
- 6.Johkoh T, Sumikawa H, Fukuoka J, et al. Do you really know precise radiologic–pathologic correlation of usual interstitial pneumonia? European Journal of Radiology. 2014 Jan;83(1):20–26. doi: 10.1016/j.ejrad.2013.05.017. [DOI] [PubMed] [Google Scholar]
- 7.Flaherty KR, King TE, Raghu JG, et al. Idiopathic interstitial pneumonia: What is the effect of a multidisciplinary approach to diagnosis? American Journal of Respiratory and Critical Care Medicine. 2004 Jul;170:904–910. doi: 10.1164/rccm.200402-147OC. [DOI] [PubMed] [Google Scholar]
- 8.Gogali A, Wells AU. Diagnostic approach to interstitial lung disease. Current Respiratory Care Reports. 2012 Dec;1(4):199–207. [Google Scholar]
- 9.Gruden JF, Panse PM, Leslie KO, Tazelaar HD, Colby TV. UIP Diagnosed at Surgical Lung Biopsy, 2000–2009: HRCT Patterns and Proposed Classification System. American Journal of Roentgenology. 2013 May;200(5):458–467. doi: 10.2214/AJR.12.9437. [DOI] [PubMed] [Google Scholar]
- 10.Aaløkken TM, Naalsund A, Mynarek G, et al. Diagnostic accuracy of computed tomography and histopathology in the diagnosis of usual interstitial pneumonia. Acta Radiologica. 2012 Apr;53(3):296–302. doi: 10.1258/ar.2011.110482. [DOI] [PubMed] [Google Scholar]
- 11.Raghu G, Lynch D, Godwin D, et al. Diagnosis of idiopathic pulmonary fibrosis with high-resolution CT in patients with little or no radiological evidence of honeycombing: secondary analysis of a randomised, controlled trial. The Lancet Respiratory Medicine. 2014 Apr;2(4):277–284. doi: 10.1016/S2213-2600(14)70011-6. [DOI] [PubMed] [Google Scholar]
- 12.Hunninghake GW, Lynch DA, Galvin JR, et al. Radiologic findings are strongly associated with a pathologic diagnosis of usual interstitial pneumonia. Chest. 2003 Oct;124(4):1215–1223. doi: 10.1378/chest.124.4.1215. [DOI] [PubMed] [Google Scholar]
- 13.Assayag D, Elicker BM, Urbania TH, et al. rheumatoid arthritis–associated interstitial lung Disease: Radiologic Identification of Usual Interstitial Pneumonia Pattern. Radiology. 2014 Feb;270(2):583–588. doi: 10.1148/radiol.13130187. [DOI] [PMC free article] [PubMed] [Google Scholar]
- 14.Depeursinge A, Foncubierta-Rodríguez A, Van De Ville D, Müller H. Three-dimensional solid texture analysis and retrieval in biomedical imaging: review and opportunities. Medical Image Analysis. 2014 Jan;18(1):176–196. doi: 10.1016/j.media.2013.10.005. [DOI] [PubMed] [Google Scholar]
- 15.Sluimer IC, Schilham A, Prokop M, van Ginneken B. Computer analysis of computed tomography scans of the lung: a survey. IEEE Transactions on Medical Imaging. 2006 Apr;25(4):385–405. doi: 10.1109/TMI.2005.862753. [DOI] [PubMed] [Google Scholar]
- 16.Park YS, Seo JB, Kim N, et al. Texture-Based Quantification of Pulmonary Emphysema on High-Resolution Computed Tomography: Comparison With Density-Based Quantification and Correlation With Pulmonary Function Test. Investigative Radiology. 2008 Jun;43(6):395–402. doi: 10.1097/RLI.0b013e31816901c7. [DOI] [PubMed] [Google Scholar]
- 17.Delorme S, Keller-Reichenbecher MA, Zuna I, Schlegel W, Kaick GV. Usual Interstitial Pneumonia: Quantitative Assessment of High-Resolution Computed Tomography Findings by Computer-Assisted Texture-Based Image Analysis. Investigative Radiology. 1997 Sep;32(9):566–574. doi: 10.1097/00004424-199709000-00009. [DOI] [PubMed] [Google Scholar]
- 18.Yoon RG, Seo JB, Kim N, et al. Quantitative assessment of change in regional disease patterns on serial HRCT of fibrotic interstitial pneumonia with texture-based automated quantification system. European Radiology. 2013 Mar;23(3):692–701. doi: 10.1007/s00330-012-2634-8. [DOI] [PubMed] [Google Scholar]
- 19.Korfiatis PD, Karahaliou AN, Kazantzi AD, Kalogeropoulou C, Costaridou LI. Texture-based identification and characterization of interstitial pneumonia patterns in lung multidetector CT. IEEE Transactions on Information Technology in Biomedicine. 2010 May;14(3):675–680. doi: 10.1109/TITB.2009.2036166. [DOI] [PubMed] [Google Scholar]
- 20.Xu Y, Sonka M, McLennan G, Guo J, Hoffman EA. MDCT-based 3D texture classification of emphysema and early smoking related lung pathologies. IEEE Transactions on Medical Imaging. 2006 Apr;25(4):464–475. doi: 10.1109/TMI.2006.870889. [DOI] [PubMed] [Google Scholar]
- 21.Li B, Christensen GE, Hoffman EA, McLennan G, Reinhardt JM. Establishing a normative atlas of the human lung: Intersubject warping and registration of volumetric CT images. Academic Radiology. 2003 Mar;10(3):255–265. doi: 10.1016/s1076-6332(03)80099-5. [DOI] [PubMed] [Google Scholar]
- 22.Li B, Christensen GE, Hoffman EA, McLennan G, Reinhardt JM. Establishing a normative atlas of the human lung: Computing the average transformation and atlas construction. Academic Radiology. 2012 Nov;19(11):1368–1381. doi: 10.1016/j.acra.2012.04.025. [DOI] [PMC free article] [PubMed] [Google Scholar]
- 23.Zrimec T, Wong JSJ. Improving computer aided disease detection using knowledge of disease appearance. Paper presented at: 12th World Congress on Health (Medical) Informatics; Brisbane, Australia. Aug, 2007. [PubMed] [Google Scholar]
- 24.Depeursinge A, Zrimec T, Busayarat S, Müller H. 3D lung image retrieval using localized features. Paper presented at: SPIE Medical Imaging 2011: Computer-Aided Diagnosis; Orlando, FL, USA. 2011. [Google Scholar]
- 25.Chenouard N, Unser M. 3D steerable wavelets and monogenic analysis for bioimaging. Paper presented at: IEEE International Symposium on Biomedical Imaging: From Nano to Macro; Chicago, IL, USA. Apr, 2011. [Google Scholar]
- 26.Depeursinge A, Foncubierta-Rodríguez A, Vargas A, et al. Rotation-covariant texture analysis of 4D dual-energy CT as an indicator of local pulmonary perfusion. Paper presented at: IEEE International Symposium on Biomedical Imaging: From Nano to Macro; San Francisco, CA, USA. Apr, 2013. [Google Scholar]
- 27.Cortes C, Vapnik V. Support-vector networks. Machine Learning. 1995 Sep;20(3):273–297. [Google Scholar]
- 28.Kurani AS, Xu DH, Furst J, Raicu DS. Co-occurrence matrices for volumetric data. Paper presented at: IASTED International Conference on Computer Graphics and Imaging; Kauai, Hawaii, USA. Aug, 2004. [Google Scholar]
- 29.Viera AJ, Garett JM. Understanding interobserver agreement: The kappa statistic. Family Medicine. 2005 May;37(5):360–363. [PubMed] [Google Scholar]
- 30.Depeursinge A, Foncubierta-Rodríguez A, Van De Ville D, Müller H. Rotation-covariant texture learning using steerable Riesz wavelets. IEEE Transactions on Image Processing. 2014 Feb;23(2):898–908. doi: 10.1109/TIP.2013.2295755. [DOI] [PubMed] [Google Scholar]
- 31.Guo J, Reinhardt JM, Kitaoka H, et al. Integrated system for CT-based assessment of parenchymal lung disease. Paper presented at: IEEE International Symposium on Biomedical Imaging; Washington, DC, USA. Jun, 2002. [Google Scholar]
Associated Data
This section collects any data citations, data availability statements, or supplementary materials included in this article.
Supplementary Materials
Supplemental Table. Detailed analysis of all 33 cases. The patients are ordered based on the computer score ranging from -1.13 (atypical UIP) to 1.74 (classic UIP). Coronal and axial views of the lung parenchyma are shown with a window level of -500 HU and a width of 1400 HU.