

Abstract
Traumatic injury to CNS fiber tracts is accompanied by failure of severed axons to regenerate and results in lifelong functional deficits. The inflammatory response to CNS trauma is mediated by a diverse set of cells and proteins with varied, overlapping, and opposing effects on histological and behavioral recovery. Importantly, the contribution of individual inflammatory complement proteins to spinal cord injury (SCI) pathology is not well understood. Although the presence of complement components increases after SCI in association with axons and myelin, it is unknown whether complement proteins affect axon growth or regeneration. We report a novel role for complement C1q in neurite outgrowth in vitro and axon regrowth after SCI. In culture, C1q increased neurite length on myelin. Protein and molecular assays revealed that C1q interacts directly with myelin associated glycoprotein (MAG) in myelin, resulting in reduced activation of growth inhibitory signaling in neurons. In agreement with a C1q-outgrowth-enhancing mechanism in which C1q binding to MAG reduces MAG signaling to neurons, complement C1q blocked both the growth inhibitory and repulsive turning effects of MAG in vitro. Furthermore, C1q KO mice demonstrated increased sensory axon turning within the spinal cord lesion after SCI with peripheral conditioning injury, consistent with C1q-mediated neutralization of MAG. Finally, we present data that extend the role for C1q in axon growth and guidance to include the sprouting patterns of descending corticospinal tract axons into spinal gray matter after dorsal column transection SCI.
Keywords: C1q, complement, inflammation, regeneration, spinal cord injury, sprouting
Introduction
After spinal cord injury (SCI), damaged fiber tracts face several obstacles to regeneration, including both cell intrinsic and microenvironmental factors. Adult CNS neurons exhibit a reduced growth state compared with adult peripheral neurons and to neurons in the developing CNS (Schwab and Bartholdi, 1996). Further, the developing glial scar acts as a physical and molecular barrier to regeneration (Silver and Miller, 2004). In addition, proteins associated with disrupted myelin after CNS trauma, including myelin associated glycoprotein (MAG) (Mukhopadhyay et al., 1994), Nogo-A (Caroni and Schwab, 1988), and OMgp (Wang et al., 2002), have been shown to be potent inhibitors of axonal growth (myelin associated inhibitors, MAIs). Although axonal growth inhibition likely plays a key role in regeneration failure, axonal guidance may also be important (Niclou et al., 2006) and soluble gradients of MAG have been shown to induce repulsive axon turning in culture (Song et al., 1998; Hines et al., 2010).
The inflammatory response to CNS trauma exerts both beneficial and detrimental effects on the pathological and behavioral progression after injury (Jones et al., 2005). An important but understudied component of the inflammatory response to CNS injury is complement. The complement system is an enzymatic cascade of serum proteins that can recruit inflammatory cells, mark pathogens for removal, and initiate cell lysis (Janeway, 2001). Complement mRNA and proteins, including C1q, C3, and factor B, increase and persist locally after SCI as a result of blood–brain barrier disruption and local synthesis by invading inflammatory and resident CNS cells (Anderson et al., 2004; Nguyen et al., 2008). In parallel, myelin extracts have been shown to activate the full complement cascade and complement C3 fragments to covalently associate with myelin in vitro and in vivo (Duce et al., 2006; Sun et al., 2010). Further, previous work in our laboratory has demonstrated colocalization of complement C1q and FB with axons (Anderson et al., 2004). The presumed function of complement protein-myelin interactions has been to facilitate myelin phagocytosis (Brück and Friede, 1991). Although inflammation and cell lysis are the hallmarks of complement activation, recent studies have also suggested nontraditional roles for complement proteins in developmental or adult organ regeneration, neuronal migration, neuroprotection, and synapse modulation (Peterson and Anderson, 2014). The consequences of complement activation for behavioral and histological recovery after CNS injury are thus unclear.
We investigated the interaction between complement and axon growth after injury and report a novel role for C1q in neurite outgrowth in vitro and in spinal cord axon regeneration in vivo. Primary neuron growth assay experiments using inhibitory substrates demonstrated C1q-mediated rescue from growth inhibition. Protein analyses of these cultures revealed direct C1q interference with MAG and associated reduction of growth inhibitory signal cascade activation in neurons. Similarly, C1q blocked MAG-mediated chemorepulsion of growing axons in a live imaging culture experiment. In parallel, C1q deficiency resulted in a change in the direction of ascending axon growth within the lesion after SCI with peripheral conditioning injury. Finally, the pattern of descending axon sprouting after SCI was also affected by C1q deficiency. These data demonstrate a novel interaction between C1q and axon growth both in vitro and in vivo.
Materials and Methods
Experiments.
All experiments were performed in accordance with the Institutional Animal Care and Use Committee (IACUC) at the University of California–Irvine and were consistent with federal guidelines. All groups and treatments were randomized and all surgeries, exclusions, tissue processing, imaging, and analyses were performed blinded to culture condition or mouse genotype.
Isolation of myelin substrate.
Myelin was isolated/purified from the cerebellum of an adult female Sprague Dawley rat brain according to a previous study (Cai et al., 1999). Briefly, tissue was homogenized with sucrose buffer solution containing protease inhibitors (Calbiochem) to yield a 1.4 m sucrose homogenate solution. A gradient was generated by layering the 1.4 m on top of 1.9 m, followed by 0.85 m and 0.25 m sucrose solutions, which were ultracentrifuged at 40,000 rpm for 14 h at 4°C. The myelin layer was isolated and homogenized again in dH2O containing protease inhibitors and centrifuged at 40,000 rpm for 1 h at 4°C. Myelin protein concentration was determined by BCA protein assay (Pierce). Serial dilutions of myelin ranging from 2.5 to 20 μg/ml were plated onto precoated poly-l-lysine (PLL; Sigma, 50 μg/ml) 8-well chamber slides (Lab-Tek). After overnight desiccation of myelin, dissociated cortical cells (50,000/ml, 0.2 ml/well) were plated on myelin for 2 d and an inhibitory concentration of myelin was determined to be 7.5 μg/ml (1.12 μg/well). This myelin concentration was used for all experiments (see Figs. 1, 2, 3).
Figure 1.

For cortical neurons plated on an inhibitory myelin substrate, complement C1q rescues neurite growth to control levels, whereas complement C3 exacerbates growth inhibition. A, Representative images of cortical neurons labeled for β-tubulin III (green) and Hoechst (blue), which were grown in wells with untreated buffer control, dried myelin then buffer incubation, dried myelin then C1q incubation, or myelin then C3 incubation, as indicated. B, Length of the longest neurite per β-tubulin III+ neuron is expressed as percentage of control wells (mean ± SEM for 3 independent experiments). Although myelin inhibited axon growth, myelin + C1q-treated neurons were completely rescued from inhibition, with neurites significantly longer than those on myelin. Myelin + C3 treatment exacerbated growth inhibition beyond that of myelin alone. Scale bar in A, 20 μm. For B, n = 3, **p < 0.01 one-sample t test vs control; ###p < 0.001 by one-way ANOVA with Dunnet post test vs myelin #p < 0.05 and ##p < 0.01.
Figure 2.
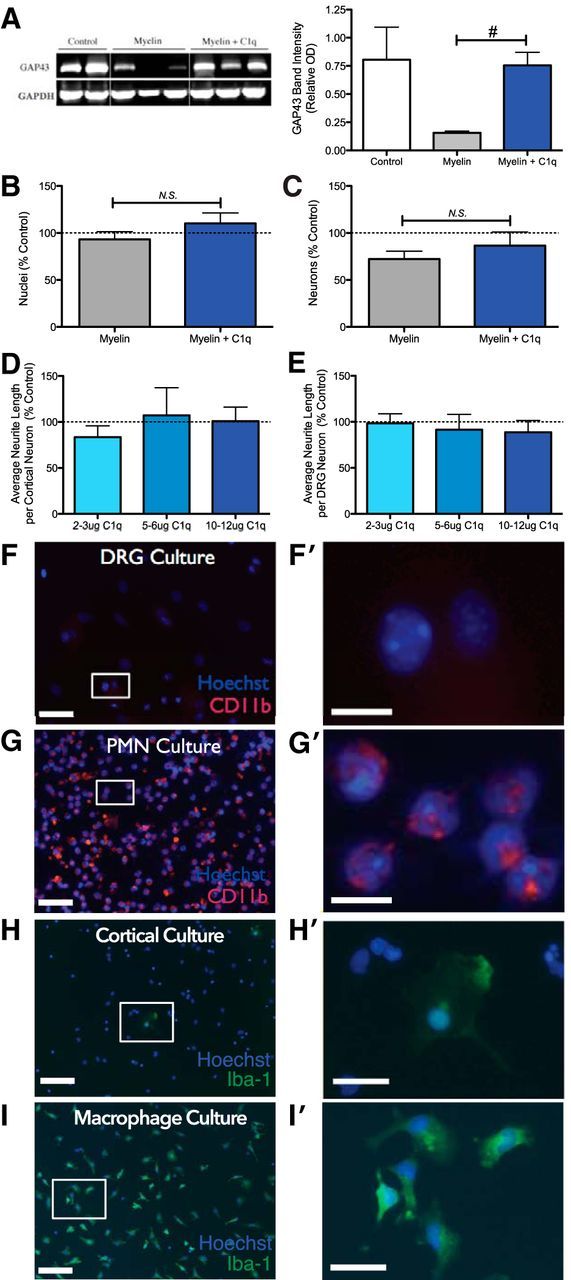
Rescue of neurite outgrowth on myelin substrate by complement C1q involves modulation of GAP43 mRNA expression in the absence of CD11b+ inflammatory cells and without affecting cell number. A, Representative RT-PCR image (left) and quantification (right) for GAP43 mRNA demonstrate an increase in GAP43 band intensity (optical density) relative to loading control in cortical neurons cultured for 1 DIV with myelin + C1q versus myelin alone. B, C, The effects of C1q on growth are unlikely to arise from a change in cell viability because there are no differences in total cell number (B; Hoechst+) or neuron number (C; β-tubulin III+) between myelin and myelin+C1q cultures. D, E, In the absence of myelin mediated growth inhibition, C1q does not affect neurite length in primary cortical cultures (D) or DRG cultures (E). Values are graphed as percentage of control wells [mean ± SEM for 5 (D, E) or 6 (B, C) independent experiments). F, G, Inflammatory cells are not likely to be important to the mechanism for C1q growth modulation because primary dissociated DRG neuron cultures (F) do not contain CD11b+ cells (G; PMN alone adherent culture is positive control for comparison), and H, dissociated cortical neuron cultures contain very few Iba-1+ cells by immunocytochemistry (I; macrophage alone adherent culture is positive control for comparison). Scale bars: F–I, 50 μm; F′, G′, H′, I′) = 200 μm. For A, n = 2, #p < 0.05 t test; for B and C, n = 3 each, N.S. p > 0.05 t tests; for D and E, n = 3 each, N.S. p > 0.05 one-sample t tests vs 100%.
Figure 3.
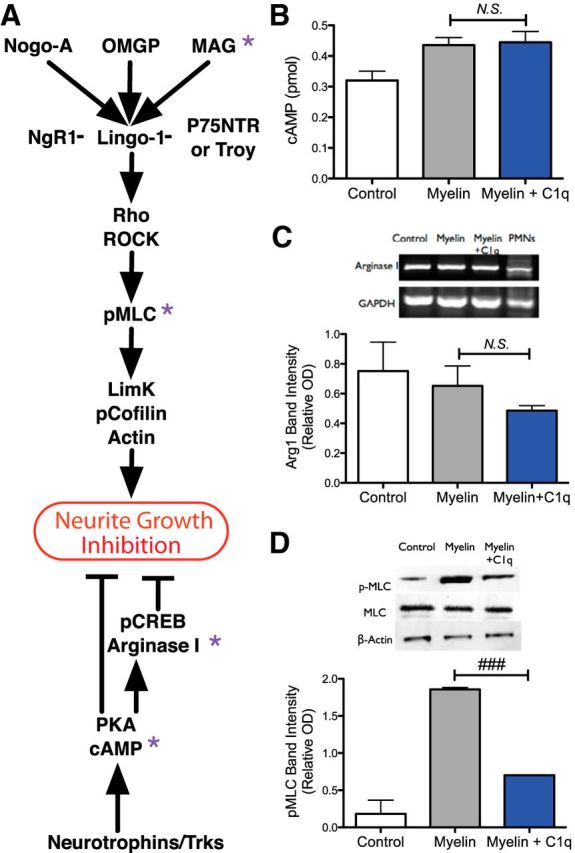
Complement C1q reduces the phosphorylation of myosin light chain, but does not affect cAMP level or arginase I mRNA expression in neurons grown on myelin. A, Diagram describing myelin-associated inhibition in neurons and growth promoting pathways known to overcome growth inhibition. Specific points within these pathways were tested for C1q-mediated modulation (Figs. 3 and 4), and these targeted proteins/molecules are noted by purple asterisks. B, cAMP levels were determined by competitive immunoassay of 2 DIV primary cortical neuron lysates and demonstrated no difference between neurons plated on myelin versus myelin + C1q. C, Arginase I mRNA expression by RT-PCR in 1 DIV cortical neurons was similar for neurons grown on myelin versus myelin + C1q. D, Western blot for pMLC from 2 DIV cortical cultures demonstrated reduced p-MLC in the myelin+C1q condition versus myelin alone. For B–D, n = 2 each, mean ± SD; for B and C, N.S. p > 0.05 t test; for D, ###p < 0.001 t test.
Dissociated primary cortical cell cultures for neurite outgrowth and signal cascade assays.
For Figures 1, 2, and 3, myelin substrate was plated and adsorbed as described above. C1q or C3 was then added to appropriate wells (Quidel, 250 μg/ml, 95 μl/well). After 2 h of incubation, wells were washed once to remove unbound protein before plating dissociated neonatal rat cortical cells. Cortical cells were isolated from cortices of Sprague Dawley rat pups at postnatal day 0 (P0) to P4. The cerebral cortex was minced and resuspended in neurobasal (NB) medium (Invitrogen) containing papain (Worthington, 2 mg/ml), and incubated for 30 min at 37°C with agitation. Cell solution was triturated in NB medium containing 10% FBS and then filtered, pelleted, and resuspended in NB medium. A high-density 1:1 Optiprep (Accurate Chemical and Scientific) and 10 mm MOPS (Sigma) buffer solution was diluted with NB medium to make 4 solutions of predetermined densities, which were layered to form a density gradient (Bagamery et al., 2005). The cell solution was layered on top of the density gradient and centrifuged at room temperature for 15 min at 1900 rpm (Beck et al., 2010). The neuronal layer was isolated and diluted (50,000 cells/ml, 0.2 ml/well) with NB medium containing B-27 supplement (Invitrogen, 1:50), Glutamax (Invitrogen, 1:200), and penicillin-streptomycin (Invitrogen, 1:100). Cells were plated in each well of control, myelin only, myelin with C1q, or myelin with C3. Cells were incubated for 2 d before fixation with 2% paraformaldehyde, followed by immunocytochemistry and microscopic analysis.
Neurite outgrowth assay in dissociated primary dorsal root ganglia cell cultures.
MAG (R&D Systems, 7.5 μg/ml) was adsorbed overnight onto PLL-coated (50 μg/ml), 8-well Permanox chamber slides (Lab-Tek) for MAG inhibition over time experiments shown in Figure 4. The amino acid sequence for MAG is highly conserved (95%) between rats and humans (Spagnol et al., 1989). For C1q experiments in Figure 4, mouse C1q (a gift from Dr. Andrea Tenner, 5–15 μg/ml, 1–3 μg/well) or 8 mm HEPES buffer as control was incubated with MAG and adsorbed overnight before HEPES wash and cell plating. Preincubation of MAG and C1q did not affect the amount of MAG remaining bound on the wells after 48 h by ELISA (R&D Systems; data not shown). Dissociated adult mouse dorsal root ganglion (DRG) cells were plated on wells of control, adsorbed MAG, or adsorbed MAG and C1q. Adult (C57BL/6J) mice were killed and DRGs from both sides of lumbar and thoracic vertebrae were removed and treated with 0.5 mg/ml trypsin (Sigma) and 1 mg/ml collagenase (Sigma) for 20 min at 37°C. Cells were gently triturated in NB-A medium (Invitrogen) with 10% FBS (Invitrogen) and filtered through a 40 μm cell strainer, then pelleted and resuspended in NB-A with 2% FBS to 10,000 cells/ml (0.2 ml/well). The parameters for MAG concentration, DRG plating density, and time in culture were determined in a series of pilot experiments. Experiments either without sufficient outgrowth in control wells for accurate analysis by Bitplane Imaris Software (<10 mm per image) or without evidence of neurite growth inhibition in MAG-treated wells were excluded from analysis. After 2 d, cells were fixed with 2% paraformaldehyde, followed by immunocytochemistry and microscopic analysis.
Figure 4.
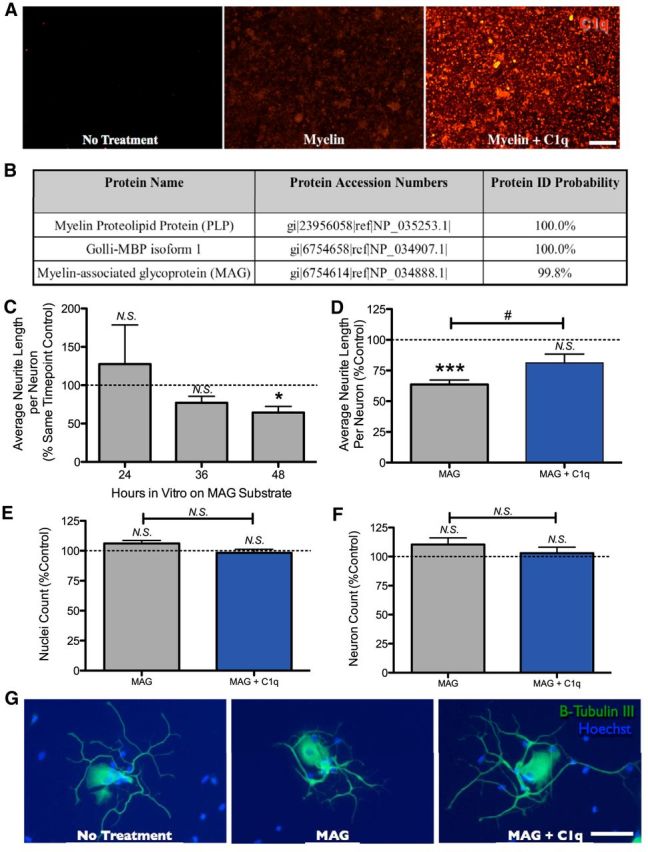
Complement C1q associates with MAG and reverses outgrowth inhibition of DRG neurons on MAG. A, Wells with untreated buffer control, adsorbed myelin then buffer incubation, or adsorbed myelin followed by C1q incubation were washed and then immunolabeled for C1q (red). Positive immunolabel in the myelin + C1q condition suggests binding between C1q and myelin. B, Immunoprecipitation using a C1q trap for MudPIT analysis identified PLP, Golli-MBP, and MAG as probable C1q-binding partners. The novel interaction between C1q and MAG is especially interesting because MAG is a known inhibitor of axonal growth. C, Plating of primary DRG cells on dried MAG reduces the average neurite length per neuron at 48 h in vitro (percentage of control wells, mean ± SEM for three independent experiments). D, DRG neurons were grown on wells with untreated buffer control, dried MAG, or dried MAG + C1q. Quantification of average axon length per neuron (mean ± SEM for five independent experiments) revealed significant inhibition of neurite outgrowth for neurons grown on MAG and increased neurite outgrowth for neurons on MAG + C1q versus MAG alone, which was similar to control. E, F, No difference in nuclei number (E; Hoechst+) or neuron number (F; β-tubulin III+) was detected between MAG and MAG + C1q treatments or relative to control. G, Representative images of DRG neurons grown on either: no treatment, dried MAG, or dried MAG+C1q, and immunolabeled for β-tubulin III (green) with Hoechst counterstain (blue). Scale bars in A and G, 100 μm. For C, n = 3, *p < 0.05 one-sample t test vs 100%; for D, n = 5, ***p < 0.001 one-sample t tests vs 100%, #p < 0.05 t test vs MAG; for E and F, n = 5 each, N.S. p > 0.05 t test vs MAG, N.S. p > 0.05 one-sample t test vs 100%.
Immunocytochemistry and quantification.
Fixed cell culture wells were washed with PBS and PBS washes were performed between each step described. After blocking (30 min; 3% BSA, 0.05% Tween 20), cells were immunolabeled using rabbit anti-β-tubulin class III (Covance, 1:1000, 1 h) primary antibody to label a neuronal microtubule protein, followed by anti-rabbit IgG Alexa Fluor-488 (Invitrogen, 1:1000, 1 h) secondary antibody for visualization. Hoechst 33342 (10 μg/ml, 30 min) was used as a nuclear stain. After final PBS washes, slides were coverslipped using Fluoromount G (SouthernBiotech). Images (100× or 200×) of Hoechst and β-tubulin III were captured on either an Olympus IX71 or a Zeiss Axio Imager.M2 microscope and used to quantify neurite length. Counts for number of β-tubulin III+ and Hoechst+ cells were determined either by hand or using a custom protocol in Bitplane Imaris (version 7.3.1 software) and visually checked for errors. Length of the longest neurite was determined using ImageJ software by individually measuring the longest neurite for each β-tubulin III+ cell with growth. Lengths were averaged per well (2–4 wells per condition per experiment). Total neurite length per well was analyzed using a custom protocol in Bitplane Imaris (version 7.3.1 software). Average neurite length per neuron was calculated by dividing total neurite length by #β-tubulin III+ cells for each well (>100 β-tubulin III+ cells/well). At least 3 (up to 6) independent experiments were combined for figures and statistics (each culture condition represents data collected from at least 800 neurons—often >2000).
Assays of signaling products and cascades: cAMP assay.
The cAMP level in mouse cortical cell lysates at 2 d in vitro (DIV) was measured using a competitive immunoassay according to the manufacturer's instruction (BIOMOL International). For growth-associated protein 43 (GAP43) and arginase I RT-PCR, mRNA was isolated according to the RNeasy Mini Kit (Qiagen) from 1 DIV control mouse cortical cultures or cultures grown on myelin or myelin with bound C1q or C3. For each RT-PCR, 0.25 thermal cycler conditions of 30 min at 50°C and 15 min at 95°C, followed by 30 repeated cycles of: 1 min at 95°C, 1 min at 55°C, and 1 min at 72°C, and ended with 10 min at 72°C. RNA quality was verified before use (260/280 ratio >1, 1.3–2.7 range). GAP43 rat primers (Bareyre et al., 2002) were as follows: GAP43F CAG CCA CCA GCC CTA AGG; GAP43R TCA, GTG, ACA, GCA, GCA, GGC. Arginase I rat primers were as follows: ARG1F GTC CCC AAT GAC AGC CCC; ARG1R CTT TTC TTC CTT CCC AGC AG. GADPH rat primers were as follows: TGA-AGG-TCG-GTG-TCA-ACG-GAT-TTG-GCCAT-GTA-GGC-CAT-GAG-GTC-CAC-CAC. N = 2 each. For Western blots, mouse cortical cell cultures (1 DIV) were homogenized in 80 mm Tris (pH 6.8, containing 0.1 m dithiothreitol and 70 mm SDS), extracts prepared, protein concentration determined, and probed using rabbit anti-phospho-myosin-light-chain (Millipore, p-MLC, 1:50), mouse anti-MLC (Sigma, 1:500), and mouse anti-β-actin (Sigma, 1:500) in Tris-buffered saline containing 3% powdered dry milk and 0.05% Tween 20. Antibody was detected by enhanced chemiluminescence (GE Healthcare; N = 2). Quantification of band intensity was performed using ImageJ.
Immunoprecipitation and multidimensional protein identification technology analysis.
Binding of C1q to specific myelin components was investigated using the precipitated C1q-immunobound product on G-protein Sepharose. C1q was incubated with myelin for 2 h in solution, before goat anti-human-C1q antibody (Quidel, 1:200) was added and incubated with agitation for 2 h. GammaBind G-protein Sepharose (GE Healthcare) was added and agitated at 4°C for 1 h. Samples were centrifuged for 1 minute at 6000 rpm and the pellet was washed 3×. Control immunoprecipitation samples with anti-C1q antibody but without C1q protein (myelin alone) were also included. Analysis of immunoprecipitation samples was performed at the University of Maryland–Baltimore by Dr. Austin Yang. Briefly, immunoprecipitation samples were subjected to tryptic digestion followed by multidimensional protein identification technology (MudPIT) LC-MS/MS incorporating the use of a nanoflow HPLC system and hybrid linear ion trap LTQ-Orbitrap mass spectrometer to permit the enhanced resolution of individual components of complex peptide mixtures, as described previously (Cripps et al., 2006).
Live imaging axon turning assay in dissociated primary DRG cell cultures.
Dissociated DRG cultures were prepared as described above and plated onto PLL-coated (50 μg/ml) 8 well coverglass chamberslides (Lab-Tek) for 44–48 h incubation before the start of the live imaging experiment. The live imaging equipment available in our laboratory necessitated the development of a substantially modified turning assay from published methods, which usually use a picospritzer to deliver small volumes of agents in highly localized areas. Our assay uses agarose cubes to establish spatial gradients of proteins over time, without the use of a specialized injection system like the picospritzer. For cube production, molecular grade agarose (Bio-Rad) was added to NB-A medium and autoclaved, transferred to a conical tube, and placed in a 55°C water bath. A mixture of 400 μl of agarose (1.2% final concentration) and protein treatment [40 μg of MAG (R&D Systems), 240 μg of C1q (Quidel), or 40 μg of MAG + 240 μg of C1q] was triturated carefully in a 55°C water bath to avoid agarose solidification. Next, the mixture was added to a 10 mm × 8 mm × 11 mm mold, cooled for 1 min, transferred to a Petri dish for sectioning into 4 3 mm cubes (each 100 μl of cube contained ∼10 μg MAG and/or 60 μg of C1q), and stored at 4°C. Cubes were produced the day before or the day of imaging. Parametric experiments were conducted initially to determine protein and agarose concentrations, cube size, and timing. These included experiments using dyes to characterize the timing and intensity of the treatment gradient produced by the agarose cube. Live imaging was done using the Olympus FV-10i version 1.2 Fluoview system. The FV10i allows for maintenance of a stable environment of 37°C and 5% CO2. CO2 concentration was maintained by a Tokai Hit gas mixer with a setting of 9.5. The FV10i captures a broad, low resolution “mapimage” image of the well plus choice of regions of interest (ROI) images. Six ROIs were chosen per well for simultaneous imaging and each ROI chosen contained at least one neuron with a visible neurite. Both large and small DRG cells were chosen for imaging. Each ROI was imaged using a z-stack of 3 1 μm slices in phase contrast with a 559 nm laser at 4.2% using 100× optical magnification plus 5× digital zoom. Image acquisition for all ROIs took 2 min 7 s, and this sequence was repeated 15 times for a total time of 32 min, constituting the control imaging period for initial axon growth. Next, a 3 mm cube of 1.2% agarose with medium, MAG, MAG + C1q, or C1q was added to either the top left or bottom left corner of the well, with the experimenter blinded to treatment. The FV10i system was left to reacclimate for 5 min and imaging continued as before for an additional 45 min. This procedure was repeated for all wells. When tested, the amount of time spent in the FV10i before treatment and imaging of a particular well did not appear to affect the growth cone response to MAG, as neurons in three wells tested several hours apart each displayed mean repulsive axon turning (data not shown). Live imaging experiments typically lasted 14–16 h. For quantification and analysis, upon imaging completion, FV10-ASW (Olympus version 2.1) software was used to evaluate neurite growth during the control imaging period (t = 32 min). If a neurite did not grow at least 5 μm during the first 32 min of imaging, it was excluded from analysis. Additional exclusions included: neurites that were pulled by another cell; neurites that grew into the path of another cell, neurite, or debris; and neurites or cell bodies that were covered by an agarose cube. Next, images were exported to individual TIF files for each z and t position and used to create overlays of the t position in Adobe Photoshop CS3 software to determine trajectory of neurite growth from one time point to the next. The most in-focus z image was chosen for the control image at t = 0 min. The final image captured during the control period at t = 32 min was overlaid using the same z level, followed by the final treatment image at t = 82 min. After aligning images, 3 pixel dots were marked on the base of the growth cone for each time point. Angle and length quantification were completed using ImageJ software. Neurite length was measured from the center of the red dot in the first control image at t = 0 min to the red dot in the treatment image at t = 82 min using the lines tool (measurement scale = 4.019 pixels/μm). The angle tool in ImageJ was used to quantify growth cone turning after treatment. The trajectory of the control period growth, created by drawing a straight line from the t = 0 min to t = 32 min red dots, and the trajectory of the treatment period growth, created by drawing a straight line from the t = 32 min to t = 82 min red dots, were overlaid and the angle between the two trajectories was measured. The resulting angle is reported as the growth cone turning angle (∡). To determine whether a neurite was attracted or repelled by a gradient cue, a map image of the well was used to determine the position of the neurite in relation to the cube. Dependent on the direction of gradient flow, the neurite was determined to be repelled or attracted to the guidance cue, which was denoted by negative and positive values, respectively (see Figure 5A for details). Because ImageJ allows for more precise length measurements than the FV10-ASW software, further exclusions were made during this step for neurites that grew <5 μm during the initial control period. In addition, neurites that grew <1 μm during the treatment period were excluded from final analyses. No differences in length were observed between treatment groups compared with control. This paradigm did not allow us to test >2–3 treatments per experiment, so each experiment was balanced with the appropriate control. This design, along with using imaging sites with multiple analyzed growth cones and postimaging exclusions, produced numbers that were sufficient for statistical analysis and consistent with the literature, but differed between treatment groups. For each treatment, two to four independent experiments with two to 22 neurites per experiment were combined for statistical analysis (n = 29 control, n = 42 MAG, n = 51 MAG + C1q, n = 30 C1q).
Figure 5.
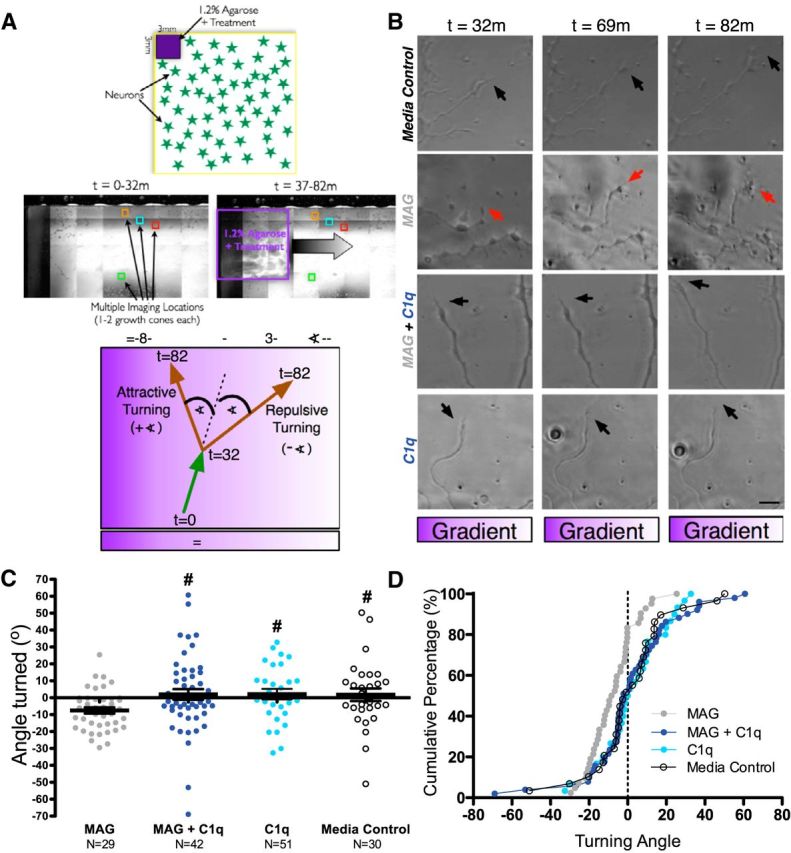
C1q abolishes repulsive turning of DRG growth cones in response to MAG. A, Diagram describing method for analysis of neurite turning from time lapse images in response to local gradient of protein diffusing from an agarose cube. Top diagram and middle low-magnification stitched images depict position of agarose treatment cube relative to analyzed growth cones, while bottom diagram depicts calculation of growth cone turning angle (∡) and sign assignment (+, attraction; −, repulsion) in relation to gradient. B, Representative time lapse images [end of pretreatment (t = 32 min), 37 min after treatment (t = 69 min) and 45 min after treatment (t = 82 min), left to right] from neurons treated with a gradient of: agarose control (top row), MAG (second row), MAG + C1q (third row), and C1q (bottom row), with the gradient oriented left (high concentration) to right (low concentration) in each image. Arrows mark the growth cone of interest. C, Quantification of growth cone turning angle ∡ (+, attraction; −, repulsion) revealed that whereas agarose control did not cause turning (mean ± SEM), MAG induced repulsive turning, which was significantly different from control. MAG + C1q treatment completely rescued neurites from MAG-mediated repulsion to control levels with no significant turning. D, Cumulative distribution plot of turning angles per treatment group, with each point representing the percentage of growth cones on the y-axis with ∡ ≤ the x-axis angle values. Scale bar in B, 10 μm. For C and D, n = 29–51 axons per condition, ##p < 0.01 Krusal-Wallis ANOVA with #p < 0.05 Dunn post test vs MAG, *p < 0.05 one-sample t test MAG vs 0°.
Dorsal column transection with sciatic nerve conditioning lesion.
Male C1q-deficient mice, originally generated by Marina Botto via homologous recombination in the C1qa gene (Botto, 1998), were backcrossed onto the BUB/BnJ background by Charles River Laboratories (MAX-BAX) as described previously (Galvan et al., 2008). The BUB/BnJ strain was chosen because total hemolytic complement activity in males of this strain is closest to those in rats and humans, whereas many common mouse strains exhibit much lower levels (Galvan et al., 2008). Accordingly, BUB/BnJ mice exhibit hemolytic complement activation in CH50 assays after SCI, which is abolished in C1q KO BUB/BnJ mice (Galvan et al., 2008). The WT mice used in this study were littermates of the C1q-deficient mice. At time of SCI, all mice were 4–7 months old. All surgical procedures were performed using sterile techniques with mice under isofluorane anesthesia. Dorsal column transection was performed on 21 male mice: 8 C1q KO and 13 C1q WT. The spinal cord was exposed at thoracic level T8 by dorsal laminectomy, followed by bilateral dorsal column transection using marked microdissection scissors (spinal level was confirmed as T6, T7, T8, or T9 by spinal root during tissue harvest). For 8 C1q KO and 9 C1q WT mice, sciatic nerve transection was performed immediately after the SCI. Blunt dissection to the left sciatic nerve at midthigh level was followed by ligature placement and sciatic nerve transection distal to the ligature. For the remaining 4 C1q WT mice, blunt dissection was done but without sciatic nerve transection. After wound closure, mice were monitored and maintained on water-jacketed heating pads at 37°C while recovering from anesthesia. A second surgery was conducted 7 d after the first, during which the left sciatic nerve transection was performed as above, but proximal to the first transection (Neumann et al., 2005). The same four mice again received sham sciatic nerve surgeries. Mice were maintained on acidified water and antibiotics and treated for pain as necessary. Manual bladder expression was performed 2–3×/d. Five days before tissue collection, the left sciatic nerve was exposed again and 1.5 μl of 10 mg/ml cholera toxin β subunit (CTβ; List Biological Laboratories), a trans-ganglionic tracer, was injected into the proximal nerve section using a pulled glass capillary tube pipette. For tissue collection, mice were killed 6 weeks after the initial surgery by lethal dose of sodium pentobarbital and cardiac perfusion of saline followed by 4% paraformaldehyde. Spinal cord segments T4–T9 (identified by spinal root) and L1–L6, as well as brain and left sciatic nerve, were harvested, sunk in 4% paraformaldehyde/10% sucrose, and flash-frozen with isopentane. A sliding microtome was used to section frozen thoracic spinal cord (50 μm horizontal), lumbar spinal cord (50 μm horizontal), and brain (30 μm coronal) from each mouse. For immunohistochemical analyses of tracer-labeled regenerated axons, a series of every second section of the T4–T9 spinal cord segments (11–16 sections per mouse, 100 μm apart) was processed for CTβ immunoreactivity, with the starting section number chosen for each mouse at random. Individual sections were washed, peroxidases inactivated (3%H2O2/10% methanol), permeabilized (Triton X-100), blocked (BSA and donkey serum), and incubated in goat anti-CTβ (List Biological Laboratories, 1:8000) for 15 h. This was followed by 1 h incubation with each biotinylated donkey anti-goat IgG Fab (Jackson ImmunoResearch, 1:500), then avidin-biotin complex (Vectastain; Vector Labs), before visualization using 3,3′-diaminobenzidine enhanced with nickel chloride to produce black color. Every sixth section through the medulla (7–12 sections/mouse, 180 μm apart) was immunolabeled using this same procedure to exclude any animals with incomplete SCI by the presence of spared fibers in the gracile nucleus. To exclude mice with absent or insufficient tracer label, every third section of the lumbar spinal cord (6–9 sections/mouse, 150 μm apart) was processed for CTβ immunoreactivity. In addition, the amount of lumbar tracer was compared between genotypes in these spinal cord sections by quantifying the percentage of all sections within the full tissue set that contained any tracer immunoreactivity. To generate images of SCI scar morphology, individually chosen horizontal injury sections were immunolabeled using a similar protocol, except with rabbit anti-AQP4 (Sigma, 1:20,000) and rabbit anti-GFAP (Dako, 1:40,000) primary antibody coincubation, and anti-rabbit IgG F(ab) secondary antibody (1:500; Wanner et al., 2013). Negative tissue controls and omission of primary antibody were used to confirm the specificity of the primary and secondary antibodies.
For tissue analyses, microscopy was completed on an Olympus BX60 microscope. For reconstruction images, for each mouse, injury sections labeled for CTB tracer (full 1:2 section sampling) were imaged (100×) and then each image was manually traced for CTB label and the transparent traced image files were overlaid (using injury epicenter, marked tissue ends, and tissue morphology for alignment) in Adobe Photoshop CS3 software to produce reconstructions of axon growth for each mouse. Length of the longest axon was determined by visually scanning each spinal cord section (200×-400×; full 1:2 section sampling; MicroBrightField version 9.2 software), and measuring the rostrocaudal length from the center of the injury to the most rostral axonal tracer label in each animal. The center of the injury was set to 0 μm, with rostral positions reported as positive and caudal as negative. Lesion volume was determined using the unbiased, systematic random sampling of stereology, with the Cavalieri probe (MicroBrightField version 9.2 software; 40× - 100×; 1:2 section sampling through entire lesion). Using a 100 μm grid, Gunderson CE m = 1 ranged from 0.022 - 0.069 for all mice. Axon turning was quantified by first drawing a center line along the rostrocaudal axis of the spinal cord section (400×; 1:2 section sampling through entire lesion; MicroBrightField version 9.2 software). Next, a series of four parallel lines, 100 μm apart, were drawn on either side of the center line. Every intersection of traced axons and the drawn lines (−400, −300, −200, −100, +100, +200, +300, +400 μm) within the injury site was counted and total intersections were summed for each mouse. An 800 μm spread was chosen for turning analyses in all mice because the width of the smallest complete injury was between 800 and 900 μm. To exclude mice with incomplete dorsal column lesions, medulla sections were checked for evidence of the tracer by manual scanning (100–400×) and any mouse with CTβ immunoreactivity was excluded (6 excluded mice: 2 C1q KO, 2 C1q WT, and 2 WT without sciatic nerve cut). To exclude mice with poor tracer injections or transport, lumbar sections were manually scanned (100–400×) for tracer immunoreactivity and all mice without distinct, intense black axon labeling were excluded from all analyses (4 excluded mice: 2 C1q KO, 1 C1q WT, and 1 WT without sciatic nerve cut). Final animal numbers for histological analysis were as follows: C1q WT, n = 4; C1q KO, n = 6; WT without conditioning, n = 2.
Dorsal column transection with biotinylated dextran amine tracing of corticospinal tract axons.
Male C1q KO and C1q WT mice for these experiments were acquired from littermate groups of the same C1q-deficient mouse line described above for the dorsal column transection with sciatic nerve conditioning lesion study. A total of 16 C1q KO and 13 C1q WT mice, 7 to 16 weeks of age, underwent laminectomy at T8 under isofluorane anesthesia and aseptic technique (confirmed laminectomy level for all mice at T7, T8, or T9 during tissue harvest). For n = 8 C1q WT and n = 10 C1q KO mice, bilateral transection of the dorsal spinal cord was performed using marked microdissection scissors. After application of gel foam and suturing of muscle and skin, mice were monitored and maintained on water-jacketed heating pads at 37°C until they recovered from anesthesia. Mice were maintained on acidified water and antibiotics and treated for pain as necessary. Manual bladder expression was performed 3×/d. Biotinylated dextran amine (BDA, 10,000 MW, 100 mg/ml in dH2O; Invitrogen) injections were performed into the right sensorimotor cortex of all mice at 27–28 d after injury. Briefly (Steward et al., 2008), mice were situated on a stereotax under isofluorane anesthesia and the skull was exposed. A trough was drilled 1 mm right of midline to encompass all 4 injection coordinates: bregma +0.5, −0.2, −0.5, −1.0 mm. A total of 1.6 μl of BDA was injected, with 0.4 μl/injection site as follows: penetrated cortex with Hamilton syringe to 0.5 mm depth, waited 1 min, injected 0.2 μl of BDA, waited 2 min, injected 0.2 μl, waited 3 min, withdrew needle, moved to next injection site, and repeated. During the study, 2 injured mice (1 C1q WT and 1 C1q KO) died from urinary complications and were excluded from analysis. Mice were killed 6 weeks after the initial surgery (2 weeks after BDA injection) by lethal dose of sodium pentobarbital and cardiac perfusion of saline followed by 4% paraformaldehyde. Spinal cord segments C5–T1, T6–T9 (identified by spinal root), T10, and brain were harvested, sunk in 4% paraformaldehyde/10% sucrose, and flash-frozen with isopentane. A sliding microtome was used to section frozen C5–T1 (35 μm coronal), T6–T9 (35 μm parasaggital), T10 (35 μm coronal), and brain (35 μm coronal) tissue from each mouse. For evaluating corticospinal tract (CST) midline crossing, sprouting, and animal exclusions, visualization of BDA in sectioned, mounted tissue was accomplished by inactivation endogenous peroxidases, permeabilization, blocking, then overnight incubation in avidin-biotin complex (Vectastain; Vector Labs), and 3,3′-diaminobenzidine (+NiCl) reaction. For assessment of lesion size, parasagittal thoracic injury sections were immunolabeled for fibronectin. Tissue was processed free floating by peroxidase inactivation, permeabilization, protein blocking, overnight room temperature incubation with rabbit anti-fibronectin IgG (Abcam), additional permeabilizing and blocking washes, 1 h biotinylated F(ab) fragment anti-rabbit secondary antibody (Jackson Immunoresearch) incubation, 1 h avidin biotin-complex reaction, tissue mounting, and finally visualization with 3,3′-Diaminobensidine (+NiCl). For tissue analyses (see Fig. 8A), for C5-T1 tissue, every 12th section (420 μm apart, ∼12/mouse) was evaluated for BDA-crossing midline crossing fibers by drawing a line though the central canal separating the left and right sides of the spinal cord, and counting the number of axons in the gray matter intersecting this line using an Olympus BX10 microscope (200×) and MicroBrightField version 10.5 software (midline axons crossings [mean/section]). In addition, every 12th section was assessed for total length of axon sprouting in the gray matter ipsilateral to the traced dorsal corticospinal tract (dCST) by stereology with the spaceballs probe (sprouting length [mm/section]; MicroBrightField version 10.5 software; 600×; 18 μm hemisphere radius, 250 μm × 250 μm grid size, Gunderson CE m = 1 range 0.04–0.19). For both analyses, individual section counts were summed for each mouse, then either used raw or normalized to BDA labeling intensity (measured for each mouse by either pixel intensity or pseudocounts of BDA label within the dCST). This normalization did not markedly reduce variability within groups nor increase the detection of differences between groups and is therefore not shown except for validation (BDA+ dCST axon count). To analyze the pattern of axon sprouting into gray matter laminae, spatial data (hits and contours) were exported from the completed spaceballs probe runs and overlaid using Adobe Photoshop CS3 software onto diagrams of mouse coronal spinal cords with labeled laminae. Laminae diagrams from C4–T3 were obtained from the Christopher and Dana Reed Foundation website (http://www.christopherreeve.org/site/c.ddJFKRNoFiG/b.4427053/k.F400/Spinal_Cord_Atlas__Introduction_and_Mouse_Spinal_Cord.htm), carefully matched to each previously drawn contour based on shape and sequential section number, and used to manually count the number of previously recorded axon hits within each lamina (sprouting into lamina X [% total gray matter axons] or sprouting by lamina [%]). Data for each lamina is presented as the percentage of total counts in all laminae within each mouse and is therefore already normalized for interanimal differences in axon tracing. For thoracic injury sections, lesion volume was defined using fibronectin label and morphological tissue changes and was quantified in 1:6 section sampling by stereology using the Cavalieri probe in StereoInvestigator software (MicroBright Field version 10.5 software), with 100 μm grid spacing at 200×. For brain tissue, every 12th section (420 μm apart, ∼15/mouse) was visually inspected (100×) for BDA label and, in every mouse, some BDA was detected in sensorimotor cortex, ipsilateral internal capsule, ipsilateral cerebral peduncle, and ipsilateral pyramidal CST. Less than five axons were detected per section of each mouse in the contralateral pyramidal CST and labeling of brainstem nuclei or other tracts was never observed, as expected with accurate tracer injections specifically labeling CST from a single hemisphere. For T10 tissue, every sixth section (210 μm apart, four/mouse) was assessed (200×) for BDA in left dCST. Sham-injured mice should have tracer present at T10 if transport was good, whereas dorsal column transection-injured mice should not have any BDA labeled axons in T10 dCST if lesion of dCST at T8 was complete. A single sham C1q KO mouse was excluded due to BDA absence at T10 and a single SCI C1q WT mouse was excluded due to absence of BDA in cervical sections (although BDA was present in medulla). No instances of BDA in the dCST caudal to the lesion were observed in mice that received SCI, indicating complete dCST injuries, and therefore no exclusions were made on this basis. Final animal numbers for histological analysis were as follows: C1q WT sham, n = 5; C1q WT SCI, n = 7; C1q KO sham, n = 5; C1q KO SCI, n = 9.
Figure 8.
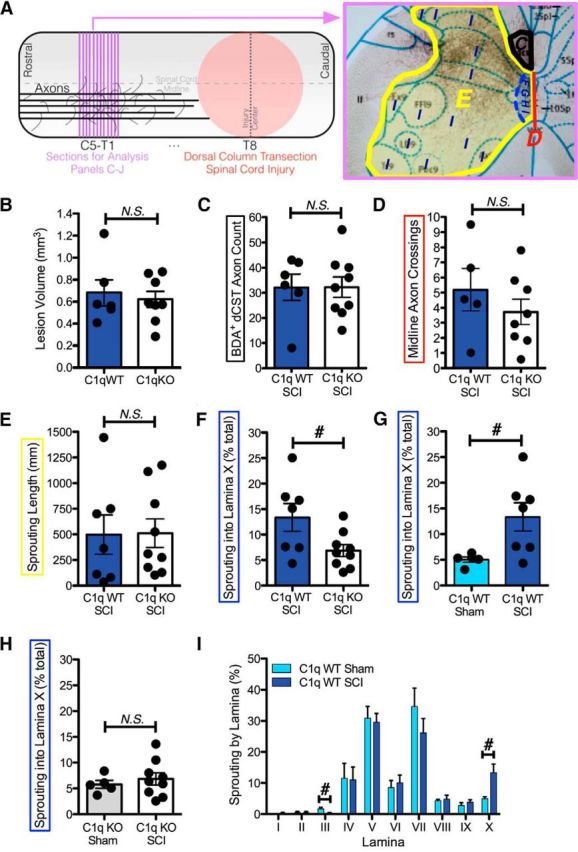
Complement C1q promotes CST axon sprouting into lamina X without affecting lesion volume, total gray matter axon counts or length, or midline axon crossing. A, Diagram depicting thoracic SCI paradigm and transverse sections used for quantification of axon sprouting. The BDA-traced unilateral corticospinal tract is immunolabeled in black and the dorsal tract, used for total BDA labeling comparison between genotypes, is outlined in black. In addition, the areas used for the midline crossing, total ipsilateral sprouting length, and lamina-specific sprouting analyses presented in D–I are shown in red, yellow, and blue, as indicated. B, Lesion volume as estimated by Cavalieri stereology probe is not different between C1q KO and C1q WT mice. C, The BDA label of the dorsal corticospinal tract is similar between genotypes in SCI mice. D, The number of counted intersections for BDA-traced CST axons with the midline of the gray matter (mean/section) was similar for both genotypes of SCI mice. E, The estimated sprouting length (mm/section) of BDA-labeled CST fibers in the ipsilateral spinal cord gray matter was also not different between C1q WT and C1q KO SCI mice. F, CST sprouting into lamina X (as a percentage of total sprouting) after SCI is reduced in C1q KO mice. G, In the presence of C1q, SCI induced increased CST sprouting into lamina X (vs sham). H, This lamina-specific sprouting effect was lost in C1q KO mice. I, Proportion of sprouting by lamina analysis in C1q WT mice revealed that the SCI-induced increase in localized sprouting was specific to lamina X. n = 7 C1q WT SCI, 9 C1q KO SCI, 5 C1q WT sham, 5 C1q KO sham (all mice had complete dCST lesions, mice with evidence of insufficient tracer immunoreactivity were excluded from analysis: excluded Ns = 1 C1q KO sham, 1 C1q WT SCI). For B–E, and H, p > 0.05 t tests; for F, G, and I, #p < 0.05 t tests. All values are shown as mean ± SEM.
Statistical analysis.
See individual sections for details on number of: data points, wells, independent replicates, or mice for each experiment. For the myelin and MAG morphological assays, a one-sample t test was used to compare the normalized treatments to control (100% fixed value). In addition, statistical comparisons between both complement treatments and myelin in the myelin morphological assay were conducted using one-way ANOVA with Dunnet post test, and differences between MAG and MAG + C1q treatment groups in the MAG morphological assay were detected using a two-tailed t test. Outliers in technical replicates were detected using Grubb's outlier test and outlier wells were removed from analysis. Signaling cascade comparisons in cells cultured with either myelin or myelin + C1q were conducted using two-tailed t tests. For the live imaging turning assay, all treatment groups were compared using Kruskal–Wallis ANOVA (Song et al., 1998) and each group was compared with MAG by Dunn's multiple-comparisons test. Kruskal–Wallis is a nonparametric (ranked) statistical test and was chosen for this experiment because the comparison was between groups with uneven sample sizes and significantly different variances and with data that were not expected to be normally distributed, factors that would potentially invalidate the use of a parametric test. Statistical comparison of C1q KO versus C1q WT histology was performed using two-tailed t tests. Statistical significance was defined as p < 0.05 and all significant Student's one-tailed or two-tailed t tests are indicated by asterisks (*p < 0.05, **p < 0.01, ***p < 0.001); all significant one-sample t tests and Kruskal–Wallis ANOVAs are indicated by hashtags (#p < 0.05, ##p < 0.01, ###p < 0.001).
Results
Complement protein C1q influences neurite outgrowth on myelin in vitro
To test the influence of complement C1q on neurite growth in vitro, myelin was adsorbed onto PLL-coated wells. C1q was then added, incubated, and washed to remove unbound proteins before plating primary dissociated postnatal rat cortical neurons (Fig. 1). As controls, cortical neurons were also plated on wells with no myelin, myelin only, and myelin incubated with complement C3 as a control protein. As expected, neurons grown on myelin demonstrated reduced (**p = 0.006 one-sample t test vs control 100%) neurite outgrowth (Fig. 1B, 73 ± 6.5%). In striking contrast, C1q treatment increased (###p = 0.001 by one-way ANOVA, #p < 0.05 Dunnet post test vs myelin) neurite length on myelin (102 ± 7.0%) to control levels (p = 0.839 one-sample t test vs control 100%). We hypothesized that C3 would not affect neurite growth, primarily because C3 is only known to mediate effects through its cleavage products, C3a and C3b, and is not known to be active as a whole protein (Sahu and Lambris, 2001). Surprisingly however, C3 demonstrated an opposing effect to C1q, exacerbating neurite outgrowth inhibition (**p = 0.002 one-sample t test vs control 100%) on myelin (34 ± 3.1%) beyond myelin alone (##p < 0.01 Dunnet post test vs myelin). Interestingly, these C3 data demonstrate that the enhancement of axon growth by C1q on myelin is specific to this particular complement component.
Complement C1q rescues myelin growth inhibition by a mechanism associated with neurite growth and is independent of cell survival or direct effects on neurite length
GAP43 expression is upregulated in developing and actively growing or regenerating neurons (Woolf et al., 1990). To confirm the morphological results and establish whether C1q-mediated reversal of myelin inhibition was associated with the restoration of growth associated gene expression, GAP43 mRNA expression was assessed by RT-PCR for each culture condition (Fig. 2A). Primary cortical cells cultured on myelin demonstrated a trend (p = 0.077 one-tailed t test) for reduced GAP43 expression (band intensity relative to GAPDH = 0.16 ± 0.015 myelin, 0.81 ± 0.29 control), as predicted from the literature (Yang et al., 2010); in contrast, cells cultured on myelin with C1q (0.75 ± 0.12 band intensity relative to GAPDH) exhibited a significant increase (#p = 0.037 two-tailed t test) in GAP43 expression over myelin treatment, which was similar to buffer control-treated cells in the absence of myelin (p = 0.89 two-tailed t test, myelin + C1q vs control).
Crucially, if C1q increases cell or neuron number, the observed rescue of growth inhibition could be a secondary effect, reflective of a primary effect on survival or proliferation. However, cell count analysis did not reveal differences in Hoechst+ nuclei (Fig. 2B, 93 ± 8% vs 110 ± 11%, p = 0.244 two-tailed t test) or β-tubulin III+ neuron number (Fig. 2C, 72 ± 8% vs 87 ± 15%, p = 0.387 two-tailed t test) with C1q under these culture conditions. Alternatively, these data could result from a direct or indirect effect of C1q on neurite growth. However, treatment with C1q alone did not alter average neurite length in either cortical (Fig. 2D, p = 0.953, p = 0.827, p = 0.408, one-sample t tests vs 100% control) or DRG cultures (Fig. 2E, p = 0.430, p = 0.660, p = 0.906 one-sample t tests vs 100% control). In addition, immunocytochemical analysis revealed an absence of CD11b+ immunoreactivity in DRG cultures (Fig. 2F,F′, PMN-positive control culture is shown in 2G and G′), and a very small number (<0.5% total nuclei) of Iba-1+ macrophages/microglia in our cortical cultures (Fig. 2H,H′, macrophage-positive control culture is shown in Fig. 2I,I′), suggesting that indirect growth effects mediated through inflammatory cells are unlikely. Together, these data support a mechanism in which C1q interacts directly with a neurite growth protein or pathway.
Complement C1q increases neurite outgrowth through interference with a growth inhibitory signaling pathway in vitro
Myelin associated inhibitors exert growth inhibitory effects that involve direct interaction with receptors on neurons including the Nogo receptor (NgR) and coreceptors (Fig. 3A). Growth-inhibitory signal transduction of MAIs induces protein kinase C-dependent RhoA GTPase activation of Rho-associated coiled-coil-containing protein (ROCK) (Sandvig et al., 2004; Chaudhry and Filbin, 2007). Activation of Rho/ROCK drives the phosphorylation of several downstream signaling proteins that promote rearrangement the cytoskeleton, resulting in growth cone collapse and neurite outgrowth inhibition, including MLC (pMLC) (Amano et al., 1996). Importantly, activation of either transcription-independent or transcription-dependent growth promoting pathways, for example, via neurotrophins, is sufficient to overcome MAI-induced growth inhibition (Cai et al., 1999; Neumann et al., 2002). Transcription-independent reversal of MAI signaling is mediated by upregulation of cAMP and PKA, which antagonize activation of RhoA GTPase and its downstream cytoskeletal effectors (Cai et al., 1999; Chaudhry and Filbin, 2007). Further, transcription-dependent reversal of MAI signaling downstream of cAMP additionally requires PKA, CREB activation, and subsequent transcription of arginase I, which regulates polyamine synthesis and neurite outgrowth (Lange et al., 2004; Deng et al., 2009).
Accordingly, C1q-mediated neurite growth increase in the presence of MAI could reflect enhancement of a neurite growth-promoting pathway or, alternatively, interference with a growth inhibitory pathway. To test these hypotheses, we selected cAMP and arginase I as markers of the transcription-independent and transcription-dependent growth promoting cascades (respectively) and pMLC as a marker of the growth-inhibiting signaling pathway (Fig. 3A). After the same growth assay paradigm as in previous experiments, culture lysates from control, myelin, and myelin + C1q culture conditions were assessed for cAMP production by competitive immunoassay (Fig. 3B). Similarly, arginase I expression was determined by RT-PCR (Fig. 3C). No differences in cAMP (p = 0.838 two-tailed t test, 0.435 ± 0.025 pmol/100 μl of myelin vs 0.445 ± 0.035 pmol/100 μl of myelin+C1q) or arginase I (p = 0.352 two-tailed t test, band intensity relative to GAPDH = 0.65 ± 0.13 myelin vs 0.49 ± 0.033 myelin+C1q) were detected between myelin and myelin + C1q cultures. In contrast, Western blot analysis (Fig. 3D) demonstrated a reduction (###p = 0.0005 two-tailed t test) in pMLC in cultures with myelin + C1q (band intensity relative to β-actin = 0.70 ± 0.0037) versus myelin alone (1.8 ± 0.026). Together, these results support the hypothesis that C1q interferes with the neuronal growth inhibitory signaling pathway activated by myelin, therefore reducing myelin-mediated inhibition of neurite outgrowth.
Complement C1q binds MAG in myelin, and C1q blocks growth inhibition by MAG in vitro
Several structurally and functionally distinct binding partners have been described for C1q (Van Schravendijk and Dwek, 1982; Afagh et al., 1996; Johns and Bernard, 1997; Kirschfink et al., 1997; Klickstein et al., 1997; Nepomuceno et al., 1997; Nauta et al., 2003; Kishore et al., 2004; McGrath et al., 2006; Gadjeva et al., 2008), and C1q is found localized to axons and myelin after SCI. Accordingly, we hypothesized that C1q could disrupt neurite outgrowth inhibition by binding to and blocking a protein in myelin. The culture paradigm used in our initial studies supports a binding interaction between C1q and myelin because C1q bound to adsorbed myelin substrate remained detectable by immunocytochemistry after unbound C1q was rinsed from wells before neurons were plated (Fig. 4A). Therefore, to identify potential protein-binding partners within myelin, C1q protein was incubated with the purified myelin preparation previously used in the neurite outgrowth assay, immunoprecipitated with anti-C1q IgG, and MudPIT mass spectroscopy was performed (Fig. 4B). Three proteins were found to exhibit high probability binding with C1q: myelin basic protein (MBP), proteolipid protein (PLP), and MAG. MBP and PLP are the two most abundant proteins in compact CNS myelin and are each crucial for the structural integrity and stability of myelination, but have no known function in myelin-mediated growth inhibition (Greer and Lees, 2002; Harauz et al., 2009). C1q recognition of these proteins, although novel, may reflect a conventional role for initiation of the classical complement cascade in myelin phagocytosis. In contrast, MAG is a particularly interesting binding partner for C1q because it is a known MAI (McKerracher et al., 1994; Mukhopadhyay et al., 1994).
Accordingly, we hypothesized that C1q binds to MAG as a constituent of purified myelin, effectively masking MAG from neuronal receptors mediating growth inhibition and increasing neurite growth compared with neurons grown on myelin alone. We therefore predicted that C1q would block inhibition by MAG in vitro. After validating the growth inhibitory effect of MAG (Fig. 4C) on primary mouse DRGs over time (at 48 h, MAG = 64.5 ± 7.9%, *p = 0.046 one-sample t test vs 100% control), C1q was tested for growth modulatory effects as before (Fig. 4D–G). Compared with neurons grown on MAG alone (63.6 ± 3.6%, ***p = 0.001 one-sample t test vs 100% control), neurons grown on MAG with C1q demonstrated an increase (#p = 0.033 two-tailed t test) in average neurite length per neuron (81.1 ± 7.3%), resulting in neurite growth similar to that of neurons under control conditions (p = 0.061 one-sample t test vs 100% control). These results are not due to differences in cell plating, viability, or proliferation between treatment groups (Fig. 4E,F) because there were no differences in the number of Hoechst+ nuclei (106 ± 3% vs 98 ± 3%, p = 0.075 two-tailed t test) or β-tubulin III+ neurons (110 ± 6% vs 103 ± 5%, p = 0.364 two-tailed t test). Notably, the effect sizes for both myelin- and MAG-mediated neurite outgrowth inhibition (Figs. 1, 4) are similar to previous reports from other groups, with ∼50–80% neurite length compared with control (Mukhopadhyay et al., 1994; Wörter et al., 2009). Together, these data support a mechanism for growth enhancement in which C1q binds and blocks inhibitory myelin constituent MAG.
Complement C1q blocks growth cone repulsion by MAG in vitro
In addition to the well established role for MAG in reduction of neurite outgrowth in culture (McKerracher et al., 1994; Mukhopadhyay et al., 1994), several studies have also demonstrated repulsive growth cone turning in response to soluble gradients of MAG in vitro (Song et al., 1998; Henley et al., 2004; Hines et al., 2010). If C1q binds to MAG within myelin, significantly reducing outgrowth inhibition on both myelin and MAG, then C1q may also be hypothesized to normalize MAG-mediated repulsive growth cone turning. We tested this hypothesis using agarose cubes containing NB medium alone, MAG, MAG + C1q, or C1q, which created temporary protein gradients across wells for live imaging of individual growth cones from adult mouse dissociated DRG cultures (Fig. 5). The turning angle (∡) of each growth cone relative to the agarose cube over the 45 min treatment period (t = 37 min - t = 82 min) was calculated using the procedure described under Materials and Methods and illustrated in Figure 5A. Negative values (−) indicate repulsion, positive values (+) indicate attraction. We predicted that: control treatments, specifically medium alone and C1q in the absence of MAG, would not result in growth cone turning, yielding expected average turning angles of ∼0° for these groups and that MAG would induce repulsive growth cone turning that would be blocked by the addition of C1q.
As expected, treatment with media control (Fig. 5B–D) did not cause a significant change in growth cone turning angles (+1.8° ± 3.7°; N = 29), nor did treatment with C1q in the absence of MAG (+2.1° ± 3.1°; N = 30). In contrast, treatment with MAG reliably altered growth cone turning angle consistent with repulsive turning (Fig. 5C, −7.5° ± 3.7°; ##p = 0.010 Kruskal–Wallis ANOVA, #p < 0.05 Dunn's multiple-comparisons test media control vs MAG; N = 42) and the magnitude of the observed turning angle was consistent with the 5–20° angles reported for MAG treatment in previously published assays (Henley et al., 2004; Hines et al., 2010). In support of our hypothesis, MAG-mediated repulsive turning was lost in cultures with MAG + C1q gradients, with the mean turning angle of these growth cones restored to ∼0 (+1.9° ± 3.2°; n = 51), which was significantly different from MAG alone (#p < 0.05 Dunn's multiple-comparisons test vs MAG). This shift is particularly apparent when the data are expressed as a cumulative distribution plot (Fig. 5D), in which each point represents the percentage of growth cones (y-axis) with growth cone turning less than or equal to the turning angle values (x-axis). Overall, these data demonstrate that C1q abolishes the repulsive turning of DRG growth cones in response to MAG and suggest that C1q interferes with not only the length inhibition but also the repulsive guidance functions of MAG in vitro.
Complement C1q modulates axon regeneration after SCI with conditioning lesion
A key question is whether these in vitro findings have in vivo relevance. We hypothesized that mice deficient in complement protein C1q would demonstrate an altered regeneration response after CNS injury in vivo. As discussed above, MAG induces growth inhibition with growth cone collapse or repulsive axon turning in primary neuronal culture depending on the assay conditions. If in SCI, as in primary culture, C1q binds to MAG and reduces MAG-mediated outgrowth inhibition and axon repulsion, then axon regeneration in C1q KO mice would be predicted to demonstrate a reduction in regenerated axon length beyond the injury and/or a directional shift in growth of regenerating axons within the injury.
Traumatic CNS injury does not normally result in axonal regeneration. Therefore, we used a peripheral conditioning lesion model of SCI that is known to produce modest but reproducible regeneration of ascending sensory fibers (Neumann et al., 2005). In this model, bilateral transection of the dorsal columns and transection of the sciatic nerve is performed in the first surgery, followed by proximal sciatic nerve retransection 1 week later. Anatomically, DRG neurons are pseudo-unipolar sensory cells, with one central axon branch in the gracile fasciculus of the dorsal column that terminates in the gracile nucleus of the medulla and one peripheral axon branch in the peripheral nerves (sciatic nerve) that terminates in the skin and muscle. The sciatic nerve transections serve to “prime” or “condition” the sensory neurons in the DRG, which results in sensory regeneration rostral to (through) the dorsal column SCI. Accordingly, regeneration of dorsal column sensory axons was assessed 6 weeks after SCI with peripheral conditioning using CTβ tracer injection into sciatic nerve to identify transected axons of peripherally conditioned neurons (Figs. 6, 7).
Figure 6.

Axon growth patterns in the spinal cord after SCI with conditioning lesion in C1q WT and C1q KO mice. A, Spinal cord lesion in a C1qWT mouse 6 weeks after SCI with sciatic nerve conditioning injury, with transected gracile fasciculus axons immunolabeled in black (CTβ tracer). A′, High-magnification image of the area boxed in A, with severed axons regrowing through the lesion, with caudal-rostral orientation (arrow). B, Spinal cord lesion in a C1q KO mouse. B′, High-magnification image of the boxed area in B, with severed axons regrowing in an altered direction (arrow). C, Transection of the dorsal column was verified by the absence of tracer immunoreactivity in the gracile nucleus of the medulla (top). For comparison, the gracile nucleus of mouse with an incomplete lesion is also shown (bottom). D, E, Reconstructions (from 11–16 sections/mouse) of large severed, traced axons in the lesion of each C1q KO mouse (D) and each C1q WT mouse (E). F, CTβ tracing of the gracile fasciculus, as determined by the proportion of lumbar sections containing labeled axons, did not differ significantly between genotypes. Scale bars: A, B, D, E, 500 μm; A′ and B′, 125 μm. For F, n = 4 C1q WT, 6 C1q KO (mice with evidence of either incomplete dorsal column lesion or insufficient tracer immunoreactivity were excluded from analysis: excluded Ns = 4 C1q KO, 3 C1q WT, and 3 SCI only), N.S. p > 0.05 t test.
Figure 7.
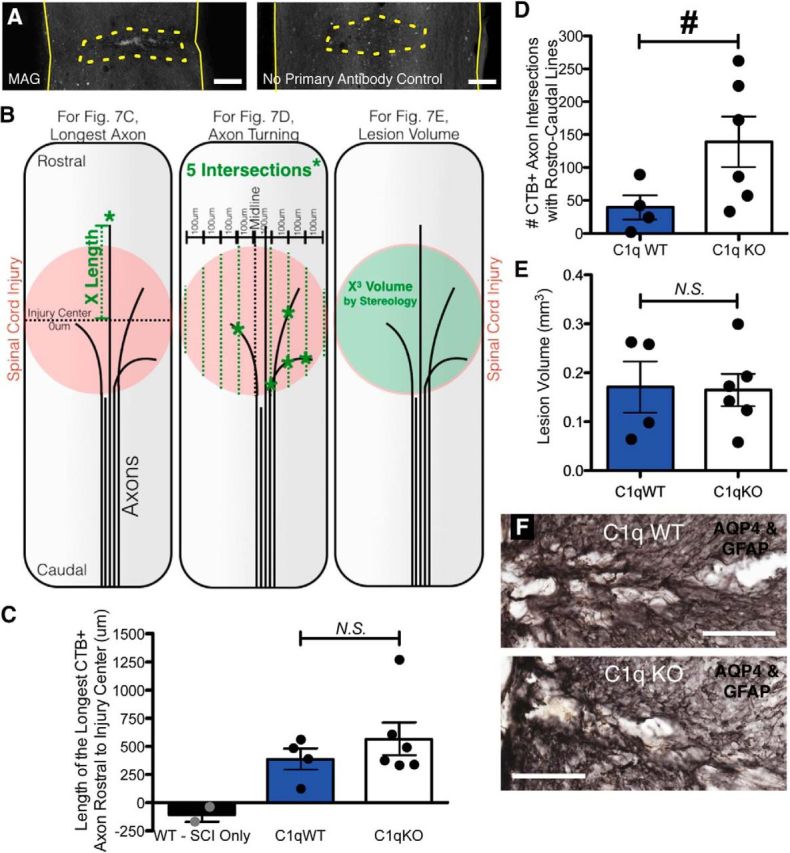
Increased axon turning in the lesion after SCI with conditioning lesion in C1q KO mice. A, MAG is detected in the lesion (dotted outline) by immunofluorescence (left), but not in primary antibody omitted control (right). B, Diagrams depicting methods for quantification of longest axon (C), axon turning (D), and lesion volume (E). Length of the longest CTβ-labeled axon rostral to the injury center (dotted black line, 0 μm) was determined for each mouse by measuring the distance from the injury center to the most rostral labeled point (green dotted line). To evaluate axon turning within the lesion, the number of traced axon intersections (green asterisks) with a series of eight parallel rostrocaudal oriented lines spaced 100 μm apart (green dotted lines) centered around the midline (black dotted line) was recorded. Lesion volume was estimated from tissue morphology using stereology, with the Cavalieri probe. C, C1q KO mice did not differ from WT littermates in longest axon length. D, C1qKO mice displayed a significant increase in axon turning, suggesting a role for C1q in axon guidance after SCI. E, No differences in lesion volume were detected between genotypes. F, Double immunolabel (black) for AQP4 and GFAP at lesion from representative C1q WT and C1q KO mice. All values are mean ± SEM. For spinal cord images, rostral is up. Scale bars: A, 500 μm; F, 250 μm. n = 4 C1q WT, 6 C1q KO (mice with evidence of either incomplete dorsal column lesion or insufficient tracer immunoreactivity were excluded from analysis: excluded Ns = 4 C1q KO, 3 C1q WT, and 3 SCI only); for D, *p < 0.05 t test; for C and E, p > 0.05 t test.
For axon regeneration analyses, horizontal sections through the SCI site for each C1q WT and C1q KO mouse were immunolabeled for CTβ tracer. Low- and high-magnification images of the injury area from a single mouse from each genotype are shown in Figure 6, A and B′. Lesion completeness was verified by the absence of CTβ immunoreactivity in the gracile nucleus of the medulla and mice with incomplete lesions were excluded from all analyses (Fig. 6C). Mice with poor tracer injections, determined by weak or absent CTβ tracer immunoreactivity in the lumbar spinal cord, were also excluded. See Materials and Methods for exclusion details.
The general growth patterns of transected, traced axons in each C1q KO and C1q WT mouse are depicted in Figure 6, D and E. To achieve this, low-magnification photographs, which revealed the largest, most prominent axons, were traced manually (relative to the center of the injury) and the tracings were flattened across sections for each mouse. Importantly, CTβ labeling was similar between genotypes in lumbar spinal cord sections (Fig. 6F, p = 0.107 two-tailed t test, 34.4 ± 6.82% vs 48.3 ± 4.32%), as determined by the percentage of horizontal L1–L6 sections containing tracer immunoreactivity in a full tissue set stained at 1 in 3 sampling, indicating that any differences detected in axon growth patterns were unlikely to be a direct result of discrepancies in the overall efficiency of tracer labeling.
Some inhibitory molecules, such as chondroitin sulfate proteoglycans, are localized to and thought to exert their effects mainly within the SCI lesion. MAG, however, would be predicted to be present in degenerating white matter axon tracts both proximal and distal to the lesion and it is unclear whether MAG is also localized at the lesion epicenter. Importantly, the presence or absence of inhibitory myelin debris at the lesion may be a key variable for predicting the detection and localization of the predicted C1q effect on axon growth in response to MAIs. We therefore evaluated MAG in the injured spinal cord by immunofluorescence and found evidence of MAG at the lesion epicenter (Fig. 7A, left; note that immunofluorescence was not detected at the lesion epicenter in the absence of primary antibody, right).
If C1q binds to MAG and thus prevents MAG from inducing growth inhibition, then we would predict reduced CTβ labeled axon length in C1q KO mice. In mice with dorsal column transection but no sciatic nerve conditioning lesion, the length of the longest CTβ+ axon rostral to the injury center (Fig. 7B,C) was negative (Fig. 7C, −105 ± 66 μm), indicating axonal die-back without regeneration. In agreement with the peripheral conditioning model, all C1q KO and C1q WT mice displayed some regeneration of CTβ+ axons after conditioning lesion, as indicated by positive values for length of the longest axon (121–1268 μm). However, no difference in length of the longest CTβ+ axon was observed between C1q KO and C1q WT mice (566 ± 147 μm vs 387 ± 95 μm; p = 0.392 two-tailed t test). Similarly, stereological analysis of total traced CTβ+ axon length within the lesion showed no difference between WT and KO mice (p > 0.05 two-tailed t test, data not shown).
If C1q binds to MAG and thus inhibits MAG from inducing axon turning, then we might expect growing axons in C1q KO mice to demonstrate a shift in the directionality of growth at the injury. Therefore, we also quantified the growth of CTβ+ axons perpendicular to the spinal axis within the lesion by counting intersections between traced axons and a series of parallel lines oriented in the rostro-caudal plane (Fig. 7B,D). Consistent with our hypothesis, C1q KO mice demonstrated increased turning of regenerating CTβ+ axons (Fig. 7D, 139 ± 39 vs 39 ± 18, #p = 0.041 two-tailed t test).
There were no differences between genotype groups in lesion volume (Fig. 7B,E, 0.171 ± 0.05 mm3 vs 0.165 ± 0.03 mm3, p = 0.921 two-tailed t test) measured using the Cavalieri probe for volume estimation based on the unbiased, systematic random sampling principles of stereology. Similarly, C1q deficiency did not appear to affect the gross morphology of the astrocytic scar in AQP4 + GFAP-immunolabeled sections (Fig. 7F), consistent with previous data from the contusion SCI model in C1q WT and KO mice (Galvan et al., 2008). Therefore, the C1q-mediated effect on the pattern of axon regrowth is not likely to be a secondary effect of changes in lesion size or lesion orientation, although the latter cannot be entirely ruled out based on these scar images alone. Together, these data suggest that complement C1q alters CTβ+ sensory axon growth patterns after SCI and may modulate the effects of myelin on axonal growth in vivo as well as in vitro.
Complement C1q affects the pattern of CST axon sprouting into cervical gray matter after thoracic SCI
Although the altered pattern of sensory axon regeneration in C1q KO mice that resulted from this proof of concept model of SCI axon regeneration is mechanistically and physiologically interesting, the relevance of this type of change in axon guidance for clinical behavioral recovery of motor tract function remained unclear, especially in the absence of a conditioning lesion. Critically, in addition to the “true” long distance regeneration of severed axons in which synaptic contact with the original target is established, more recent data suggest that local forms of plasticity, including sprouting from either injured or intact axons, may contribute to functional recovery (Cafferty et al., 2008). We therefore sought to test the role of C1q in descending CST motor axon sprouting into spinal gray matter after dorsal column transection SCI in C1q KO and C1q WT mice.
The CST is a descending axon tract important for coordinated voluntary movement of the extremities and is especially critical for fine motor control in primates, including humans (Watson et al., 2009; Rosenzweig et al., 2010). Both CST axon sprouting and CST midline crossing have been shown to correlate with functional recovery in rodent SCI models (Simonen et al., 2003; Cafferty et al., 2010; Liu et al., 2010; Schnell et al., 2011; Starkey et al., 2011). However, axon targeting/guidance during spinal cord regeneration has rarely been assessed and it is unclear whether the mechanisms underlying this response are in common with those for axon sprouting into gray matter (either overall or into specific laminae) or midline crossing phenomena. We hypothesized that a parallel to the observed effects of C1q on axonal outgrowth and turning in culture and in the SCI plus conditioning model that would be relevant to motor control might be revealed in the form of reduced cervical CST axon sprouting length after thoracic dorsal column transection SCI in C1q KO mice. We therefore investigated CST axon sprouting into the ipsilateral gray matter and across the spinal cord midline in C1q KO and WT mice analyzing: midline axon crossing, total sprouting (axon length) in ipsilateral gray matter as a reflection of overall CST plasticity, and the relative proportion of sprouting into lamina X as a reflection of targeted/guided axon plasticity. We were particularly interested in changes in axon sprouting into lamina X because this layer contains central canal neurons that mediate sensory, motor, and autonomic integration through projections to dorsal, intermediate, and ventral spinal gray matter (Borges and Iversen, 1986). Further, SCI (Soares et al., 2007), and especially functional recovery from SCI after acetyl-l-carnine (Patel et al., 2012) and chondroitinase ABC (Starkey et al., 2011) treatments, have been correlated with lamina X neuroprotection and CST reorganization into lamina X. Importantly, MAG is known to play a role in axon growth and guidance during normal CNS development (Song et al., 1998; Nguyen et al., 2009), and C1q is involved CNS development as well (Chu et al., 2010; Schafer et al., 2012). Therefore, we also evaluated uninjured sham C1q WT and C1q KO mice for differences in CST axon sprouting as a result of C1q developmental effects.
To investigate the potential role for complement protein C1q in sprouting and midline crossing of descending axons, C1q WT and C1q KO mice received either dorsal column transection SCI or laminectomy and sham injury; all mice also received unilateral BDA tracing into the sensorimotor cortex to label the CST, followed by collection of tissues 6 weeks after SCI for histological assessment. Figure 8A depicts a diagram of the SCI model (left) and a representative cervical spinal cord section for analysis of BDA-traced axons (right), with the dCST (black outline), midline of the gray matter (red line), ipsilateral gray matter (yellow outline), and ipsilateral lamina X (blue outline) marked. These designations indicate where analyses of BDA tract labeling efficiency (Fig. 8C), midline crossing (Fig. 8D), total sprouting (Fig. 8E), and sprouting into lamina X (Fig. 8F–H) were conducted (respectively). No differences were detected between genotypes for either lesion volume (Fig. 8B; p = 0.657 two-tailed t test, 0.68 ± 0.12 mm3 vs 0.62 ± 0.07 mm3) or dCST BDA axon tracing (Table 1 sham; p = 0.364 two-tailed t test, 31.2 ± 2.18 vs 27.8 ± 2.87; Fig. 8C, SCI; p = 0.993 two-tailed t test, 32.2 ± 5.25 vs 32.2 ± 4.07), supporting direct comparison of sprouting results for the remaining analyses. In addition, no differences between sham C1q WT and KO mice were detected for any of our primary sprouting analyses (Table 1; p = 0.448 two-tailed t test, 2.9 ± 0.98 vs 2.1 ± 0.34; p = 0.393 two-tailed t test, 439 ± 129 mm vs 316 ± 44.4 mm; p = 0.438 two-tailed t test, 5.0 ± 0.53% vs 5.8 ± 0.77%), supporting the validity of the comparison between injured C1q WT and KO mice for each measure.
Table 1.
Genotype comparisons in sham mice do not indicate significant developmental differences in CST labeling efficiency or sprouting
| Analysis | C1q WT | C1q KO | t test |
|---|---|---|---|
| BDA + dCST axon count | 31.2 ± 2.18 | 27.8 ± 2.87 | NS, p = 0.364 |
| Midline GM axon crossings (mean/section) | 2.9 ± 0.98 | 2.1 ± 0.34 | NS, p = 0.448 |
| Sprouting length in GM (mm/section) | 439 ± 129 | 316 ± 44.4 | NS, p = 0.393 |
| Sprouting into lamina X (% total GM) | 5.0 ± 0.53 | 5.8 ± 0.77 | NS, p = 0.438 |
Results (mean ± SEM and t test) of the sham C1q WT and sham C1q KO comparisons for each CST sprouting analysis measure are listed in the table. BDA tracer efficiency did not differ by genotype. C1q KO did not affect baseline CST sprouting. N = 5 C1q WT sham and 5 C1q KO sham. GM, Gray matter.
We hypothesized that C1q KO mice would display a difference in midline crossing CST axons in relation to C1q WT mice after SCI. Although our analysis of the total number of BDA traced CST axons crossing the spinal cord midline was sufficiently sensitive to detect differences in average midline axon crossing between SCI and sham mice overall (*p = 0.039 one-tailed t test, 4.3 ± 0.74 SCI vs 2.5 ± 0.51 sham, data not shown), the number of labeled axons crossing the midline was not altered in injured C1q KO compared with injured C1q WT mice (Fig. 8D, p = 0.359 two-tailed t test, 41.6 ± 12.8 vs 34.4 ± 8.2). In addition, we predicted that the absence of C1q would affect CST axon sprouting into ipsilateral gray matter, both in terms of amount and pattern. However, unbiased stereology of SCI tissue using the spaceballs probe demonstrated that total axon sprouting, as determined by the estimated length of BDA-labeled axons, in the gray matter ipsilateral to the traced side of the spinal dorsal CST was not affected by genotype (Fig. 8E; p = 0.954 two-tailed t test, 498 ± 193 mm vs 512 ± 140 mm).
To evaluate the relative proportion of sprouting into lamina X and overall sprouting pattern after SCI, we quantified the relative proportion of BDA-labeled CST axons in ipsilateral lamina X for each mouse. Specifically, the spatial stereology data from the axon sprouting (length) analysis were digitally overlaid onto spinal-level-specific anatomical drawings of gray matter laminae and then the number of axon intersections with the spaceballs probe within each lamina was recorded per mouse and lamina X counts expressed as a percentage of all 10 laminae. After SCI, C1q KO mice exhibited reduced sprouting into lamina X compared with littermate controls (Fig. 8F; #p = 0.033 two-tailed t test, 6.9 ± 1.2% SCI C1q KO vs 13.4 ± 2.7% SCI C1q WT). Although SCI induced a >250% increase in lamina X sprouting in C1q WT mice (Fig. 8G; #p = 0.031 two-tailed t test, 13.4 ± 2.7% SCI C1q WT vs 5.0 ± 0.53% Sham C1q WT), this sprouting effect was lost in C1q KO mice (Fig. 8H; p = 0.540 two-tailed t test, 6.9 ± 1.2% SCI C1q KO vs 5.8 ± 0.77% sham C1q KO). The results from these analyses suggest that the presence of C1q is required for SCI-induced plasticity in lamina X. To determine whether the anatomical substrate for a localized sprouting effect mediated by C1q after SCI was specific for lamina X as predicted, we conducted the same analysis in each of the other nine laminae. Lamina X was the only area that displayed an injury associated increase in the proportion of sprouting in C1q WT mice (Fig. 8I). In parallel, only lamina X demonstrated a significant change in sprouting after SCI in C1q WT versus KO mice. This C1q-dependent, injury-induced, lamina X-specific sprouting effect for CST axons further supports our hypothesis that complement C1q affects meaningful CNS axon regrowth after SCI.
Discussion
Complement proteins have been suggested to exert nontraditional functions with regard to organ development and regeneration (Del Rio-Tsonis et al., 1998; Mastellos et al., 2001; Kimura et al., 2003; Haynes et al., 2013) as well as neuronal migration and differentiation (Rahpeymai et al., 2006; Shinjyo et al., 2009), plasticity (Berg et al., 2012; Schafer et al., 2012), and neuroprotection (Osaka et al., 1999; Mukherjee and Pasinetti, 2001; Benoit et al., 2013) within the CNS. This functional diversity suggests that distinct roles for different complement components may be the result of specific interactions within the developing or injured microenvironment that are separate from the role of these molecules in the innate immune response (Peterson and Anderson, 2014). Here, we describe a novel role for complement protein C1q in neurite outgrowth in vitro and spinal axon regeneration in vivo.
In vitro, complement C1q rescued cultured cortical neurons from myelin-mediated outgrowth inhibition, whereas complement C3 exacerbated outgrowth inhibition. This is particularly interesting because, in the classical complement cascade, C1q is the principal recognition molecule and C3 is activated downstream of C1q. Opposing effects of different complement proteins on neurite outgrowth suggest distinct mechanisms for growth modulation with C1q and C3. Importantly, modulation of individual complement components may result in differential effects on the pathological and behavioral outcome after CNS injury; however, the mechanisms underlying these observations are not well understood (Qiao et al., 2006; Galvan et al., 2008; Beck et al., 2010; Guo et al., 2010; Qiao et al., 2010; Peterson and Anderson, 2014).
The concentration range for C1q protein exogenously applied to our primary neuronal cultures was chosen based on estimates from physiological availability and culture dynamics. Complement C1 complex circulates in human serum at ∼100 μg/ml or 244 nm (Yonemasu et al., 1978), with ∼10% of the C1q being free whereas the rest is in complex with C1r and C1s (Ziccardi and Tschopp, 1982). The amount of C1q secreted by invading and resident cells in the spinal cord is unknown. Although the extent of neuronal exposure to complement at various distances from the lesion after SCI due to the combination of BSB disruption, inflammatory infiltration, and local synthesis has not been established, the neurite outgrowth data reported here encompass a C1q range of 1–250 μg/ml (2–610 nm). Further, in the myelin/C1q adsorption paradigm (Fig. 1), washing the culture wells before cell plating reduced the concentration of C1q available to neurons by ∼70% (by ELISA, data not shown), yielding an effective concentration of ∼75 μg/ml (183 nm). In parallel, in the MAG assays, C1q was adsorbed at 1–3 μg/ml (Fig. 4) or slowly released from 60 μg cubes (Fig. 5). Finally, the C1q:MAG molar ratio used in DRG outgrowth and growth cone turning experiments was essentially 1:1 (146:141 and 7.3:7.0 pmol). Therefore, we estimate the C1q concentrations tested in our culture experiments to be physiologically relevant in the context of CNS trauma.
We investigated the mechanism for growth enhancement by C1q on myelin and report that C1q can bind to MAG, modulate myelin inhibitory signaling pathways, and abolish repulsive axon turning in response to a MAG gradient. Although this interaction is surprising, C1q has been shown to bind a variety of structurally and functionally distinct cellular receptors and cellular components via either the C1q globular head or the collagen-like tail domains (Krumdieck et al., 1992; Rogers et al., 1992; Johns and Bernard, 1997; McGreal and Gasque, 2002; Tissot et al., 2003; Roumenina et al., 2006).
Based on these data, we hypothesized that C1q would exert a CNS regeneration effect phenotypically similar to physiological MAG blockade. However, the in vitro and in vivo effects of MAG as an inhibitor of regeneration are not well reconciled. In contrast to genetic knockout of, or neutralizing antibody treatment to, NogoA (Schnell and Schwab, 1990; Kim et al., 2003; Simonen et al., 2003; Lee et al., 2010), genetic KO of MAG has revealed no enhancement in CST regrowth in the injured spinal cord and a minimal impact on serotonergic fiber sprouting (Bartsch et al., 1995; Cafferty et al., 2010; Lee et al., 2010). One explanation for the surprisingly minimal role of MAG in regeneration in constitutive MAG KO experiments thus far is the known role for MAG in CNS development and maintenance. Because MAG KO mice display mild deficits in myelination, axon caliber, axon conduction, and axonal integrity (Yin et al., 1998; Weiss et al., 2001; Loers et al., 2004), detection of compensatory or injury effects in these models may be limited.
Alternatively, because MAG has been shown to induce both growth inhibition with growth cone collapse and repulsive axon turning in vitro, it is possible that the principal impact of MAG as a regeneration inhibitory protein in vivo is not on axon length, but on axon guidance. The observation of a change in the direction of axon growth in the spinal cord lesion without a change in the maximum regenerated axon length in C1q KO mice supports this interpretation. Interestingly, no previous CNS injury study has reported results from directional growth assessments in vivo after MAG manipulation. An additional explanation for the minimal effect of MAG manipulation on axon growth after SCI in vivo could be that MAG is masked under normal injured conditions. Because C1q is abundant at the SCI epicenter (A.J.A., unpublished observations), C1q binding to MAG in genetically WT mice could attenuate the effect of MAG on axon regeneration after injury, leading to the absence of a regeneration phenotype in MAG KO animals. Results from turning analyses in other in vivo paradigms may inform a more complete understanding of the physiological role for MAG after CNS injury.
We also tested the hypothesis that C1q KO mice display alterations in CST axon sprouting and midline crossing after SCI. Although no effect was detected for C1q KO in frequency of CST midline crossing or overall length of sprouting, C1q KO specifically attenuated the SCI-induced sprouting of CST axons into lamina X. Although this lamina X response is intriguing, it is important to note that this study assessed total axon sprouting into or across each lamina, not necessarily terminal axon innervation or synapse formation into each lamina. Accordingly, given the anatomical location of lamina X, we cannot rule out that these data could reflect subtle differences in midline axon crossing that were not detected by our initial crossing analysis. Although the functional consequences of this effect on CST axon sprouting into lamina X were not determined in this experiment, a previously published study from our laboratory demonstrated improved locomotor recovery in C1q KO mice after midthoracic contusion SCI (Galvan et al., 2008). As noted above, lamina X sparing and CST reorganization have been correlated with locomotor recovery after SCI (Starkey et al., 2011; Patel et al., 2012), suggesting a positive role for post-SCI sprouting in this region that would be inconsistent with locomotor improvements in C1q KO mice. One possibility is that the type of SCI is a key variable. In our data, C1q KO mice exhibit reduced lesion volume after contusion (Galvan et al., 2008) but not transection (data presented here) SCI. The benefit of lesion volume reduction in C1q KO mice in contusion models could mask a detrimental effect on compensatory CST sprouting. Alternatively, restoration of an uninjured pattern of CST inputs to lamina X may be of net benefit via restoration of some aspect of locomotor circuitry. If C1q modulates sprouting onto long propriospinal axons (or other spinal systems), a rebalancing of network inputs relevant to autonomic or other functions could have a profound impact on nonmotor pathways. Further studies will be necessary to elucidate the specific anatomical and functional consequences, as well as the source and localization of C1q after SCI.
Although the present data support our prediction for C1q as a direct modulator of axon growth through interactions with MAG and/or neurons, indirect interactions between C1q and glia or inflammatory cells in particular may also play a role in axon growth within the context of the SCI microenvironment. This might include C1q-mediated differences in scar formation, cytokine production, and/or polarization of inflammatory cell phenotypes (Benoit et al., 2013; Wanner et al., 2013). Future studies focused on these potential C1q–SCI interactions could be especially interesting.
Overall, our findings demonstrate a novel regenerative role for complement proteins in the CNS, adding to the collection of recent evidence supporting nontraditional roles for complement proteins and the wider inflammatory response in diverse biological processes. Several inflammatory cells (i.e., macrophages, microglia, neutrophils) and molecules (i.e., IL-1, TGF-β, oncomodulin) modulate axon growth (Janeway, 2001; Wyss-Coray and Mucke, 2002; Jones et al., 2005; Benowitz and Popovich, 2011). Diverse inflammatory interactions with other (nonregeneration) injury-associated processes critical for SCI recovery have been described, including myelin clearance and remyelination (i.e., macrophages/microglia, TNFα, IL-1β), synapse plasticity (i.e., MHCI, microglia), cellular survival/toxicity (i.e., proteases, ROS), cellular migration (i.e., chemokines), and lesion dynamics (Benowitz and Popovich, 2011). Understanding the host of interactions between the immune system and the CNS after SCI and defining the full spectrum of specific roles for complement and other inflammatory cells and proteins within this context will be critical to advancing immunomodulatory strategies for SCI and other neurological injuries/diseases.
Footnotes
This work was supported by the National Institute of Neurological Disorders and Stroke, National Institutes of Health (Grant R01 #NS43428) and by Children's Research Foundation [Grant AAC-2010(2)]. We thank the Christopher Reeve Paralysis Foundation SCI Core at UC Irvine for technical support and expertise with mouse SCI experiments, particularly Rebecca Nishi, Chelsea Pagan, and Hongli Liu; Narek Israelyan and Daniel Cantu for assistance with culture analysis; Andrea Tenner at UC Irvine for invaluable advice and purified C1q protein; Marie Filbin at Hunter College for training in growth assay protocols and myelin purification; Austin Yang for MudPIT analysis at University of Baltimore; and Ardi Gunawan and Kelli Sharp at UC Irvine for assistance with BDA tracing.
The authors declare no competing financial interests.
References
- Afagh A, Cummings BJ, Cribbs DH, Cotman CW, Tenner AJ. Localization and cell association of C1q in Alzheimer's disease brain. Exp Neurol. 1996;138:22–32. doi: 10.1006/exnr.1996.0043. [DOI] [PubMed] [Google Scholar]
- Amano M, Ito M, Kimura K, Fukata Y, Chihara K, Nakano T, Matsuura Y, Kaibuchi K. Phosphorylation and activation of myosin by Rho-associated kinase (Rho-kinase) J Biol Chem. 1996;271:20246–20249. doi: 10.1074/jbc.271.34.20246. [DOI] [PubMed] [Google Scholar]
- Anderson AJ, Robert S, Huang W, Young W, Cotman CW. Activation of complement pathways after contusion-induced spinal cord injury. J Neurotrauma. 2004;21:1831–1846. doi: 10.1089/neu.2004.21.1831. [DOI] [PubMed] [Google Scholar]
- Bagamery K, Kvell K, Landau R, Graham J. Flow cytometric analysis of CD41-labeled platelets isolated by the rapid, one-step OptiPrep method from human blood. Cytometry A. 2005;65:84–87. doi: 10.1002/cyto.a.20133. [DOI] [PubMed] [Google Scholar]
- Bareyre FM, Haudenschild B, Schwab ME. Long-lasting sprouting and gene expression changes induced by the monoclonal antibody IN-1 in the adult spinal cord. J Neurosci. 2002;22:7097–7110. doi: 10.1523/JNEUROSCI.22-16-07097.2002. [DOI] [PMC free article] [PubMed] [Google Scholar]
- Bartsch U, Bandtlow CE, Schnell L, Bartsch S, Spillmann AA, Rubin BP, Hillenbrand R, Montag D, Schwab ME, Schachner M. Lack of evidence that myelin-associated glycoprotein is a major inhibitor of axonal regeneration in the CNS. Neuron. 1995;15:1375–1381. doi: 10.1016/0896-6273(95)90015-2. [DOI] [PubMed] [Google Scholar]
- Beck KD, Nguyen HX, Galvan MD, Salazar DL, Woodruff TM, Anderson AJ. Quantitative analysis of cellular inflammation after traumatic spinal cord injury: evidence for a multiphasic inflammatory response in the acute to chronic environment. Brain. 2010;133:433–447. doi: 10.1093/brain/awp322. [DOI] [PMC free article] [PubMed] [Google Scholar]
- Benoit ME, Hernandez MX, Dinh ML, Benavente F, Vasquez O, Tenner AJ. C1q-induced LRP1B and GPR6 proteins expressed early in Alzheimer disease mouse models, are essential for the C1q-mediated protection against amyloid-beta neurotoxicity. J Biol Chem. 2013;288:654–665. doi: 10.1074/jbc.M112.400168. [DOI] [PMC free article] [PubMed] [Google Scholar]
- Benowitz LI, Popovich PG. Inflammation and axon regeneration. Curr Opin Neurol. 2011;24:577–583. doi: 10.1097/WCO.0b013e32834c208d. [DOI] [PubMed] [Google Scholar]
- Berg A, Zelano J, Stephan A, Thams S, Barres BA, Pekny M, Pekna M, Cullheim S. Reduced removal of synaptic terminals from axotomized spinal motoneurons in the absence of complement C3. Exp Neurol. 2012;237:8–17. doi: 10.1016/j.expneurol.2012.06.008. [DOI] [PubMed] [Google Scholar]
- Borges LF, Iversen SD. Topography of choline acetyltransferase immunoreactive neurons and fibers in the rat spinal cord. Brain Res. 1986;362:140–148. doi: 10.1016/0006-8993(86)91407-1. [DOI] [PubMed] [Google Scholar]
- Botto M. C1q knock-out mice for the study of complement deficiency in autoimmune disease. Exp Clin Immunogenet. 1998;15:231–234. doi: 10.1159/000019076. [DOI] [PubMed] [Google Scholar]
- Brück W, Friede RL. The role of complement in myelin phagocytosis during PNS wallerian degeneration. J Neurol Sci. 1991;103:182–187. doi: 10.1016/0022-510X(91)90162-Z. [DOI] [PubMed] [Google Scholar]
- Cafferty WB, McGee AW, Strittmatter SM. Axonal growth therapeutics: regeneration or sprouting or plasticity? Trends Neurosci. 2008;31:215–220. doi: 10.1016/j.tins.2008.02.004. [DOI] [PMC free article] [PubMed] [Google Scholar]
- Cafferty WB, Duffy P, Huebner E, Strittmatter SM. MAG and OMgp synergize with Nogo-A to restrict axonal growth and neurological recovery after spinal cord trauma. J Neurosci. 2010;30:6825–6837. doi: 10.1523/JNEUROSCI.6239-09.2010. [DOI] [PMC free article] [PubMed] [Google Scholar]
- Cai D, Shen Y, De Bellard M, Tang S, Filbin MT. Prior exposure to neurotrophins blocks inhibition of axonal regeneration by MAG and myelin via a cAMP-dependent mechanism. Neuron. 1999;22:89–101. doi: 10.1016/S0896-6273(00)80681-9. [DOI] [PubMed] [Google Scholar]
- Caroni P, Schwab ME. Two membrane protein fractions from rat central myelin with inhibitory properties for neurite growth and fibroblast spreading. J Cell Biol. 1988;106:1281–1288. doi: 10.1083/jcb.106.4.1281. [DOI] [PMC free article] [PubMed] [Google Scholar]
- Chaudhry N, Filbin MT. Myelin-associated inhibitory signaling and strategies to overcome inhibition. J Cereb Blood Flow Metab. 2007;27:1096–1107. doi: 10.1038/sj.jcbfm.9600407. [DOI] [PubMed] [Google Scholar]
- Chu Y, Jin X, Parada I, Pesic A, Stevens B, Barres B, Prince DA. Enhanced synaptic connectivity and epilepsy in C1q knockout mice. Proc Natl Acad Sci U S A. 2010;107:7975–7980. doi: 10.1073/pnas.0913449107. [DOI] [PMC free article] [PubMed] [Google Scholar]
- Cripps D, Thomas SN, Jeng Y, Yang F, Davies P, Yang AJ. Alzheimer disease-specific conformation of hyperphosphorylated paired helical filament-Tau is polyubiquitinated through Lys-48, Lys-11, and Lys-6 ubiquitin conjugation. J Biol Chem. 2006;281:10825–10838. doi: 10.1074/jbc.M512786200. [DOI] [PubMed] [Google Scholar]
- Del Rio-Tsonis K, Tsonis PA, Zarkadis IK, Tsagas AG, Lambris JD. Expression of the third component of complement, C3, in regenerating limb blastema cells of urodeles. J Immunol. 1998;161:6819–6824. [PubMed] [Google Scholar]
- Deng K, He H, Qiu J, Lorber B, Bryson JB, Filbin MT. Increased synthesis of spermidine as a result of upregulation of arginase I promotes axonal regeneration in culture and in vivo. J Neurosci. 2009;29:9545–9552. doi: 10.1523/JNEUROSCI.1175-09.2009. [DOI] [PMC free article] [PubMed] [Google Scholar]
- Duce JA, Hollander W, Jaffe R, Abraham CR. Activation of early components of complement targets myelin and oligodendrocytes in the aged rhesus monkey brain. Neurobiol Aging. 2006;27:633–644. doi: 10.1016/j.neurobiolaging.2005.03.027. [DOI] [PubMed] [Google Scholar]
- Gadjeva MG, Rouseva MM, Zlatarova AS, Reid KB, Kishore U, Kojouharova MS. Interaction of human C1q with IgG and IgM: revisited. Biochemistry. 2008;47:13093–13102. doi: 10.1021/bi801131h. [DOI] [PubMed] [Google Scholar]
- Galvan MD, Luchetti S, Burgos AM, Nguyen HX, Hooshmand MJ, Hamers FP, Anderson AJ. Deficiency in complement C1q improves histological and functional locomotor outcome after spinal cord injury. J Neurosci. 2008;28:13876–13888. doi: 10.1523/JNEUROSCI.2823-08.2008. [DOI] [PMC free article] [PubMed] [Google Scholar]
- Greer JM, Lees MB. Myelin proteolipid protein–the first 50 years. Int J Biochem Cell Biol. 2002;34:211–215. doi: 10.1016/S1357-2725(01)00136-4. [DOI] [PubMed] [Google Scholar]
- Guo Q, Li S, Liang Y, Zhang Y, Zhang J, Wen C, Lin S, Wang H, Su B. Effects of C3 deficiency on inflammation and regeneration following spinal cord injury in mice. Neurosci Lett. 2010;485:32–36. doi: 10.1016/j.neulet.2010.08.056. [DOI] [PubMed] [Google Scholar]
- Harauz G, Ladizhansky V, Boggs JM. Structural polymorphism and multifunctionality of myelin basic protein. Biochemistry. 2009;48:8094–8104. doi: 10.1021/bi901005f. [DOI] [PubMed] [Google Scholar]
- Haynes T, Luz-Madrigal A, Reis ES, Echeverri Ruiz NP, Grajales-Esquivel E, Tzekou A, Tsonis PA, Lambris JD, Del Rio-Tsonis K. Complement anaphylatoxin C3a is a potent inducer of embryonic chick retina regeneration. Nat Commun. 2013;4:2312. doi: 10.1038/ncomms3312. [DOI] [PMC free article] [PubMed] [Google Scholar]
- Henley JR, Huang KH, Wang D, Poo MM. Calcium mediates bidirectional growth cone turning induced by myelin-associated glycoprotein. Neuron. 2004;44:909–916. doi: 10.1016/j.neuron.2004.11.030. [DOI] [PMC free article] [PubMed] [Google Scholar]
- Hines JH, Abu-Rub M, Henley JR. Asymmetric endocytosis and remodeling of beta1-integrin adhesions during growth cone chemorepulsion by MAG. Nat Neurosci. 2010;13:829–837. doi: 10.1038/nn.2554. [DOI] [PMC free article] [PubMed] [Google Scholar]
- Janeway C, editor. Immunobiology. Ed 5. New York: Garland Publishing; 2001. [Google Scholar]
- Johns TG, Bernard CC. Binding of complement component Clq to myelin oligodendrocyte glycoprotein: a novel mechanism for regulating CNS inflammation. Mol Immunol. 1997;34:33–38. doi: 10.1016/S0161-5890(97)00005-9. [DOI] [PubMed] [Google Scholar]
- Jones TB, McDaniel EE, Popovich PG. Inflammatory-mediated injury and repair in the traumatically injured spinal cord. Curr Pharm Des. 2005;11:1223–1236. doi: 10.2174/1381612053507468. [DOI] [PubMed] [Google Scholar]
- Kim JE, Li S, GrandPré T, Qiu D, Strittmatter SM. Axon regeneration in young adult mice lacking Nogo-A/B. Neuron. 2003;38:187–199. doi: 10.1016/S0896-6273(03)00147-8. [DOI] [PubMed] [Google Scholar]
- Kimura Y, Madhavan M, Call MK, Santiago W, Tsonis PA, Lambris JD, Del Rio-Tsonis K. Expression of complement 3 and complement 5 in newt limb and lens regeneration. J Immunol. 2003;170:2331–2339. doi: 10.4049/jimmunol.170.5.2331. [DOI] [PubMed] [Google Scholar]
- Kirschfink M, Blase L, Engelmann S, Schwartz-Albiez R. Secreted chondroitin sulfate proteoglycan of human B cell lines binds to the complement protein C1q and inhibits complex formation of C1. J Immunol. 1997;158:1324–1331. [PubMed] [Google Scholar]
- Kishore U, Gaboriaud C, Waters P, Shrive AK, Greenhough TJ, Reid KB, Sim RB, Arlaud GJ. C1q and tumor necrosis factor superfamily: modularity and versatility. Trends Immunol. 2004;25:551–561. doi: 10.1016/j.it.2004.08.006. [DOI] [PubMed] [Google Scholar]
- Klickstein LB, Barbashov SF, Liu T, Jack RM, Nicholson-Weller A. Complement receptor type 1 (CR1, CD35) is a receptor for C1q. Immunity. 1997;7:345–355. doi: 10.1016/S1074-7613(00)80356-8. [DOI] [PubMed] [Google Scholar]
- Krumdieck R, Höök M, Rosenberg LC, Volanakis JE. The proteoglycan decorin binds C1q and inhibits the activity of the C1 complex. J Immunol. 1992;149:3695–3701. [PubMed] [Google Scholar]
- Lange PS, Langley B, Lu P, Ratan RR. Novel roles for arginase in cell survival, regeneration, and translation in the central nervous system. J Nutr. 2004;134:2812S–2817S. doi: 10.1093/jn/134.10.2812S. discussion 2818S–2819S. [DOI] [PubMed] [Google Scholar]
- Lee JK, Geoffroy CG, Chan AF, Tolentino KE, Crawford MJ, Leal MA, Kang B, Zheng B. Assessing spinal axon regeneration and sprouting in Nogo-, MAG-, and OMgp-deficient mice. Neuron. 2010;66:663–670. doi: 10.1016/j.neuron.2010.05.002. [DOI] [PMC free article] [PubMed] [Google Scholar]
- Liu K, Lu Y, Lee JK, Samara R, Willenberg R, Sears-Kraxberger I, Tedeschi A, Park KK, Jin D, Cai B, Xu B, Connolly L, Steward O, Zheng B, He Z. PTEN deletion enhances the regenerative ability of adult corticospinal neurons. Nat Neurosci. 2010;13:1075–1081. doi: 10.1038/nn.2603. [DOI] [PMC free article] [PubMed] [Google Scholar]
- Loers G, Aboul-Enein F, Bartsch U, Lassmann H, Schachner M. Comparison of myelin, axon, lipid, and immunopathology in the central nervous system of differentially myelin-compromised mutant mice: a morphological and biochemical study. Mol Cell Neurosci. 2004;27:175–189. doi: 10.1016/j.mcn.2004.06.006. [DOI] [PubMed] [Google Scholar]
- Mastellos D, Papadimitriou JC, Franchini S, Tsonis PA, Lambris JD. A novel role of complement: mice deficient in the fifth component of complement (C5) exhibit impaired liver regeneration. J Immunol. 2001;166:2479–2486. doi: 10.4049/jimmunol.166.4.2479. [DOI] [PubMed] [Google Scholar]
- McGrath FD, Brouwer MC, Arlaud GJ, Daha MR, Hack CE, Roos A. Evidence that complement protein C1q interacts with C-reactive protein through its globular head region. J Immunol. 2006;176:2950–2957. doi: 10.4049/jimmunol.176.5.2950. [DOI] [PubMed] [Google Scholar]
- McGreal E, Gasque P. Structure-function studies of the receptors for complement C1q. Biochem Soc Trans. 2002;30:1010–1014. doi: 10.1042/bst0301010. [DOI] [PubMed] [Google Scholar]
- McKerracher L, David S, Jackson DL, Kottis V, Dunn RJ, Braun PE. Identification of myelin-associated glycoprotein as a major myelin-derived inhibitor of neurite growth. Neuron. 1994;13:805–811. doi: 10.1016/0896-6273(94)90247-X. [DOI] [PubMed] [Google Scholar]
- Mukherjee P, Pasinetti GM. Complement anaphylatoxin C5a neuroprotects through mitogen-activated protein kinase-dependent inhibition of caspase 3. J Neurochem. 2001;77:43–49. doi: 10.1046/j.1471-4159.2001.00167.x. [DOI] [PubMed] [Google Scholar]
- Mukhopadhyay G, Doherty P, Walsh FS, Crocker PR, Filbin MT. A novel role for myelin-associated glycoprotein as an inhibitor of axonal regeneration. Neuron. 1994;13:757–767. doi: 10.1016/0896-6273(94)90042-6. [DOI] [PubMed] [Google Scholar]
- Nauta AJ, Bottazzi B, Mantovani A, Salvatori G, Kishore U, Schwaeble WJ, Gingras AR, Tzima S, Vivanco F, Egido J, Tijsma O, Hack EC, Daha MR, Roos A. Biochemical and functional characterization of the interaction between pentraxin 3 and C1q. Eur J Immunol. 2003;33:465–473. doi: 10.1002/immu.200310022. [DOI] [PubMed] [Google Scholar]
- Nepomuceno RR, Henschen-Edman AH, Burgess WH, Tenner AJ. cDNA cloning and primary structure analysis of C1qR(P), the human C1q/MBL/SPA receptor that mediates enhanced phagocytosis in vitro. Immunity. 1997;6:119–129. doi: 10.1016/S1074-7613(00)80419-7. [DOI] [PubMed] [Google Scholar]
- Neumann S, Bradke F, Tessier-Lavigne M, Basbaum AI. Regeneration of sensory axons within the injured spinal cord induced by intraganglionic cAMP elevation. Neuron. 2002;34:885–893. doi: 10.1016/S0896-6273(02)00702-X. [DOI] [PubMed] [Google Scholar]
- Neumann S, Skinner K, Basbaum AI. Sustaining intrinsic growth capacity of adult neurons promotes spinal cord regeneration. Proc Natl Acad Sci U S A. 2005;102:16848–16852. doi: 10.1073/pnas.0508538102. [DOI] [PMC free article] [PubMed] [Google Scholar]
- Nguyen HX, Galvan MD, Anderson AJ. Characterization of early and terminal complement proteins associated with polymorphonuclear leukocytes in vitro and in vivo after spinal cord injury. J Neuroinflammation. 2008;5:26. doi: 10.1186/1742-2094-5-26. [DOI] [PMC free article] [PubMed] [Google Scholar]
- Nguyen T, Mehta NR, Conant K, Kim KJ, Jones M, Calabresi PA, Melli G, Hoke A, Schnaar RL, Ming GL, Song H, Keswani SC, Griffin JW. Axonal protective effects of the myelin-associated glycoprotein. J Neurosci. 2009;29:630–637. doi: 10.1523/JNEUROSCI.5204-08.2009. [DOI] [PMC free article] [PubMed] [Google Scholar]
- Niclou SP, Ehlert EM, Verhaagen J. Chemorepellent axon guidance molecules in spinal cord injury. J Neurotrauma. 2006;23:409–421. doi: 10.1089/neu.2006.23.409. [DOI] [PubMed] [Google Scholar]
- Osaka H, Mukherjee P, Aisen PS, Pasinetti GM. Complement-derived anaphylatoxin C5a protects against glutamate-mediated neurotoxicity. J Cell Biochem. 1999;73:303–311. [PubMed] [Google Scholar]
- Patel SP, Sullivan PG, Lyttle TS, Magnuson DSK, Rabchevsky AG. Acetyl-L-Carnitine treatment following spinal cord injury improves mitochondrial function correlated with remarkable tissue sparing and functional recovery. Neuroscience. 2012;210:296–307. doi: 10.1016/j.neuroscience.2012.03.006. [DOI] [PMC free article] [PubMed] [Google Scholar]
- Peterson SL, Anderson AJ. Complement and spinal cord injury: traditional and non-traditional aspects of complement cascade function in the injured spinal cord microenvironment. Exp Neurol. 2014;258:35–47. doi: 10.1016/j.expneurol.2014.04.028. [DOI] [PubMed] [Google Scholar]
- Qiao F, Atkinson C, Song H, Pannu R, Singh I, Tomlinson S. Complement plays an important role in spinal cord injury and represents a therapeutic target for improving recovery following trauma. Am J Pathol. 2006;169:1039–1047. doi: 10.2353/ajpath.2006.060248. [DOI] [PMC free article] [PubMed] [Google Scholar]
- Qiao F, Atkinson C, Kindy MS, Shunmugavel A, Morgan BP, Song H, Tomlinson S. The alternative and terminal pathways of complement mediate post-traumatic spinal cord inflammation and injury. Am J Pathol. 2010;177:3061–3070. doi: 10.2353/ajpath.2010.100158. [DOI] [PMC free article] [PubMed] [Google Scholar]
- Rahpeymai Y, Hietala MA, Wilhelmsson U, Fotheringham A, Davies I, Nilsson AK, Zwirner J, Wetsel RA, Gerard C, Pekny M, Pekna M. Complement: a novel factor in basal and ischemia-induced neurogenesis. EMBO J. 2006;25:1364–1374. doi: 10.1038/sj.emboj.7601004. [DOI] [PMC free article] [PubMed] [Google Scholar]
- Rogers J, Cooper NR, Webster S, Schultz J, McGeer PL, Styren SD, Civin WH, Brachova L, Bradt B, Ward P, Lieberburg I. Complement activation by beta-amyloid in Alzheimer disease. Proc Natl Acad Sci U S A. 1992;89:10016–10020. doi: 10.1073/pnas.89.21.10016. [DOI] [PMC free article] [PubMed] [Google Scholar]
- Rosenzweig ES, Courtine G, Jindrich DL, Brock JH, Ferguson AR, Strand SC, Nout YS, Roy RR, Miller DM, Beattie MS, Havton LA, Bresnahan JC, Edgerton VR, Tuszynski MH. Extensive spontaneous plasticity of corticospinal projections after primate spinal cord injury. Nat Neurosci. 2010;13:1505–1510. doi: 10.1038/nn.2691. [DOI] [PMC free article] [PubMed] [Google Scholar]
- Roumenina LT, Ruseva MM, Zlatarova A, Ghai R, Kolev M, Olova N, Gadjeva M, Agrawal A, Bottazzi B, Mantovani A, Reid KB, Kishore U, Kojouharova MS. Interaction of C1q with IgG1, C-reactive protein and pentraxin 3: mutational studies using recombinant globular head modules of human C1q A–C Chains. Biochemistry. 2006;45:4093–4104. doi: 10.1021/bi052646f. [DOI] [PMC free article] [PubMed] [Google Scholar]
- Sahu A, Lambris JD. Structure and biology of complement protein C3, a connecting link between innate and acquired immunity. Immunol Rev. 2001;180:35–48. doi: 10.1034/j.1600-065X.2001.1800103.x. [DOI] [PubMed] [Google Scholar]
- Sandvig A, Berry M, Barrett LB, Butt A, Logan A. Myelin-, reactive glia- and scar- derived CNS axon growth inhibitors: expression, receptor signaling, and correlation with axon regeneration. Glia. 2004;46:225–251. doi: 10.1002/glia.10315. [DOI] [PubMed] [Google Scholar]
- Schafer DP, Lehrman EK, Kautzman AG, Koyama R, Mardinly AR, Yamasaki R, Ransohoff RM, Greenberg ME, Barres BA, Stevens B. Microglia sculpt postnatal neural circuits in n activity and complement-dependent manner. Neuron. 2012;74:691–705. doi: 10.1016/j.neuron.2012.03.026. [DOI] [PMC free article] [PubMed] [Google Scholar]
- Schnell L, Schwab ME. Axonal regeneration in the rat spinal cord produced by an antibody against myelin-associated neurite growth inhibitors. Nature. 1990;343:269–272. doi: 10.1038/343269a0. [DOI] [PubMed] [Google Scholar]
- Schnell L, Hunanyan AS, Bowers WJ, Horner PJ, Federoff HJ, Gullo M, Schwab ME, Mendell LM, Arvanian VL. Combined delivery of Nogo-A antibody, neurotrophin-3 and the NMDA-NR2d subunit establishes a functional ‘detour’ in the hemisected spinal cord. Eur J Neurosci. 2011;34:1256–1267. doi: 10.1111/j.1460-9568.2011.07862.x. [DOI] [PMC free article] [PubMed] [Google Scholar]
- Schwab ME, Bartholdi D. Degeneration and regeneration of axons in the lesioned spinal cord. Physiol Rev. 1996;76:319–370. doi: 10.1152/physrev.1996.76.2.319. [DOI] [PubMed] [Google Scholar]
- Shinjyo N, Ståhlberg A, Dragunow M, Pekny M, Pekna M. Complement-derived anaphylatoxin C3a regulates in vitro differentiation and migration of neural progenitor cells. Stem Cells. 2009;27:2824–2832. doi: 10.1002/stem.225. [DOI] [PubMed] [Google Scholar]
- Silver J, Miller JH. Regeneration beyond the glial scar. Nat Rev Neurosci. 2004;5:146–156. doi: 10.1038/nrn1326. [DOI] [PubMed] [Google Scholar]
- Simonen M, Pedersen V, Weinmann O, Schnell L, Buss A, Ledermann B, Christ F, Sansig G, van der Putten H, Schwab ME. Systemic deletion of the myelin-associated outgrowth inhibitor Nogo-A improves regenerative and plastic responses after spinal cord injury. Neuron. 2003;38:201–211. doi: 10.1016/S0896-6273(03)00226-5. [DOI] [PubMed] [Google Scholar]
- Soares S, Barnat M, Salim C, von Boxberg Y, Ravailee-Veron M, Nothias F. Extensive structural remodeling on the injured spinal cord revealed by phosphorylated MAP1B in sprouting axons and degenerating neurons. Eur J Neurosci. 2007;26:1446–1461. doi: 10.1111/j.1460-9568.2007.05794.x. [DOI] [PubMed] [Google Scholar]
- Song H, Ming G, He Z, Lehmann M, McKerracher L, Tessier-Lavigne M, Poo M. Conversion of neuronal growth cone responses from repulsion to attraction by cyclic nucleotides. Science. 1998;281:1515–1518. doi: 10.1126/science.281.5382.1515. [DOI] [PubMed] [Google Scholar]
- Spagnol G, Williams M, Srinivasan J, Golier J, Bauer D, Lebo RV, Latov N. Molecular cloning of human myelin-associated glycoprotein. J Neurosci Res. 1989;24:137–142. doi: 10.1002/jnr.490240203. [DOI] [PubMed] [Google Scholar]
- Starkey ML, Bleul C, Maier IC, Schwab ME. Rehabilitative training following unilateral pyramidotomy in adult rats improves forelimb function in a non-task-specific way. Exp Neurol. 2011;232:81–89. doi: 10.1016/j.expneurol.2011.08.006. [DOI] [PubMed] [Google Scholar]
- Steward O, Sharp K, Yee KM, Hofstadter M. A re-assessment of the effects of a Nogo-66 receptor antagonist on regenerative growth of axons and locomotor recovery after spinal cord injury in mice. Exp Neurol. 2008;209:446–468. doi: 10.1016/j.expneurol.2007.12.010. [DOI] [PMC free article] [PubMed] [Google Scholar]
- Sun X, Wang X, Chen T, Li T, Cao K, Lu A, Chen Y, Sun D, Luo J, Fan J, Young W, Ren Y. Myelin activates FAK/Akt/NF-kappaB pathways and provokes CR3-dependent inflammatory response in murine system. PLoS One. 2010;5:e9380. doi: 10.1371/journal.pone.0009380. [DOI] [PMC free article] [PubMed] [Google Scholar]
- Tissot B, Daniel R, Place C. Interaction of the C1 complex of complement with sulfated polysaccharide and DNA probed by single molecule fluorescence microscopy. Eur J Biochem. 2003;270:4714–4720. doi: 10.1046/j.1432-1033.2003.03870.x. [DOI] [PubMed] [Google Scholar]
- Van Schravendijk MR, Dwek RA. Interaction of C1q with DNA. Mol Immunol. 1982;19:1179–1187. doi: 10.1016/0161-5890(82)90328-5. [DOI] [PubMed] [Google Scholar]
- Wang KC, Koprivica V, Kim JA, Sivasankaran R, Guo Y, Neve RL, He Z. Oligodendrocyte-myelin glycoprotein is a Nogo receptor ligand that inhibits neurite outgrowth. Nature. 2002;417:941–944. doi: 10.1038/nature00867. [DOI] [PubMed] [Google Scholar]
- Wanner IB, Anderson MA, Song B, Levine J, Fernandez A, Gray-Thompson Z, Ao Y, Sofroniew MV. Glial scar borders are formed by newly proliferated, elongated astrocytes that interact to corral inflammatory and fibrotic cells via STAT3-dependent mechanisms after spinal cord injury. J Neurosci. 2013;33:12870–12886. doi: 10.1523/JNEUROSCI.2121-13.2013. [DOI] [PMC free article] [PubMed] [Google Scholar]
- Watson C, Paxinos G, Kayalioglu G. The Spinal Cord: A Christopher and Dana Reeve Foundation Text and Atlas: Elsevier Science. 2009 [Google Scholar]
- Weiss MD, Luciano CA, Quarles RH. Nerve conduction abnormalities in aging mice deficient for myelin-associated glycoprotein. Muscle Nerve. 2001;24:1380–1387. doi: 10.1002/mus.1159. [DOI] [PubMed] [Google Scholar]
- Woolf CJ, Reynolds ML, Molander C, O'Brien C, Lindsay RM, Benowitz LI. The growth-associated protein GAP-43 appears in dorsal root ganglion cells and in the dorsal horn of the rat spinal cord following peripheral nerve injury. Neuroscience. 1990;34:465–478. doi: 10.1016/0306-4522(90)90155-W. [DOI] [PubMed] [Google Scholar]
- Wörter V, Schweigreiter R, Kinzel B, Mueller M, Barske C, Böck G, Frentzel S, Bandtlow CE. Inhibitory activity of myelin-associated glycoprotein on sensory neurons is largely independent of NgR1 and NgR2 and resides within Ig-Like domains 4 and 5. PLoS One. 2009;4:e5218. doi: 10.1371/journal.pone.0005218. [DOI] [PMC free article] [PubMed] [Google Scholar]
- Wyss-Coray T, Mucke L. Inflammation in neurodegenerative disease–a double-edged sword. Neuron. 2002;35:419–432. doi: 10.1016/S0896-6273(02)00794-8. [DOI] [PubMed] [Google Scholar]
- Yang Y, Liu Y, Wei P, Peng H, Winger R, Hussain RZ, Ben LH, Cravens PD, Gocke AR, Puttaparthi K, Racke MK, McTigue DM, Lovett-Racke AE. Silencing Nogo-A promotes functional recovery in demyelinating disease. Ann Neurol. 2010;67:498–507. doi: 10.1002/ana.21935. [DOI] [PMC free article] [PubMed] [Google Scholar]
- Yin X, Crawford TO, Griffin JW, Tu Ph, Lee VM, Li C, Roder J, Trapp BD. Myelin-associated glycoprotein is a myelin signal that modulates the caliber of myelinated axons. J Neurosci. 1998;18:1953–2015. doi: 10.1523/JNEUROSCI.18-06-01953.1998. [DOI] [PMC free article] [PubMed] [Google Scholar]
- Yonemasu K, Kitajima H, Tanabe S, Ochi T, Shinkai H. Effect of age on C1q and C3 levels in human serum and their presence in colostrum. Immunology. 1978;35:523–530. [PMC free article] [PubMed] [Google Scholar]
- Ziccardi RJ, Tschopp J. The dissociation properties of native C1. Biochem Biophys Res Commun. 1982;107:618–623. doi: 10.1016/0006-291X(82)91536-4. [DOI] [PubMed] [Google Scholar]