

Abstract
A novel strategy to finely control a large metabolic flux by using a “metabolic transistor” approach was established. In this approach a small change in the level or availability of an essential component for the process is controlled by adding a competitive reaction that affects a precursor or an intermediate in its biosynthetic pathway. The change of the basal level of the essential component, considered as a base current in a transistor, has a large effect on the flux through the major pathway. In this way, the fine-tuning of a large flux can be accomplished. The “metabolic transistor” strategy was applied to controlling electron transfer chain function by manipulation of the quinone synthesis pathway in Escherichia coli. The achievement of a theoretical yield of lactate production under aerobic conditions via this strategy upon manipulation of the biosynthetic pathway of the key participant, ubiquinone-8 (Q8), in an E. coli strain provides an in vivo, genetically tunable means to control the activity of the electron transfer chain and manipulate the production of reduced products while limiting consumption of oxygen to a defined amount.
Keywords: Escherichia coli, metabolic transistor, electron transfer chain, quinone, lactate, oxygen
1. Introduction
Oxygen is an effective electronic acceptor and can provide a significantly higher ATP/glucose yield (more than 30 ATP per glucose under aerobic conditions vs only 2 ATP from the glycolysis pathway under anaerobic conditions). Aerobic cultures are therefore in general more robust than their anaerobic counterpart. However, since NADH is being consumed in the electron transfer chain (ETC), the intracellular NADH/NAD+ ratio has been shown to decrease significantly with increasing culture dissolved oxygen levels (Shalel-Levanon et al, 2005). Hence, these opposing trends impose conflicting demands: a robust culture for rapid cell growth to achieve high biomass and high cell energetics under aerobic metabolism, and the opposing demand for NADH in product formation. Microaerobic conditions have thus been shown experimentally and theoretically to improve performance of a number of bioproduction systems. However, it is difficult to maintain a set dissolved oxygen level in a large scale production environment due to incomplete mixing. As part of its ability to adapt to different growth conditions E. coli alters the composition of its respiratory system. The three types of respiratory components are: 1) dehydrogenases, which carry out the oxidation of organic substrates and feed electrons into the mobile quinone pool, 2) quinones, which deliver reducing equivalents to the terminal oxidoreductases, and 3) oxidoreductases, which reduce the terminal electron acceptors (Figure 1) (Gennis and Stewart, 1996). The ETC of E. coli is composed of membrane-anchored dehydrogenases that reduce the quinone pool (ubiquinone-8, Q8) under respiratory conditions. Of these, the nuo and ndh pathways are most important in aerobic conditions. The quinone redox state is sensed by the ArcB protein and through phosphorylation of the transcriptional regulator ArcA, expression of genes of the TCA cycle and the electron transport chain are adjusted to modify the cell’s respiration vs fermentative metabolism. The amount of each component is strictly regulated to optimize the respiratory chain according to the substrates present and the physiological needs of the cell. One important function of the respiratory chain is the maintenance of redox balance and the regeneration of NAD+ from NADH. Under aerobic growth E. coli normally makes two different NADH dehydrogenases, NAD I and NAD II, and two different terminal oxidases, cytochrome bo3 and cytochrome bd. The electron flux through these enzymes is dependent on the concentrations of the enzyme in the membrane, the NADH, quinone, and oxygen concentrations, and the steady state characteristics of the enzymes (i.e. Vmax and Km values for NADH, quinone and oxygen).
Fig. 1.

Metabolic pathways and the respiratory chain of Escherichia coli, including the central aerobic pathway, ubiquinone synthesis pathway, and introduced synthetic pathways. idi, IPP isomerase; ispA, geranyl/farnesyl diphosphate synthase; ispB, octaprenyl diphosphate synthase; ubiA, 4-hydroxybenzoate octaprenyltransferase; ubiD, decarboxylase catalyzing the decarboxylation of 4-hydroxy-3-octaprenyl-benzoate; ubiX, similar to ubiD, decarboxylase catalyzing the decarboxylation of 4-hydroxy-3-octaprenyl-benzoate; ubiE, C-methyltransferase; ubiG, O-methyltransferase; crtE, geranylgeranyl diphosphate synthase; crtB, phytoene synthase; crtI, phytoene desaturase; lepgt, geranyl diphosphate:4-hydroxybenzoate 3-geranyltransferase. IPP, isopentenyl diphosphate; DMAPP, dimethylallyl diphosphate; GPP, geranyl diphosphate; GGPP, geranylgeranyl diphosphate; 4-HB, 4-hydroxybenzoate; G-4-HB, geranyl-4-hydroxybenzoate.
Too much respiration and oxidation of carbon substrates, while being beneficial for cell energetics and usually for growth rate, leads to loss of carbon that does not go into product, especially if a reduced product is desired. Many reduced products of commercial interest, such as fuel molecules, are compounds more reduced than glucose, and many chemical intermediates for pharmaceuticals, lactate or monomers for making polymers, fatty acids, etc also require reduction reactions and similarly optimal formation of these molecules requires limiting oxidation of the feedstock for a high yield process. E. coli cells regenerate NAD+ and generate proton motive force for ATP production through the respiratory chain. One way to reduce the activity of ETC and thus the amount of oxygen used is reducing the cytochrome protein levels (Hayashi et al., 2012; Koch-Koerfges et al., 2013; Portnoy et al., 2008; Portnoy et al., 2010); another way is to control the level of quinone by inactivating its biosynthetic pathway and adding different amounts of an analog of quinone back to the culture, such as coenzyme Q1 (Zhu et al., 2011).
In cell metabolism, due to efficiency and cost concerns, it is desired to control a large flux using a controller that can be regulated at an appropriate level either at a defined fixed level or at a feedback controlled response level. At the genetic level, synthetic biology “gene circuit” approaches have allowed control of cell responses to exogenous parameters such as inducer levels, light or cell formed substances in feedback loops using repressors, activators, inverters, or RNA responsive elements (Brophy and Voigt, 2014; Nielsen et al., 2013; Olson et al., 2014).
Different from “gene circuits”, we propose a new “metabolic transistor” strategy based on network topology around the biosynthetic pathway, that involves introducing additional nodes where flow through the biosynthetic pathway, can be controlled by regulating the partitioning at these newly introduced nodes. Thus by affecting the level of the small molecule which is present at only a low intracellular level normally, a large flux can be controlled if the regulated level can be finely controlled around the threshold level. Quinones are lipid-soluble molecules that mediate electron transfer between NADH or FADH dehydrogenases and cytochrome oxidases. The major substrate precursor compounds of ubiquinone synthesis are polyprenyl diphosphate which is formed by a combination of multiple units of IPP by polyprenyl diphosphate synthase, and 4-hydroxybenzoic acid (4-HB) (Figure 1). Our strategy, which can control the level of oxidation via the ETC, involves regulating the production of the ubiquinone by competing for an intermediate within the biosynthetic pathway. One approach of the strategy uses the lycopene synthesis pathway to drain IPP, which is the substrate of the polyprenyl side chain of the ubiquinone synthesis pathway (Figure 1). Another approach uses a route employing reaction of the geranyl diphosphate:4-hydroxybenzoate geranyltransferase from Lithospermum erythrorhizon (lePGT-1) to drain both IPP and 4-HB (Figure 1). The current study aimed at manipulating cell respiration based on controlling the synthesis of ubiquinone so that cell metabolism can be precisely manipulated e.g. via regulation of the availability of the quinone accordingly through the “metabolic transistor” approach. This kind of control will have the effect of lowering the level of the small molecule, ubiquinone, from its normal level of 100% to reduced levels depending on the effective partitioning of the intermediate at the introduced node. To examine the potential of fine turning the respiration chain for reduced product formation in the presence of air, we used the production of lactate as the model system, which served as a NADH sink under the experimental aerobic conditions. A theoretical yield of lactate production under aerobic conditions was achieved via the “metabolic transistor” strategy based E. coli strains. It provides a genetic means to control the activity of the electron transfer chain in vivo and manipulate intracellular NADH availability and allow controlled production of reduced products.
2. Materials and methods
2.1 Strains and Plasmids
The strains and plasmids used in this study are described in Table 1. The E. coli strains MG1655 and JW2308-4 were obtained from Coli Genetic Stock Center (CGSC). The ubiX knockout strain based on MG1655 was created using the one-step inactivation method of Datsenko and Wanner (2000), and named HW101. The mutant strain was verified with genomic PCR after construction to ensure that the ubiX gene had been deleted. The pACLyco, based on pACYC184, contains the carotenoid biosynthesis genes crtE, crtB, and crtI from Erwinia herbicola, which encode geranylgeranyl diphosphate synthase, phytoene synthase, and phytoene desaturase, respectively (Cunningham et al. 1994). The gene encoding the geranyl diphosphate:4-hydroxybenzoate geranyltransferase gene from Lithospermum erythrorhizon (lePGT-1) was synthesized and cloned into the vectors pTrc99a and pBAD33, respectively, and designated as plasmids pTrc-lePGT and pBlePGT.
Table 1.
List of strains and plasmids used in this study.
| Strains and plasmids | Relevant genotype or description | Source or reference |
|---|---|---|
| Strain | ||
| MG1655 | F− lambda− ilvG− rfb− rph− | Coli Genetic Stock Center (CGSC) |
| HW101 | MG1655 ΔubiX− | This study |
| JW2308-4 | BW25113 ΔubiX::kan | Coli Genetic Stock Center (CGSC) |
| Plasmids | ||
| pACYC184 | Cm resistant, Tc resistant | Chang and Cohen, (1978) |
| pACLyco | pACYC184 carries crtE, crtI, and crtB from Erwinia herbicola | Cunningham et al. (1994) |
| pBAD33 | cloning vector, Cm resistant, pACYC18 origin vector | Guzman et al. (1995) |
| pBlePGT | pBAD33 carries a geranyl diphosphate:4-hydroxybenzoate geranyltransferase from Lithospermum erythrorhizon (lePGT-1) | This study |
| pTrc99a | cloning vector, Amp resistant, ColE1 origin vector | Amersham Pharmacia |
| pTrc-lePGT | pTrc99a carries a geranyl diphosphate:4-hydroxybenzoate geranyltransferase from Lithospermum erythrorhizon (lePGT-1) | This study |
2.2 Media
The media for strain development and preculture of fermentation inoculum was Luria-Bertani Broth (LB) (per liter: tryptone 10 g, yeast extract 5 g, sodium chloride 10 g). The fermentation medium contained (per liter): glucose 20 g (around 110 mmol), tryptone 10 g, yeast extract 5 g, Na2HPO4 9.8 g, KH2PO4 4.2 g sodium chloride 5 g. The initial pH of the fermentation medium was 7.0. Antibiotics were included at the following concentrations (mg per liter): kanamycin 30, and chloramphenicol 34.
2.3 Culture conditions
During the construction of strains and plasmids, cultures were usually grown at 37°C in LB medium. Temperature was changed to 30°C or 42°C depending on the protocol of the one-step gene inactivation method of Datsenko and Wanner (2000). In the fermentation experiments, the preculture was prepared by inoculating a single colony from a freshly grown plate in 5 mL of LB medium in an orbital shaker (New Brunswick Scientific, NJ) operated overnight at 250 RPM and 37°C. The inoculation size was 1%. The expression of lePGT-1 from the plasmids, pTrc-lePGT and pBlePGT, was induced by adding different concentrations of isopropyl-β-D-thiogalactopyranoside (IPTG) and arabinose, respectively. The cells were then cultivated in an orbital shaker (New Brunswick Scientific, Edison, NJ) operated at 250 RPM and 30 °C. All experiments were carried out in triplicate.
2.3 Analytical methods
Cell density was estimated by measurement of the optical density of appropriately diluted culture samples at 600 nm (Beckman Coulter DU 800 UV/Vis Spectrophotometer, Beckman Coulter, Inc., Fullerton, CA); the culture was diluted to the linear range with 0.95% (W/V) NaCl. Previously established HPLC methodology was used to analyze glucose and the extracellular metabolites (Dittrich et al., 2005; Lin et al., 2005). Briefly, 1 mL of culture was centrifuged and the supernatant was then filtered through a 0.22-μm syringe filter for HPLC analysis. The HPLC system (Shimadzu-10A Systems, Shimadzu, Colombia, MD) used was equipped with a cation-exchange column (HPX-87H, BioRad Labs, Hercules, CA), a UV detector (Shimadzu SPD-10A, Shimadzu, Colombia, MD) and a differential refractive index (RI) detector (Waters 2410, Waters, Milford, MA). A mobile phase of 2.5 mM H2SO4 solution at a 0.5mL/min flow rate was used and the column operated at 55 °C. Metabolites such as glucose, acetate, ethanol and lactate were measured by a RI detector and pyruvate was measured by a UV detector at 210nm.
2.4 Quinone extraction and quantification
Microbial quinones were extracted from 20 mL of cultured E. coli cells (OD600 = 1.0± 0.2) that were immediately quenched with 28mL of aqueous 60% methanol (v/v) HEPES buffered (70mM pH 6.8) solution maintained at −40 °C. The quenched biomass was spun down at 6500 rpm (5432×g) (5min, −9 °C). The cell pellets were resuspended in 1.0 mL of LC-MS grade water, sonicated for 3 minutes at 4°C at an amplitude of 75 with 30 second Pulse ON/OFF. Quinones were extracted from broken cells with 3 mL of chloroform-methanol (2:1) mixture. The cell pellets were extracted again twice. Cell extracts were vortexed for 2 minutes, centrifuged at 7000 rpm for 10 min which allowed separation into two layers. The lower layer (chloroform-methanol) was collected. The chloroform-methanol extract was dried under a stream of N2. To remove impurities from the crude dried quinone extract, 2 mL of water was added and the samples were re-extracted twice with 5 mL of hexane. The collected hexane layer was passed through anhydrous sodium sulfate, and dried under a stream of N2. Finally, the dried quinone extract was reconstituted in 100 μL methanol before LC-MS analysis.
Preparation of standard solution: The amounts of Q8 in samples were quantified by comparing the peak area with a known concentration of a standard Q8 purchased from Sigma-Aldrich (St. Louis, MO). Seven working Q8 standard solutions (10, 50, 100, 250, 500, 1000 and 2000 ng/mL) were prepared from a stock solution (0.22 mg/mL) by dilution with methanol. The working Q8 standard solutions were used to generate a calibration curve and unknown amounts of Q8 in samples were estimated using a calibration curve. Q8 was confirmed by retention time index and MS/MS fragmentation pattern.
Chromatographic separation was performed using reverse phase on a Phenomenex C18(2) Luna column: 150 × 2 mm, 5 μm particle size that was equilibrated with 50% mobile phase A (0.1% formic acid in H2O) and 50% mobile phase B (0.1% formic acid in acetonitrile) using a Shimadzu UPLC system (Shimadzu, Colombia, MD). The column and the autosampler were maintained at a temperature of 25°C and 4°C respectively. Elution was performed under isocratic conditions with 80:20 (Methanol: isopropanol plus 10mM ammonium acetate) mobile phase at a flow rate of 0.3 ml/min for a 60 minute runtime. The Shimadzu UPLC was connected to an IT-TOF-MS (Shimadzu, Colombia, MD) through an electrospray ionization source (ESI). The automated system ensured reproducible loading of samples using a LC-autosampler.
The mass spectrometer was calibrated externally using LC-MS high purity sodium trifluoroacetate (NaTFA) solution in both positive and negative mode. After calibration, high resolution was obtained with mass accuracy less than 10 ppm and ion intensity above 2,000. MS settings were as follows: Interface voltage (kV) 4.5 and −3.5 in positive and negative mode respectively. Interface temperature: 450°C, CDL temperature: 250°C, Nebulizing gas flow: 1.5L/min and heat block temperature: 250°C. LCMS Solution (version 3.60 3.61) software was used for data acquisition and LC-MS operations. A full mass scan (MS1) for 500–1000m/z and 50–600m/z ranges was obtained for both positive and negative mode. Each full mass scan cycle of 3.87 seconds included one MS scan and two events of MS/MS scans triggered by threshold intensity. Ions were accumulated for 30msec or until TIC=50,000 and former target ions were excluded for 10 seconds. Automatic collision energy and MS/MS accumulation were also applied during MS/MS acquisition.
3. Results and discussion
3.1 Controlling ETC by introducing the lycopene synthesis pathway in E. coli strains with different genetic backgrounds
In previous studies, it was demonstrated that 1 mol of lycopene (C40) needed 8 mol of IPP (C5) (Figure 1) (Farmer et al., 2000; Alper et al., 2005; Vadali et al., 2005). However, 1 mol of the octaprenyl tail of ubiquinone, coenzyme Q8, is synthesized by 1 mol of GPP and 6 mol of IPP by octaprenyl diphosphate synthase (ispB) (Lee et al., 2008) (Figure 1). This demand for IPP means that the lycopene synthesis pathway plays as a competing pathway on the coenzyme Q8 synthesis. The effect of introducing the lycopene synthesis pathway into E. coli strains to drain isopentenyl diphosphate (IPP) was first investigated. In the Q8 biosynthesis pathway, there are two genes that encode 3-octaprenyl-4-hydroxybenzoate carboxylase, ubiD and ubiX (Zhang and Javor, 2000; Gulmezian et al., 2007). The fact that each single mutation of ubiD and ubiX reduces biosynthesis of Q8 in Escherichia coli to 20–25% of the level in the WT strain suggests a complexity beyond a role as independent isofunctional decarboxylases (Leppik et al., 1976; Gulmezian et al., 2007). The reduced Q8 biosynthesis strains with ubiX mutant were used as the host strains for further investigation. Three strains, MG1655 (parent strain), HW101(ubiX−, MG1655 based), and JW2308-4(ubiX−, BW25113 based, from the Keio collection) carrying pACYC184 or pACLyco plasmid, were used in this study. The data of metabolite production, glucose consumption, the cell density, and yield of lactate production are summarized in Fig 2. The culture operations were under normal aerobic conditions, since no formic acid and succinic acid were detected in any of the cultures. This result further indicates that the pyruvate formate lyase (PFL) was not functioning under the experimental aerobic conditions. Furthermore, the phenomena that production of fermentation product, lactate, as a sole reductive by-product reflects that the majority of the NADH was consumed though producing lactate by lactate dehydrogenase rather than the regular ETC (Portnoy et al., 2008; Portnoy et al., 2010).
Fig. 2.

Metabolite and biomass accumulated profiles in aerobic cultures of MG1655(pACYC184), MG1655(pACLyco), HW101(pACYC184), HW101(pACLyco), and JW2308-4(pACLyco). The concentrations of (A) lactate, (B) acetate, (C) glucose remaining in the culture, (D) cell density (OD600). The lactate yields at the time point of the highest concentration of lactate of each strain (E). All measurements were done in triplicate.
The highest concentrations of lactate in strains MG1655(pACYC184) and MG1655(pACLyco) were similar, about 16 mM, while in HW101(pACYC184), HW101(pACLyco), JW2308-4(pACYC184), and JW2308-4(pACLyco) the lactate level reached 26.9, 40.6, 49.2 and 102 mM, respectively (Figure 2A). Introducing the lycopene synthesis pathway in to the WT strain MG1655, seemed to have no effect on turning down its ETC. The lactate production profile of MG1655(pACYC184) and MG1655(pACLyco) changed little. It indicated the intracellular pool of Q8 in these two strains was efficient enough for full operation of the ETC. The additional ubiX mutation of MG1655 further turned down its ubiquinone synthesis and the activity of ETC. The yield of lactate at the time points of the highest lactate concentrations also indicated the changes of the activity of ETC in different engineered strains. The lactate yield in HW101(pACYC184) reached 1.77 times that of MG1655(pACYC184). The HW101(pACLyco) strain carrying the plasmid of lycopene synthesis pathway produced the highest lactate yield among these MG1655 based strains, 1.60 mol/ mol glucose, about 3.11 times that of MG1655(pACYC184). Furthermore, the theoretical yield of lactate was also achieved in JW2308-4(pACLyco) (around 2 mol/mol glucose) which was 70.3% higher than that of the control strain, JW2308-4(pACYC184) (around 1.18 mol/mol glucose) (Figure 2E). The lactate was re-consumed at later times in strains MG1655(pACYC184), MG1655(pACLyco), HW101(pACYC184), HW101(pACLyco), and JW2308-4(pACYC184), while it changed little in JW2308-4(pACLyco) (Fig 2A). Since the concentrations of lycopene produced by the strains contained lycopene biosynthesis pathway were less than 1 mg/L (Data not shown), the main by-products of glucose consumption and lactate reconsumption were acetate and CO2. Acetyl CoA, the substrate for the citric acid cycle can be produced either by the pyruvate dehydrogenase complex or by pyruvate formate lyase. The pyruvate dehydrogenase complex, is strongly inhibited by ATP, acetyl-CoA, and NADH, the products of the reaction catalyzed by the complex (Nelson and Cox, 2000). The PFL protein, encoded by pflB, is inactive without activator. The protein is activated by the PFL activase (encoded by pflA) and deactivated by AdhE (Kessler et al., 1991). The active form of the PFL protein is sensitive to oxygen, and the effect of oxygen is irreversible. However, the YfiD protein can reactivate the PFL protein even after the irreversible effect of oxygen (Wagner et al., 2001; Wybron et al., 2002; Levanon et al., 2005. Zhu et al., 2007). In addition, the yfiD gene is expressed at low oxygen concentration and its expression is under control of the FNR regulator (Wybron et al., 2002). Under low oxygen conditions, the cell has high intracellular NADH concentration repressing the activity of PDH (Zhu and Shimizu, 2004), and resulting in lactate accumulation as the major pathway for pyruvate metabolism. In the strain JW2308-4(pACLyco), it indicated the activity of PDH was inhibited resulting in intracellular pyruvate accumulation, and the pyruvate was further reduced to lactate by lactate dehydrogenase.
The effect of exogenous supplementation of ubiquinone-1 (Q1) to the strain JW2308-4(pACLyco), whose ETC seemed to be totally blocked due to lacking ubiquinone, was also investigated. Different quantities of Q1 were added into the media of JW2308-4(pACLyco) at the beginning of the aerobic culture. The results are shown in Fig 3. Interestingly, the result showing a changing trend of lactate accumulation and cell growth were similar to the previous Q1 supplemental study of AMS001 (Zhu et al., 2011.). Upon increasing the concentration of Q1 supplement, the final optical densities were increased, while the yields of lactate accumulated were reduced (Fig. 3). The reduction in lactate formation suggested that the cells partially used oxygen as the electron acceptor though the ETC, while the effective concentration of Q8 was still below the threshold limiting condition. It also indicated that Q1 addition could increase the effective electron carrier in the ETC of E. coli.
Fig. 3.

The effect of exogenous addition of ubiquinone-1 to JW2308-4(pACLyco). (A) cell density (OD600), (B) the lactate yield.
3.2 Fine-turning expression of lePGT-1 to control the ETC in wild type E. coli MG1655
In a previous study, it was demonstrated that lePGT-1 had strict substrate specificity for geranyl diphosphate and 4-HB to form geranyl-4-HB (G-4HB) which was not involved in further steps of ubiquinone biosynthesis (Yazaki et al., 2002; Ohara et al., 2009; Ohara et al., 2013). Geranyl diphosphate (GPP) is synthesized from dimethylallyl diphosphate and IPP by geranyl diphosphate synthase, thus 2 mol of IPP can convert to 1mol of GPP. Hence, the reaction catalyzed by lePGT-1 also plays as a competing pathway on the substrates of the Q8 synthesis pathway, namely at IPP and 4-HB, and introduction of this new node could affect the flow through the Q8 biosynthetic pathway and affect the level of ubiquinone.
In this experiment, the lePGT-1 gene was synthesized and cloned into the expression vector, pTr99a, to form pTrc-lePGT. The fine-tuning of the expression of lePGT-1 in wild type E. coli MG1655 to control the ETC was investigated by adding different concentrations of IPTG, 40, 60, 80, 100, 200, 500, and 1000μM, which would induce the level of expression of lePGT-1 to various extents in fully aerobic conditions. The culture without IPTG was used as the control. The data of the metabolite production, glucose consumption, cell density, and yield of lactate production are summarized in Fig 4.
Fig. 4.

Metabolite and biomass accumulated profiles of MG1655(pTrc-lePGT) in different concentrations of IPTG addition. (A) lactate, (B) acetate, (C) glucose remaining in the culture, (D) cell density (OD600). The lactate yields at the time point of the highest concentration of lactate of each strain (E). All measurements were done in triplicate.
The measured parameters of glucose consumption, lactate and acetate production were similar between the conditions of adding 0 and 40 μM concentrations of IPTG. A great response in controlling the metabolic flux of lactate production was shown when a concentration of more than 40 μM of IPTG was applied in the fully aerobic condition. In the conditions of 40, 60, 80, 100, 200, 500 and 1000 μM of IPTG, the concentration of lactate accumulating in the culture at 24 hours increased from 0 mM to about 58.2 mM (Figure 4A), while the concentration of acetate decreased from 103 to 47.8 mM (Figure 4B). The final optical densities were decreased followed by the increasing of expression of lePGT-1. However, the glucose consumption changed little among the different conditions. Lactate can be re-consumed when the concentration of IPTG in the culture was below 200 μM. The yields of lactate at the time points of the highest lactate concentrations also changed dramatically when the concentration of IPTG was increased from 40 to 200μM, and remained at a similar level when the concentration of IPTG was higher than 200μM, about 1.36 mol lactate/mol glucose (Figure 4E).
The Q8, which serves to deliver reducing equivalents between electron donors, such as NADH dehydrogenase (NDH), succinate dehydrogenase (SDH), and terminal electron acceptors, such as cytochrome oxidases or reductases (Fig. 1), is an essential element under aerobic respiratory conditions (Aussel et al., 2014.). Since the concentrations and yields of lactate changed little when the concentration of IPTG was higher than 200μM, the intracellular Q8 concentrations of MG1655(pTrc-lePGT) in five different IPTG concentrations, 0, 40, 80, 100, and 200μM, were investigated to demonstrate the effect of lePGT-1 expression on Q8 biosynthesis and further on lactate production. Without induction of lePGT-1 expression, the concentration of Q8 was 1.28 nmol/mg CDW, which was highest among these conditions. After adding 40μM of IPTG, the concentration of Q8 dropped dramatically, and reached only 22.6% of that of without induction, however the lactate production profile seemed to be similar as the control. In the condition of adding 80μM of IPTG, only 0.012 nmol/mg CDW of Q8 accumulated in the cell, and the highest concentration of lactate was 2.64 times of that without adding IPTG. Interestingly, further increasing the concentration of IPTG changed little on the concentration of intracellular Q8, although it still had effect on the increasing the lactate accumulation. We speculated that the levels of intracellular Q8 biosynthesis were still controllable while the values of intracellular Q8 analyzed under those conditions were near the detectible limit levels.
3.3 Further fine-tuning expression of lePGT-1 to control the ETC in an E. coli strain with reduced quinone synthesis activity
To further limit the substrates for Q8 synthesis, the ubiX mutant strain, which already has reduced the biosynthesis of Q8 in E. coli to 20–25% of the level of the wild type strain, was used as the host strain. However, the expression strength of lePGT-1 from pTrc-lePGT seemed to be too strong to allow survival of HW101 (pTrc-lePGT) under fully aerobic conditions and the growth of HW101 (pTrc-lePGT) was unstable (data not shown). Thus, the lePGT-1 was moved to a low copy number plasmid, pBAD33, named as pBlePGT. The further fine-tuning of the expression of lePGT-1 in HW101 to control the ETC was investigated by adding different concentrations of inducer (arabinose), 0, 5, 10, 12, 16, 20, and 50mM. The data of metabolite production, glucose consumption, the cell density, and yield of lactate production are summarized in Fig 6.
Fig. 6.

Metabolite and biomass accumulated profiles of HW101(pBlePGT) in different concentrations of IPTG addition. (A) lactate, (B) acetate, (C) glucose remaining in the culture, (D) cell density (OD600). The lactate yields at the time point of the highest concentration of lactate of each strain (E). All measurements were done in triplicate.
The changing trends of lactate production, acetate accumulation, and cell growth of HW101 (pBlePGT) in different concentrations of arabinose during the aerobic culture were similar to the experiments performed in the MG1655(pTrc-lePGT). The lactate was reconsumed in the conditions of adding 0, 5, 10, and 12mM of arabinose rather than remaining at the same concentration for the rest of the fermentation as is found in the conditions of 16, 20, and 50 mM of arabinose (Figure 6A). When the concentration of arabinose was higher than 20 mM, the HW101 (pBlePGT) produced similar high level of lactate. In the conditions of adding 20 and 50 mM arabinose, the concentrations of lactate at 24 hours were 85.2 and 86.3, respectively (Figure 6A). Interestingly, the yields of lactate in both conditions reached the theoretical yield under fully aerobic conditions (around 2 mol lactate/mol glucose), with values 1.48 times of that of MG1655(pTrc-lePGT) in the condition of adding 200 μM IPTG. The concentration of accumulated acetate decreased from 86.6 to 10.8 mM (Figure 6B). The lowest acetate concentration of HW101 (pBlePGT) was only 22.6% of that in MG1655(pTrc-lePGT) (47.8 mM). The ETC of HW101 (pBlePGT) was totally blocked upon adding 20 and 50 mM arabinose.
The blocking of the ETC can also be achieved by knockout of the genes encoding the cytochrome proteins, cytochrome oxidase bd (cydAB), cytochrome oxidase bo (cyoABCD), putative cytochrome oxidase (cbdAB), and a quinol monooxygenase gene (ygiN) in E. coli (Portnoy et al., 2010). However, this method cannot fine-tune the activity of ETC for further controlling the carbon flux. It also needs adaptive evolution to achieve the ability of lactate production in the mutant strain. In our study, by affecting the low intracellular level of Q8 of E. coli, the large carbon flux from glucose can be controlled leading to changes in the ratios of lactate, acetate and CO2 (Fig. 7).
Fig. 7.

The “metabolic transistor” strategy based on fine-tuning of gene expression of lePGT-1 to control the activity of the ETC and redistribute the metabolic fluxes.
3.4 Behavior of carbon burnt or CO2 released
To further clarify the impact of the two “metabolic transistor” strategies on the flux portioning at the pyruvate node, the carbon burnt which refers to the difference between glucose consumption and metabolite accumulation, and which can also be attributed to CO2 released from the culture, was investigated. The amounts of carbon burnt were calculated at the time points of highest lactate accumulation during the cultivation. To simplify the estimation, the biomass was assumed to derive from the LB medium, and the glucose supplemented was assumed to be mainly used for energy generation and metabolite production giving rise to lactate, acetate and CO2. Under this condition, most of the CO2 came from the TCA cycle and little CO2 can be produced through the oxidative pentose phosphate pathway (Zhu et al., 2011). The calculated results of these three sets of experiments are shown in Fig 8.
Fig. 8.

Impact of controlling the ETC by the “metabolic transistor” strategy on the proportion of “carbon burnt” by these engineered strains under fully aerobic conditions. Carbon burnt refers to the difference between glucose consumption carbon and metabolite carbon accumulation, which can be attributed to CO2 released from the culture. The values were calculated at the time points with highest lactate concentrations. (A) the strategy of introducing a lycopene synthesis pathway in different background strains, (B) expression of lePGT-1 in MG1655 with different concentrations of IPTG, (C) expression of lePGT-1 in HW101 with different concentrations of arabinose.
In the strategy of introducing the lycopene synthesis pathway in E. coli, the proportion of carbon burnt by MG1655(pACLyco) reached 36.7% and changed little compared to the control strain, MG1655(pACYC184) (Fig 8A). The fermentation and carbon burnt results suggested that the strength of draining the intermediates of Q8 biosynthesis pathway by the lycopene synthesis was not strong enough to interfere with the ETC activity of the wild type MG1655. The manipulation of knockout ubiX reduced the Q8 production and affected the ETC activity. The proportion of carbon burnt by the ubiX mutant strain, HW101(pACYC184), reduced to 28.2%. In addition, introducing the lycopene synthesis pathway into HW101 can further reduce the carbon burnt to 11.8%. The same strategy was applied on the E. coli strain BW25113 to form JW2308-4(pACYC184) and JW2308-4(pACLyco). Only 9.84% of carbon was burnt to CO2 by JW2308-4(pACYC184), interestingly, no carbon was burnt through the TCA cycle and the theoretical yield of lactate was produced by JW2308-4(pACLyco) under fully aerobic condition. The carbon burnt of MG1655(pTr-lePGT) changed dramatically upon increasing the concentration of IPTG. However, when the concentration of IPTG reached more than 100 μM, the carbon burnt maintained at the similar level, about 11% (Fig 8B). An interesting observation is that the trend of the Q8 concentration of MG1655(pTr-lePGT) under different IPTG concentrations, reflecting the changing of ETC activity, seemed to be similar as the trend of carbon burnt (Fig 5). Further fine-tuning expression of lePGT-1 (pBlePGT) in HW101, a strain with reduced quinone synthesis activity, were also evaluated. Zero carbon burnt was achieved when the concentration of arabinose was 20 and 50 mM. Almost all of the carbon flux from glucose turned to lactate rather than acetate and CO2. It indicated that the ETC activities of JW2308-4(pACLyco) and HW101(pBlePGT) with high concentrations of inducer were completely shut down, and the NADH in both of the strains were consumed by the lactate dehydrogenase rather than the ETC.
Fig. 5.
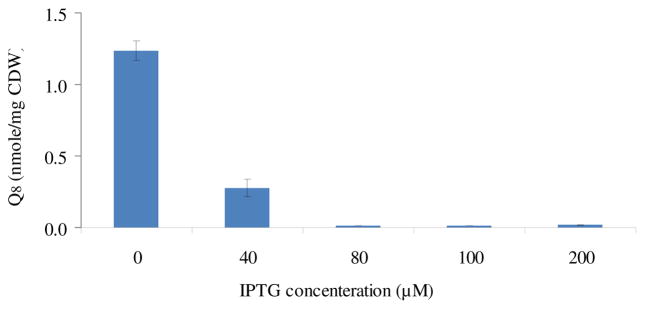
The Coenzyme Q8 concentration of strain MG1655(pTrc-lePGT) in the different IPTG concentrations from 0 to 200μM when the cell density reached to 1.0±0.2 (OD600).
4. Conclusions
In this study, a novel “metabolic transistor” approach was demonstrated by two strategies to finely controlling a large metabolic flux. A small change of the key participant, Q8 by manipulation of the quinone synthesis pathway of E. coli strain controlled the function of electron transfer chain, which then further affected the large flux of the central metabolic pathway away from the TCA cycle/ETC and toward lactate. A theoretical yield of lactate production under fully aerobic conditions via the in vivo, genetically tunable strategy in an E. coli strain was achieved. The results provide a novel means to control the activity of the electron transfer chain and manipulate the production of reduced products while consuming a defined amount of oxygen.
Highlights.
The “metabolic transistor” strategy was established in E. coli.
Fine-tuning of a large metabolic flux can be achieved by this strategy.
Control of electron transfer chain of E. coli can be achieved by this strategy.
Control of the metabolic burn rate & CO2 release of E. coli can be accomplished.
Theoretical yield of lactate was produced under fully aerobic conditions.
Acknowledgments
The work was supported in part by a grant from the National Institutes of Health (NIH GM090152).
Footnotes
Publisher's Disclaimer: This is a PDF file of an unedited manuscript that has been accepted for publication. As a service to our customers we are providing this early version of the manuscript. The manuscript will undergo copyediting, typesetting, and review of the resulting proof before it is published in its final citable form. Please note that during the production process errors may be discovered which could affect the content, and all legal disclaimers that apply to the journal pertain.
References
- Alper H, Miyaoku K, Stephanopoulos G. Construction of lycopene-overproducing E. coli strains by combining systematic and combinatorial gene knockout targets. Nat Biotechnol. 2005;23(5):612–616. doi: 10.1038/nbt1083. [DOI] [PubMed] [Google Scholar]
- Aussel L, Pierrel F, Loiseau L, Lombard M, Fontecave M, Barras F. Biosynthesis and physiology of coenzyme Q in bacteria. Biochim Biophys Acta. 2014;1837(7):1004–1011. doi: 10.1016/j.bbabio.2014.01.015. [DOI] [PubMed] [Google Scholar]
- Bertani G. Studies on lysogenesis. I The mode of phage liberation by lysogenic Escherichia coli. J Bacteriol. 1951;62:293–300. doi: 10.1128/jb.62.3.293-300.1951. [DOI] [PMC free article] [PubMed] [Google Scholar]
- Brophy JA, Voigt CA. Principles of genetic circuit design. Nat Methods. 2014;11(5):508–520. doi: 10.1038/nmeth.2926. [DOI] [PMC free article] [PubMed] [Google Scholar]
- Chang ACY, Cohen SN. Construction and characterization of amplifiable multicopy DNA cloning vehicles derived from the P15A cryptic miniplasmid. J Bacteriol. 1978;134:1141–1156. doi: 10.1128/jb.134.3.1141-1156.1978. [DOI] [PMC free article] [PubMed] [Google Scholar]
- Cunningham FX, Jr, Sun Z, Chamovitz D, Hirschberg J, Gantt E. Molecular structure and enzymatic function of lycopene cyclase from the cyanobacterium Synechococcus sp strain PCC7942. Plant Cell. 1994;6:1107–1121. doi: 10.1105/tpc.6.8.1107. [DOI] [PMC free article] [PubMed] [Google Scholar]
- Datsenko KA, Wanner BL. One-step inactivation of chromosomal genes in Escherichia coli K-12 using PCR products. Proc Natl Acad Sci U S A. 2000;97(12):6640–6645. doi: 10.1073/pnas.120163297. [DOI] [PMC free article] [PubMed] [Google Scholar]
- Dittrich CR, Bennett GN, San KY. Characterization of the acetate-producing pathways in Escherichia coli. Biotech Prog. 2005;21:1062–1067. doi: 10.1021/bp050073s. [DOI] [PubMed] [Google Scholar]
- Farmer WR, Liao JC. Improving lycopene production in Escherichia coli by engineering metabolic control. Nat Biotechnol. 2000;18(5):533–537. doi: 10.1038/75398. [DOI] [PubMed] [Google Scholar]
- Gulmezian M, Hyman KR, Marbois BN, Clarke CF, Javor GT. The role of UbiX in Escherichia coli coenzyme Q biosynthesis. Arch Biochem Biophys. 2007;467(2):144–153. doi: 10.1016/j.abb.2007.08.009. [DOI] [PMC free article] [PubMed] [Google Scholar]
- Guzman LM, Belin D, Carson MJ, Beckwith J. Tight regulation, modulation, and high-level expression by vectors containing the arabinose PBAD promoter. J Bacteriol. 1995;177:4121–4130. doi: 10.1128/jb.177.14.4121-4130.1995. [DOI] [PMC free article] [PubMed] [Google Scholar]
- Hayashi T, Kato T, Furukawa K. Respiratory chain analysis of Zymomonas mobilis mutants producing high levels of ethanol. Appl Environ Microbiol. 2012;78(16):5622–5629. doi: 10.1128/AEM.00733-12. [DOI] [PMC free article] [PubMed] [Google Scholar]
- Kessler D, Leibrecht I, Knappe J. Pyruvate-formate-lyase-deactivase and acetyl-CoA reductase activities of Escherichia coli reside on a polymeric protein particle encoded by adhE. FEBS Lett. 1991;281(1–2):59–63. doi: 10.1016/0014-5793(91)80358-a. [DOI] [PubMed] [Google Scholar]
- Koch-Koerfges A, Pfelzer N, Platzen L, Oldiges M, Bott M. Conversion of Corynebacterium glutamicum from an aerobic respiring to an aerobic fermenting bacterium by inactivation of the respiratory chain. Biochim Biophys Acta. 2013;1827(6):699–708. doi: 10.1016/j.bbabio.2013.02.004. [DOI] [PubMed] [Google Scholar]
- Lee PC, Salomon C, Mijts B, Schmidt-Dannert C. Biosynthesis of ubiquinone compounds with conjugated prenyl side chains. Appl Environ Microbiol. 2008;74(22):6908–6917. doi: 10.1128/AEM.01495-08. [DOI] [PMC free article] [PubMed] [Google Scholar]
- Leppik RA, Young IG, Gibson F. Membrane-associated reactions in ubiquinone biosynthesis in Escherichia coli. 3-Octaprenyl-4-hydroxybenzoate carboxy-lyase. Biochim Biophys Acta. 1976;436(4):800–810. doi: 10.1016/0005-2736(76)90407-7. [DOI] [PubMed] [Google Scholar]
- Levanon SS, San KY, Bennett GN. Effect of oxygen on the Escherichia coli ArcA and FNR regulation systems and metabolic responses. Biotechnol Bioeng. 2005;89(5):556–564. doi: 10.1002/bit.20381. [DOI] [PubMed] [Google Scholar]
- Lin H, Bennett GN, San KY. Genetic reconstruction of the aerobic central metabolism in Escherichia coli for the absolute aerobic production of succinate. Biotechnol Bioeng. 2005;89:148–156. doi: 10.1002/bit.20298. [DOI] [PubMed] [Google Scholar]
- Nelson DL, Cox MM. Lehninger Principles of Biochemistry. 3. Worth Publishers; New York: 2000. [Google Scholar]
- Nielsen AA, Segall-Shapiro TH, Voigt CA. Advances in genetic circuit design: novel biochemistries, deep part mining, and precision gene expression. Curr Opin Chem Biol. 2013;17(6):878–892. doi: 10.1016/j.cbpa.2013.10.003. [DOI] [PubMed] [Google Scholar]
- Ohara K, Mito K, Yazaki K. Homogeneous purification and characterization of LePGT1-a membrane-bound aromatic substrate prenyltransferase involved in secondary metabolism of Lithospermum erythrorhizon. FEBS J. 2013;280(11):2572–2580. doi: 10.1111/febs.12239. [DOI] [PubMed] [Google Scholar]
- Ohara K, Muroya A, Fukushima N, Yazaki K. Functional characterization of LePGT1, a membrane-bound prenyltransferase involved in the geranylation of p-hydroxybenzoic acid. Biochem J. 2009;421(2):231–241. doi: 10.1042/BJ20081968. [DOI] [PubMed] [Google Scholar]
- Olson EJ, Hartsough LA, Landry BP, Shroff R, Tabor JJ. Characterizing bacterial gene circuit dynamics with optically programmed gene expression signals. Nat Methods. 2014;11(4):449–455. doi: 10.1038/nmeth.2884. [DOI] [PubMed] [Google Scholar]
- Portnoy VA, Herrgård MJ, Palsson BØ. Aerobic fermentation of D-glucose by an evolved cytochrome oxidase-deficient Escherichia coli strain. Appl Environ Microbiol. 2008;74(24):7561–7569. doi: 10.1128/AEM.00880-08. [DOI] [PMC free article] [PubMed] [Google Scholar]
- Portnoy VA, Scott DA, Lewis NE, Tarasova Y, Osterman AL, Palsson BØ. Deletion of genes encoding cytochrome oxidases and quinol monooxygenase blocks the aerobic-anaerobic shift in Escherichia coli K-12 MG1655. Appl Environ Microbiol. 2010;76(19):6529–6540. doi: 10.1128/AEM.01178-10. [DOI] [PMC free article] [PubMed] [Google Scholar]
- Tran QM, Rothery RA, Maklashina E, Cecchini G, Weiner JH. The quinone binding site in Escherichia coli succinate dehydrogenase is required for electron transfer to the heme b. J Biol Chem. 2006;281(43):32310–32317. doi: 10.1074/jbc.M607476200. [DOI] [PubMed] [Google Scholar]
- Vadali RV, Fu Y, Bennett GN, San KY. Enhanced lycopene productivity by manipulation of carbon flow to isopentenyl diphosphate in Escherichia coli. Biotechnol Prog. 2005;21(5):1558–1561. doi: 10.1021/bp050124l. [DOI] [PubMed] [Google Scholar]
- Wagner AFV, Schulz S, Bomke J, Pils T, Lehmann WD, Knappe J. YfiD of Escherichia coli and Y061 of bacteriophage T4 as autonomous glycyl radical cofactors reconstituting the catalytic center of oxygen-fragmented pyruvate formate-lyase. Biochem Biophys Res Commun. 2001;285:456–462. doi: 10.1006/bbrc.2001.5186. [DOI] [PubMed] [Google Scholar]
- Wallace BJ, Young IG. Role of quinones in electron transport to oxygen and nitrate in Escherichia coliStudies with a ubiA− menA− double quinone mutant. Biochim Biophys Acta. 1977;461(1):84–100. doi: 10.1016/0005-2728(77)90071-8. [DOI] [PubMed] [Google Scholar]
- Wyborn NR, Messenger SL, Henderson RA, Sawers G, Roberts RE, Attwood MM, Green J. Expression of Escherichia coli yfiD gene responds to intracellular pH and reduces the accumulation of acidic metabolic end products. Microbiology. 2002;148:1015–1026. doi: 10.1099/00221287-148-4-1015. [DOI] [PubMed] [Google Scholar]
- Zhang HT, Javor GT. Identification of the ubiD gene on the Escherichia coli chromosome. J Bacteriol. 2000;182(21):6243–6246. doi: 10.1128/jb.182.21.6243-6246.2000. [DOI] [PMC free article] [PubMed] [Google Scholar]
- Zhu J, Sánchez A, Bennett GN, San KY. Manipulating respiratory levels in Escherichia coli for aerobic formation of reduced chemical products. Metab Eng. 2011;13(6):704–712. doi: 10.1016/j.ymben.2011.09.006. [DOI] [PMC free article] [PubMed] [Google Scholar]
- Zhu J, Shalel-Levanon S, Bennett G, San KY. The YfiD protein contributes to the pyruvate formate-lyase flux in an Escherichia coli arcA mutant strain. Biotechnol Bioeng. 2007;97(1):138–143. doi: 10.1002/bit.21219. [DOI] [PubMed] [Google Scholar]
- Zhu J, Shimizu K. The effect of pfl gene knockout on the metabolism for optically pure D-lactate production by Escherichia coli. Appl Microbiol Biotechnol. 2004;64(3):367–375. doi: 10.1007/s00253-003-1499-9. [DOI] [PubMed] [Google Scholar]