

Abstract
Cells link environmental fluctuations, such as nutrition, to metabolic remodeling. Epigenetic factors are thought to be involved in such cellular processes, but the molecular basis remains unclear. Here we report that the lysine-specific demethylase 2 (LSD2) suppresses the flux and metabolism of lipids to maintain the energy balance in hepatic cells. Using transcriptome and chromatin immunoprecipitation-sequencing analyses, we revealed that LSD2 represses the genes involved in lipid influx and metabolism through demethylation of histone H3K4. Selective recruitment of LSD2 at lipid metabolism gene loci was mediated in part by a stress-responsive transcription factor, c-Jun. Intriguingly, LSD2 depletion increased the intracellular levels of many lipid metabolites, which was accompanied by an increased susceptibility to toxic cell damage in response to fatty acid exposure. Our data demonstrate that LSD2 maintains metabolic plasticity under fluctuating environment in hepatocytes by mediating the cross talk between the epigenome and metabolism.
INTRODUCTION
Organisms and cells must adjust their energy strategy to fluctuating nutrient availability and other environmental conditions. Epigenetic mechanisms have been implicated in the phenotypic plasticity in response to environmental changes, as well as in consistent execution of the developmental program (1). It has been shown that nutrients and dietary composition potently influence epigenetic marks, including DNA methylation and histone methylation and acetylation, in both humans and animal models (2).
Because chromatin-modifying enzymes utilize nutrient-derived metabolites as substrates and coenzymes, epigenome formation is, by nature, influenced by nutritional and metabolic conditions (3–6). Lysine-specific demethylases 1 and 2 (LSD1 and LSD2), also known as KDM1A and KDM1B, respectively, comprise the flavin-dependent amine oxidase family of histone demethylases (7). These enzymes require flavin adenine dinucleotide (FAD) as a coenzyme for the removal of methyl groups from the lysine residue of histone H3 and other proteins (8, 9). FAD is a vitamin B2-derived metabolite that serves as a redox cofactor in key metabolic processes such as fatty acid oxidation and succinate dehydrogenation in the tricarboxylic acid (TCA) cycle (10). Thus, the cellular metabolic state may influence the demethylase activity of these proteins. Indeed, we and others have previously demonstrated that LSD1 controls energy metabolism genes in response to extracellular conditions (11, 12), suggesting that FAD-dependent epigenetic factors may link environmental information to metabolic programming. LSD2 was identified as a second flavin-dependent histone demethylase that targets methylated lysines 4 and 9 of histone H3 (H3K4 and H3K9, respectively) (8, 13–15). Although LSD2 has been implicated in the establishment of maternal genomic imprinting in oocytes (16), little is known about its biological functions, particularly in relation to metabolic control.
In the liver, hepatocytes play a crucial role in the homeostatic control of lipid metabolism. Hepatocytes incorporate adipose- and diet-derived fatty acids, which are either stored by themselves as neutral lipids or redistributed to other tissues in the form of very-low-density lipoproteins (17). When hepatocytes are exposed to an intolerably large amount of fatty acids, for example, due to overfeeding, excessive fatty acids and their toxic metabolites accumulate in the cells, often leading to the lipotoxic liver injury known as nonalcoholic fatty liver disease (NAFLD) (18, 19). Epigenetic alterations in the liver have been linked to insulin resistance and NAFLD in humans (20) and diet-induced steatosis in mice (21). A recent study by Ahrens et al. examined the DNA methylation profiles of liver biopsy specimens from patients with NAFLD and nonalcoholic steatohepatitis (NASH), an advanced form of NAFLD (22). Of particular note, some disease state-dependent methylation patterns could be reversed after improvement of the disease condition by bariatric surgery (22), suggesting that hepatic lipid homeostasis is associated with epigenetic plasticity. However, we still lack knowledge of whether a specific epigenetic factor could be involved in the homeostatic control of hepatic lipid metabolism.
Here, we provide direct evidence that LSD2 plays an essential role in the homeostatic control of lipid metabolism in hepatocytes. Our integrative investigations using transcriptome, metabolome, and chromatin immunoprecipitation-sequencing (ChIP-seq) analyses revealed that LSD2 suppresses lipid transport and metabolism by repressing key metabolic genes through the regulation of methylated H3K4 (H3K4me). We further show that LSD2 depletion leads to enhanced lipotoxic cell damage under fatty acid exposure. We propose an epigenetic mechanism for ensuring metabolic plasticity in response to lipid overload, in which LSD2 maintains the proper expression of lipid metabolism genes in hepatocytes.
MATERIALS AND METHODS
Cell culture.
HepG2 cells were cultured in high-glucose (25 mM d-glucose) Dulbecco's modified Eagle's medium (Sigma) supplemented with 10% (vol/vol) heat-inactivated fetal bovine serum and penicillin-streptomycin. For the knockdown experiments (KD), specific small interfering RNAs (siRNAs) were introduced to the cells using RNAiMAX reagent (Invitrogen) when they were approximately 50% confluent. After being cultured for 3 to 4 days, semiconfluent cells were harvested for subsequent analyses. Target sequences used for siRNA design are listed in Table S1 in the supplemental material. siRNA against firefly luciferase gene was used as a control. For the knockdown of the c-Jun gene, siGENOME Human JUN siRNA SMARTpool (Dharmacon) was used, while siGENOME Non-Targeting siRNA SMARTpool 1 (Dharmacon) was used as a control.
Antibodies.
Anti-LSD2 polyclonal antibody was raised in rabbits by administering recombinant human LSD2 protein (region from positions 26 to 822), which was prepared using a baculovirus expression system. Anti-LSD2 antisera were purified by affinity chromatography of the IgG fraction and were titrated prior to use. Anti-histone H3 (ab1791), anti-H3K4me1 (ab8895), and anti-H3K27ac (ab4729) antibodies were purchased from Abcam. The following antibodies were also used: anti-histone H3K4me2 (07-030; Millipore), anti-normal rabbit IgG (sc-2027; Santa Cruz), and anti-Flag M2 (F1804, Sigma-Aldrich).
Plasmid construction.
To construct pcDNA3-Flag-hLSD2, an LSD2 expression vector, a fragment (from +1 to +2469) of the human LSD2 gene was PCR amplified using cDNAs from HepG2 cells and cloned into the EcoRV and XbaI sites of the pcDNA3-Flag-mock vector.
Gene expression analysis.
Total RNA from tissues and cells was extracted using TRIzol reagent (Invitrogen). cDNAs were produced using a ReverTra Ace qPCR reverse transcription kit (Toyobo). Quantitative reverse transcription-PCR (qRT-PCR) was performed by the SYBR green method using Thunderbird reagents (Toyobo) and an ABI 7300 sequence detector (Applied Biosciences). Data are presented as means ± standard deviations (SDs). Statistical analyses were performed using two-tailed Student's t test. Primers used in this study are listed in Table S1 in the supplemental material.
Microarray analysis.
Genome-wide expression analysis was performed using a GeneChip Human Genome Array U133 Plus 2.0 in combination with a GeneChip hybridization, wash, and stain kit (Affymetrix). We prepared three HepG2 samples by introducing each of three different siRNAs against LSD2. We also prepared two control knockdown (KD) samples. Total RNA from cells was extracted, and the sample integrity was confirmed using a Bioanalyzer RNA 6000 Nano assay (Agilent). Data annotation analysis was performed using GeneSpring GX software (Agilent). Gene set enrichment analysis was done using GSEA version 2.0 software provided by the Broad Institute of MIT and Harvard (http://www.broadinstitute.org/gsea/).
Chromatin immunoprecipitation.
In the ChIP experiments for detecting modified histones, cells were cross-linked with 1% formaldehyde. Following cell lysis, isolated nuclei were subjected to sonication for chromatin fragmentation. Chromatin fragments were incubated at 4°C overnight with appropriate antibodies, followed by a pulldown assay using protein A/G-conjugated agarose beads. Purified DNAs were subjected to quantitative PCR (qPCR) using the primer sets listed in Table S1. To detect LSD2 enrichment on genomic DNA, we employed a protocol for detecting indirect associations between protein and DNA (23). Briefly, enhanced cross-linking of chromatin using formaldehyde and the protein-protein chemical cross-linker dimethyl 3,3′-dithiobispropionimidate 2HCl (Sigma) was performed to increase the stability of protein-DNA complexes. Chromatin fragmentation was done by sonication in regular radioimmunoprecipitation assay (RIPA) buffer containing 0.1% SDS, followed by immunoprecipitation, as described above.
ChIP-seq analysis.
For ChIP-seq analysis to detect LSD2- or H3K4me1-DNA interactions, 1 × 10⁷ HepG2 cells were collected for a ChIP experiment. After cross-linking, chromatin DNA was fragmented using a Covaris S220 sonicator (Covaris Inc.), followed by immunoprecipitation with either an anti-LSD2 or an anti-H3K4me1 polyclonal antibody. The protein-bound chromatin fraction was collected using Dynabeads protein A/G (Life Technologies), and the DNA was purified. A DNA fragment library for sequencing was constructed using an Ion fragment library kit (Life Technologies). Adapter-ligated DNA fragments were purified using Agencourt AMPure XP (Beckman Coulter Inc.). High-throughput sequencing was performed using Ion PGM and Ion Proton semiconductor sequencers (Life Technologies) according to the manufacturer's instructions. All sequence data obtained from Ion PGM and Proton were merged before alignment onto the human reference genome hg19 using the BWA algorithm (CLC Genomics Workbench Software). With the same software, the duplicate reads and reads with low overall quality or low mapping quality were trimmed out. For LSD2 ChIP-seq, final numbers of mapped reads were 36,409,704 for LSD2 and 27,141,872 for Input. For H3K4me1 ChIP-seq, final numbers of mapped reads were 33,087,078 for the control siRNA sample, 53,725,212 for input of the control siRNA sample, 49,410,448 for the LSD2 knockdown (LSD2-KD) sample, and 58,829,288 for input of the LSD2-KD sample.
Peak detection was done using the MACS algorithm in Avadis NGS software. LSD2 binding sites were detected based on the LSD2 peaks significantly enriched over input peaks at a P cutoff value of 10−5. H3K4me1 peaks enhanced by LSD2-KD were detected based on the H3K4me1 peaks in LSD2-KD samples significantly enriched over H3K4me1 peaks in control siRNA sample peaks at a P cutoff value of 10−5.
For identification of the direct regulatory target genes of LSD2, we first detected 414,095 LSD2 peaks using the MACS algorithm (24) and selected 15,532 robust peaks that met the criteria of >25 reads and >5-fold enrichment. Based on this peak detection, 6,079 neighboring genes were identified within 5,000 bases of the LSD2 peaks using Avadis NGS software with the gene annotation provided by Ensembl. Among these genes, we identified 226 genes with >1.5-fold expression change in response to LSD2-KD.
For identifying genes with both increased H3K4me1 and expression change in response to LSD2-KD, we first detected 180,505 exclusive H3K4me1 peaks under LSD2-KD using the MACS algorithm, and then we selected 12,735 robust peaks that met the criteria of >30 reads and >5-fold enrichment. Based on this peak detection, 5,768 neighboring genes were identified within 5,000 bases of the H3K4me1 peaks using Avadis NGS with the gene annotation provided by Ensembl. Of these genes, we identified 207 with a >1.5-fold expression change in response to LSD2-KD.
Visualization of ChIP-seq data with smoothing (smoothing window size = 2 bp) was done using Avadis NGS. ChIP-seq data for chromatin modifications in HepG2 cells were obtained from the ENCODE/Broad Institute via the UCSC Genome Browser website (http://genome.ucsc.edu/). The Gene Expression Omnibus (GEO) accession numbers of the files are as follows: GSM733693 for H3K4me2 and GSM733743 for H3K27ac. ChIP-seq data for p300 enrichment in HepG2 cells were from ENCODE/Stanford/Yale/USC/Harvard (wgEncodeEH001862, GSM935545), FAIRE data were from ENCODE/OpenChrom (UNC Chapel Hill) (GSM864354), c-Jun data were from ENCODE/Stanford/Yale/USC/Harvard (wgEncodeEH001794, GSM935364), and c-Myc data were from ENCODE/Open Chrom (UT Austin) GSM822291.
Correlation analyses of ChIP-seq peaks.
Correlations of LSD2 peaks with histone modifications were analyzed using GenomeInspector (Genomatix) according to the manufacturer's instructions (https://www.genomatix.de/online_help/help_regionminer/GenomeInspector.html). As reference data sets, histone modification data of HepG2 cells were obtained from the ENCODE/Broad Institute via the UCSC Genome Browser website. The GEO accession numbers of the files used in the analyses are as follows: GSM798321 for H3K4me1 and GSM733754 for H3K27me3. LSD2 peaks were selected using the criteria of >28 reads and >5-fold enrichment from the peaks detected using the MACS algorithm. Peaks for H3K4me1 and H3K27me3 were detected using NGS analyzer (Genomatix) or the MACS algorithm in Avadis NGS.
Metabolomic analysis.
Metabolomic analyses were performed using capillary electrophoresis time of flight mass spectrometry (CE-TOFMS) and liquid chromatography (LC)-TOFMS at Human Metabolome Technologies (HMT, Japan). Triplicate samples of control and LSD2-KD2 cells were subjected to both CE-TOFMS and LC-TOFMS, while LSD2-KD1 was analyzed by LC-TOFMS. Cells were washed with phosphate-buffered saline (PBS) and collected by trypsinization, and then they were washed twice with 5% (wt/wt) mannitol solution at room temperature. Cells were redispersed in LC/MS-grade methanol (Wako) for CE-TOFMS or LC/MS-grade ethanol (Wako) for LC-TOFMS, both containing HMT's Internal Standard Solution 1. Peaks were extracted as previously described (25). After quantification, metabolite concentrations were normalized by cell number. Of ∼900 (for CE-TOFMS) and ∼500 (for LC-MS) metabolites from the HMT databases, 275 metabolites were detected above the signal-to noise threshold (listed in Table S4 in the supplemental material). The databases include glycolysis and tricarboxylic acid (TCA) cycle intermediates, amino acids, nucleic acids, nucleotides, nucleosides, coenzyme A, organic acids, nicotinamide coenzymes, fatty acids, bile acids, lipids, steroid derivatives, and polyphenols.
Clustering of metabolites according to changes in concentration was performed using Cluster 3.0, which was obtained from the Laboratory of DNA Information Analysis of the Human Genome Center in the Institute of Medical Science, The University of Tokyo (http://bonsai.hgc.jp/~mdehoon/software/cluster/software.htm#ctv/). Hierarchical clustering was calculated using Pearson correlation (centered correlation) and complete linkage. Clustering results were visualized using Java TreeView software (26).
Fatty acid uptake assay.
Cellular fatty acid uptake was tested using a QBT fatty acid uptake assay kit (Molecular Devices), which uses dodecanoic acid conjugated with difluoroborondipyrromethene, a fluorescent dye (BODIPY-DA). Fatty acid uptake assay stock solutions were dissolved completely by adding 10 ml of 1× HBSS buffer (1× Hanks' balanced salt solution with 20 mM HEPES and 0.2% fatty acid-free bovine serum albumin [BSA]). HepG2 cells were cultured in the medium containing the assay reagent for 10 min at 37°C. Cells were either subjected to microscopic analysis or trypsinized for fluorescence-activated cell sorting analysis using a FACSCanto cytometer (Becton Dickinson).
Lipotoxicity analysis.
To analyze cellular lipotoxicity, siRNA-introduced HepG2 cells were treated with BSA-conjugated oleic acid (OA) for 48 h. Following trypsinization, cells were counted using an automatic cell imaging counter, Cytorecon (GE Healthcare). For oleic acid conjugation to BSA, a sodium oleate (≥99% [capillary GC]; Sigma) solution in 150 mM NaCl was added to a fatty acid-free BSA solution (Wako). The final molar ratio of oleic acid to BSA was 6:1.
Animal studies.
Animal experiments were conducted in accordance with the guidelines of the Animal Care and Use Committee of Kumamoto University. For NAFLD induction, 7-week-old male C57BL/6J mice were fed a high-fat diet (HFD) containing 21% kcal from fat (A02082003BP; Research Diets Inc.) or a methionine- and choline-deficient (MCD) diet (A02082002BG; Research Diets Inc.), which also contains 21% kcal from fat, for 4 weeks. Body weight was monitored weekly throughout the test period. After 16 h of fasting, liver tissues were dissected, and the sections were either snap-frozen in liquid nitrogen for RNA analyses or fixed with formalin for histological analyses.
Statistical analyses.
All statistical analyses between two groups were done by Student's t test unless otherwise stated. Equality of variance was examined using F test.
Microarray data accession number.
The GEO accession number for microarray and ChIP-seq data is GSE59695.
RESULTS
LSD2 selectively represses lipid metabolism genes in hepatocytes.
Because LSD1 regulates the metabolic genes under diverse cellular contexts (11, 12, 27), we tested in this study whether another FAD-dependent demethylase, LSD2, could be involved in the metabolic programming. During our initial examinations in mouse tissues, we found that LSD2 was expressed more highly in the liver than in other metabolic tissues (Fig. 1A). To gain insight into the role of LSD2 function in hepatocytes, we depleted LSD2 in HepG2 human hepatic cells using three different siRNAs (Fig. 1B) and then carried out an expression microarray experiment. We detected 1,362 probe sets with a >1.5-fold difference between the control and LSD2 knockdown (LSD2-KD) cells (Fig. 1C). Of these, 906 probe sets were upregulated, while 456 were downregulated. Using gene set enrichment analysis (GSEA) (28, 29), we established that genes associated with “metabolism of lipids and lipoproteins” were significantly enriched in the probe sets that were upregulated by LSD2-KD (statistical threshold, P < 0.05 and false discovery rate [FDR] < 0.25) (Fig. 1D; see also Fig. S1 and S2 in the supplemental material). In contrast, GSEA of the genes downregulated in response to LSD2 depletion did not identify any significantly enriched gene sets (see Fig. S1). These results were validated by quantitative reverse transcription-PCR (qRT-PCR) analyses with HepG2 cells, in which the key regulators of lipid and lipoprotein metabolism showed increased expression in response to LSD2-KD (Fig. 2A; shown schematically in Fig. S3 in the supplemental material). Importantly, most of these genes were similarly upregulated by LSD2-KD in other human hepatic cell lines, namely, Hep3B and Huh-7 (Fig. 2B and C). These results suggest that LSD2 represses the genes involved in lipid and lipoprotein metabolism in hepatocytes.
FIG 1.

Increased expression of lipid transport and metabolism genes in LSD2-depleted hepatocytes. (A) LSD2 mRNA expression in mouse tissues. qRT-PCR values were normalized to the expression levels of the Rplp0 gene. Values are the means ± SDs for four samples. *, P < 0.05 versus liver tissue. BAT, brown adipose tissue. (B) Efficiency of LSD2 knockdown (KD). LSD2 expression after the introduction of three different siRNAs was detected at the mRNA (qRT-PCR) and protein (by Western blotting) levels in HepG2 cells. Cells were harvested 4 days after introduction of siRNAs. *, P < 0.05 versus control (Cont) siRNA. (C) Venn diagram of the genes changed 1.5-fold or more by three different siRNAs against LSD2. A total of 1,362 probe sets were detected with a >1.5-fold change between the control and LSD2-KD cells. Of these, 906 probe sets were upregulated, while 456 were downregulated. Control siRNAs were used as controls. (D) Significant upregulation of lipid metabolism genes by LSD2-KD as revealed by gene set enrichment analysis. Nominal (NOM) P values and false discovery rates (FDRs) are indicated. A full list of the identified gene sets is shown in Fig. S2 in the supplemental material.
FIG 2.

Increased expression of lipid metabolism genes by LSD2-KD in hepatocyte cell lines. (A to C) Expression changes of lipid metabolism genes after LSD2-KD were confirmed in HepG2 (A), Hep3B (B), and Huh-7 (C) cells. Genes identified by microarray analysis as LSD2 regulated were subjected to validation by qRT-PCR. Values were normalized to the expression level of the RPLP0 gene and are shown as the fold difference against control siRNA-introduced samples. Values are the means ± SDs for triplicate samples. *, P < 0.05 versus control siRNA.
LSD2 is enriched at lipid metabolism gene loci.
Biochemical and structural analyses have shown that LSD2 demethylates H3K4me1 and H3K4me2, chromatin signatures associated with the transcription-competent state (8, 16, 30). However, it is not clear whether LSD2 is directly involved in transcriptional repression. To address how LSD2 regulates lipid metabolism genes, we first sought to determine the genome-wide distribution of LSD2 binding by ChIP-seq analysis using our validated antibody (Fig. 3A). We found that LSD2 was relatively enriched within ≈5 kb of the transcription start site (TSS) but was excluded from the vicinity of the TSS (Fig. 3B). This observation is consistent with a previous study in which a ChIP-chip method was used to show that exogenously introduced LSD2 was enriched predominantly in the gene body but not in the core promoter region (14). We detected 15,532 peaks with a robust enrichment of LSD2, which were located near 6,079 coding genes (Fig. 3C, green circle). Among these, we identified 226 genes that exhibited constant expression changes in response to LSD2-KD, suggesting that these genes are the direct targets of LSD2-mediated transcriptional regulation (Fig. 3C and D; listed in Table S2 in the supplemental material).
FIG 3.
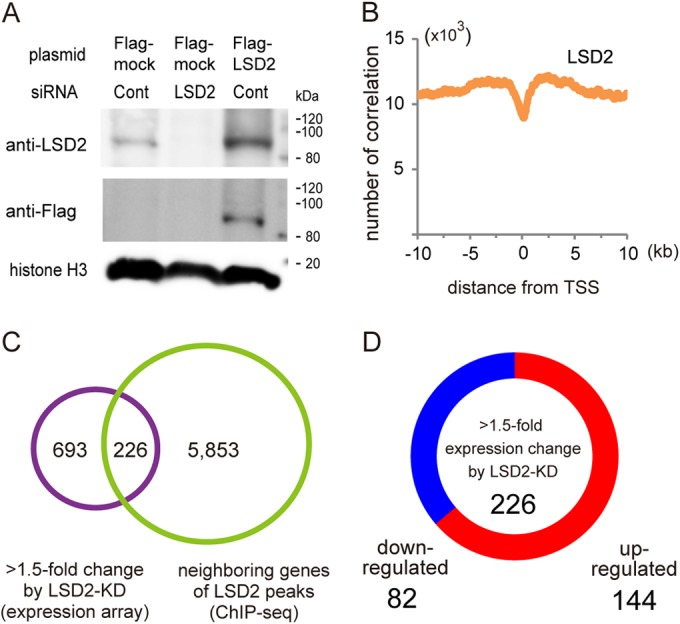
Genome-wide distribution of LSD2-bound sites in HepG2 cells. (A) Validation of anti-LSD2 antibody. Control HepG2 cells and HepG2 cells into which LSD2 siRNA had been introduced, in combination with use of pcDNA3-Flag or pcDNA3-Flag-LSD2, were cultured for 48 h before collection. (B) LSD2 is enriched near the TSS but excluded from the TSS itself. LSD2 peaks in HepG2 cells were detected using the MACS algorithm with ChIP-seq peaks of input sample as a control. (C) Venn diagram of the overlap between genes adjacent to the robust LSD2 ChIP-seq (green circle) peaks and genes with >1.5-fold expression change in response to LSD2-KD, as assessed by microarray analysis (purple circle). A total of 1,362 probe sets, shown in Fig. 1C, were mapped to 919 genes after removal of redundant or nonannotated probes. For the detection of robust LSD2 peaks using the MACS algorithm, criteria of >25 reads and >5-fold enrichment were applied. (D) Distribution of up- or downregulated genes among the LSD2 target genes identified in panel C (fully listed in Table S2 in the supplemental material).
LSD2 organizes the monomethylated H3K4 landscape of lipid metabolism genes.
To further clarify the role of LSD2 in chromatin regulation, we compared our LSD2 distribution data with previously reported data sets of histone modifications in HepG2 cells. Interestingly, LSD2 peaks exhibited a marked overlap with H3K4me1 (Fig. 4A), while LSD2 was not enriched at a repressive chromatin mark, namely, trimethylated H3K27 peaks (Fig. 4B). Next, to examine whether LSD2 regulates the H3K4 methylation of its target genes, we evaluated H3K4me1 changes in LSD2-depleted HepG2 cells by ChIP-seq analysis. Importantly, the increase of H3K4me1 by LSD2-KD was most prominent near the LSD2-bound regions (Fig. 4C), suggesting that LSD2 was directly engaged in the regulation of H3K4 methylation status. The H3K4me1 landscape remained largely unchanged by LSD2-KD, for example, in the 9q31 chromosomal region containing the ABCA1 gene (see Fig. S4 in the supplemental material), suggesting that LSD2 regulates H3K4 methylation in a highly selective manner. Moreover, because the enrichment of H3K4me1 in cis-regulatory regions is associated with transcriptional activation (31, 32), we postulated that the increase of H3K4me1 by LSD2-KD might be directly linked to the increased expression of lipid metabolism genes. To verify this, we tested the coexistence of gene expression changes with increased H3K4me1 by LSD2-KD. Among 12,735 robust H3K4me1 peaks enhanced by LSD2-KD, which were located near 5,768 genes, we identified 207 genes that exhibited concurrent expression changes (Fig. 4D and E; listed in Table S3 in the supplemental material). As expected, a number of lipid metabolism-related genes, including ACOX1, ABCA1, CD36, IDH1, CYP19A1, and PIK3C2A, were directly bound by LSD2 and showed increased expression and H3K4me1 levels by LSD2-KD.
FIG 4.

LSD2 is enriched on lipid metabolism genes and associated with the H3K4 monomethylation level. (A) Correlation of LSD2 peaks with H3K4me1 enrichment. LSD2 peaks exhibit a marked accumulation near H3K4me1 peaks, while input peaks do not. (B) LSD2 peaks do not overlap H3K27me3 peaks. (C) The accumulation of H3K4me1 by LSD2-KD occurs predominantly near the LSD2 binding sites. H3K4me1 peaks are significantly enhanced in LSD2-KD over the control (orange line), and those enhanced in the control over LSD2-KD (blue line) are shown. (D) Venn diagram of the overlap between neighboring genes with increased H3K4me1 enrichment in response to LSD2-KD and genes with >1.5-fold expression change in response to LSD2-KD as assessed by microarray analysis. (E) Distribution of the up- or downregulated genes among LSD2-dependent genes identified in panel D (fully listed in Table S3 in the supplemental material).
At a local level, we confirmed that key lipid metabolism genes, including ACOX1, ABCA1, and CD36, harbor putative regulatory regions where LSD2 enrichment and the increased H3K4me1 by LSD2-KD coexisted (Fig. 5; see also Fig. S5 in the supplemental material). This was in clear contrast with the TSS, where LSD2 and H3K4me1 peaks were absent. These regions exhibited relatively high levels of p300 and H3K27ac enrichment and formaldehyde-assisted isolation of regulatory element (FAIRE) peaks that are the signatures of a functional enhancer. In addition, LSD2-KD resulted in an increase of H3K4me2 in some regions (Fig. 5B; see also Fig. S5B).
FIG 5.

LSD2 epigenetically regulates lipid metabolism genes. (A) Epigenetic landscape of the ACOX1 gene locus. ChIP-seq results of LSD2 binding in untreated HepG2 cells and H3K4me1 enrichment in control and LSD2-KD HepG2 cells are shown. H3K4me1 peaks induced in response to LSD2-KD were detected by the MACS algorithm and are shown above the H3K4me1 histogram of LSD2-KD sample. ENCODE data for H3K4me2, H3K27ac, p300, FAIRE, and c-Jun in HepG2 cells are also shown. c-Jun peaks that were detected using MACS algorithm are shown above the histogram. The red box indicates the putative cis-regulatory region that harbors LSD2 peak, while the green box indicates the TSS. (B) ChIP-qPCR analyses of chromatin modifications of the ACOX1 gene locus. The TSS and regions a to c (as indicated in panel A) were selected for qPCR analyses. LSD2 enrichment was tested in untreated HepG2 cells, whereas H3K4me1, H3K4me2, and H3K27ac levels were examined in control and LSD2-KD cells. LSD2-KD1 was used for this experiment. All values are means ± SDs from triplicate samples. *, P < 0.05 versus control siRNA.
Taken together, these results suggest that LSD2 represses lipid metabolism genes via the demethylation of H3K4 within cis-regulatory regions.
Stress-responsive transcription factor c-Jun recruits LSD2 to lipid metabolism genes.
To extend our understanding of how LSD2 selectively regulates lipid metabolism genes, we examined the spatial convergence of LSD2 with transcription factors using publicly available ChIP-seq data from HepG2 cells. Among a number of candidate factors, we found that c-Jun exhibited a highly convergent distribution with LSD2 (Fig. 6A and B), while another factor c-Myc did not (Fig. 6B). Hepatic lipid overload induces c-Jun N-terminal kinase (JNK)-mediated stress response pathway, which is often associated with the pathogenesis of NAFLD (33, 34). Since c-Jun, the downstream effector of this pathway, has been implicated in the transcriptional regulation of lipoapoptosis and steatohepatitis (33, 35, 36), we hypothesized that c-Jun might be involved in the selective recruitment of LSD2 to lipid metabolism gene loci. In lipid metabolism gene loci, 12-O-tetradecanoylphorbol 13-acetate (TPA)-responsive elements (TREs), which harbor a c-Jun binding motif, were located near LSD2 ChIP-seq peaks (Fig. 5A; see also Fig. S5A and C and S6 in the supplemental material). Interestingly, LSD2 was also enriched at TRE of the metabolic genes, which was partially attenuated by the knockdown of c-Jun, indicating that c-Jun contributes to the selective enrichment of LSD2 at regulatory regions (Fig. 6C). Moreover, the upregulated expression of the metabolic genes by LSD2-KD was abolished by combining c-Jun-KD, indicating a functional cooperation of LSD2 and c-Jun in transcriptional repression (Fig. 6D).
FIG 6.

LSD2 functionally cooperate with c-Jun. (A) Correlation of LSD2 peaks with c-Jun enrichment. LSD2 peaks exhibited a marked accumulation near c-Jun peaks, while input peaks did not. (B) Convergence of c-Jun and LSD2 peaks. Note that c-Jun was enriched near LSD2 peaks, while c-Myc was not. (C) c-Jun-dependent enrichment of LSD2 at TPA-responsive element (TRE). LSD2 occupancy was tested under c-Jun-KD in HepG2 cells. siGENOME nontargeting siRNA SMARTpool 1 (Cont-S; Dharmacon) was used as a control. (D) Upregulated expression of lipid metabolism genes under LSD2-KD was cancelled by the loss of c-Jun. siRNAs targeting LSD2 and c-Jun genes were simultaneously introduced into HepG2 cells. Different siRNAs were prepared as controls against LSD2-KD (Cont) and c-Jun-KD (Cont-S). All values are means ± SDs from triplicate samples. *, P < 0.05 versus control siRNA.
LSD2 protects hepatocytes from excessive lipid influx.
We next characterized the metabolic properties of LSD2-depleted HepG2 cells, using a combination of two metabolomic profiling methods: capillary electrophoresis time of flight mass spectrometry (CE-TOFMS) and liquid chromatography (LC)-TOFMS. By a hierarchical clustering of samples based on the abundance of 275 metabolites, we determined distinct clusters in control and LSD2-KD cells, indicating that LSD2 depletion profoundly affected metabolic status (Fig. 7A; metabolites detected are listed in Table S4 in the supplemental material). Notably, our clustering of metabolites revealed a large number of lipid metabolites increased in LSD2-KD cells (Fig. 7A; see Fig. S7 in the supplemental material). Among these metabolites, saturated and unsaturated long-chain fatty acids showed a marked increase in response to LSD2-KD (Fig. 7B). Furthermore, some biologically active intermediates such as phospholipids, ceramide derivatives, and cholesterol were also increased (Fig. 7C).
FIG 7.

Accumulation of fatty acids and toxic lipid metabolites in LSD2-KD cells. (A) Heat map showing relative abundances of 275 metabolites detected by CE-TOFMS and LC-TOFMS in HepG2 cells under LSD2-KD. Both samples and metabolites were subjected to hierarchical clustering. Clusters 1 and 3 were enriched with metabolites that were increased by LSD2-KD2, while cluster 2 was enriched with the decreased metabolites. The metabolites included in these clusters are listed in Fig. S7 in the supplemental material. Data from triplicate samples of control and LSD2-KD2 were used. (B and C) Metabolomic data of representative metabolites showing increased levels in LSD2-KD. Fatty acids (B) and lipid intermediates (C) are shown. The numbers shown with the fatty acids indicate the number of carbons and the unsaturated bonds. All values are means ± SDs of triplicate results of LC-TOFMS analyses. *, P < 0.05 versus control according to Student's t test. (D) Increase of fatty acid uptake in response to LSD2-KD. (Top) Fluorescence microscopic images of BODIPY-dodecanoic acid (DA) incorporated into HepG2 cells. Cells were exposed to BODIPY-DA for 30 min before analysis. The scale bars represent 50 μm. (Bottom) Cells were treated with BODIPY-DA for 10 min, followed by flow cytometric analysis. The histogram shows the representative results for triplicate samples. Values are means ± SDs from triplicate samples. (E) LSD2-KD evokes lipotoxicity under fatty acid exposure. HepG2 cells after the introduction of siRNA were treated with bovine serum albumin (BSA) or with 50 μM oleic acid (OA) for 24 or 48 h, and then the cells were counted. The final molar ratio of OA to BSA was 6:1. All values are means ± SDs from three samples. (F) OA at 200 μM alone inhibits cell growth. All values are means ± SDs from four samples. *, P < 0.05 versus BSA according to Student's t test.
Microarray analysis showed that LSD2 depletion upregulated the expression of CD36 and ACSL5 genes, which are responsible for the cellular incorporation of fatty acids (37). The increase of fatty acids and lipid metabolites in the LSD2-KD cells might therefore result from the acceleration of fatty acid influx. To verify this, we tested long-chain fatty acid uptake into the cells by measuring the incorporation of dodecanoic acid conjugated with a fluorophore, difluoroborondipyrromethene (BODIPY). By flow cytometric and fluorescence microscopic analyses, we found that LSD2-KD markedly enhanced fatty acid incorporation into the cells (Fig. 7D), consistent with our transcriptomic and metabolomic data. Excessive lipid accumulation in the cell leads to the production of toxic metabolites such as lysophosphatidylcholine, diacylglycerol, and ceramides (19, 35), which were also increased in LSD2-KD cells (Fig. 7C). To further characterize the metabolic outcome of LSD2 depletion, we evaluated the effect of fatty acid exposure on cell growth. Interestingly, while 50 μM oleic acid exposure alone did not exert any detectable effect, it significantly suppressed cell growth when combined with LSD2-KD (Fig. 7E). Importantly, 200 μM oleic acid alone was sufficient to inhibit the cell growth, suggesting that under LSD2 depletion, the cells were sensitized against the lipotoxic agent (Fig. 7F). Taken together, these results suggest that LSD2 protects cells from lipotoxic damage by limiting the influx and metabolism of lipids.
Downregulation of LSD2 under severe lipotoxic conditions in mouse liver.
Our in vitro data revealed that the depletion of LSD2 results in accelerated lipid influx, leading to increased susceptibility to lipotoxic cell damage. For the final experiment, we investigated how LSD2 expression is affected by lipotoxic conditions in vivo. To do this, we used two well-characterized models of diet-induced liver injury. Both a high-fat diet (HFD) alone and an HFD in combination with methionine and choline deficiency (MCD) induce NAFLD-like symptoms, to different degrees (38). MCD causes more severe liver injury with higher frequency of inflammatory cell infiltration, as observed in our experiment using C57BL/6J mice (Fig. 8A and B). Notably, MCD diet-fed mice showed a significantly reduced expression of LSD2 mRNA in liver compared with that in the normal-diet (ND)-fed mice (Fig. 8C), which was accompanied by a consistent reduction of LSD2 protein (Fig. 8D). Intriguingly, we detected an inverse correlation between hepatic LSD2 expression and the level of serum alanine aminotransferase (ALT), which is a biomarker for liver damage (Fig. 8E). Collectively, these results suggest that the function of LSD2 in the liver might be affected under fluctuating environmental conditions.
FIG 8.

LSD2 is reduced under MCD-induced lipotoxic liver damage. (A) Hematoxylin and eosin staining of liver sections from 10-week-old male C57BL/6J mice fed a ND, HFD, or MCD diet for 4 weeks. The scale bar represents 50 μM. (B) Serum ALT level in mice. Values are means ± SDs from six samples. (C) LSD2 mRNA expression in the livers of HFD- or MCD-fed mice. qRT-PCR values were normalized to the expression levels of the Rplp0 gene and are shown as the fold difference from ND-fed mice. Values are the means ± SDs from six samples. *, P < 0.05 versus ND or HFD. (D) LSD2 protein level in the livers of HFD- or MCD diet-fed mice. The Western blot bands were quantitated using ImageQuant TL software (GE Healthcare). Signal intensities of LSD2 bands were normalized to those of histone H3. Values are means ± SDs from four samples. (E) Correlation plot of hepatic LSD2 mRNA expression versus serum ALT level. Pearson product-moment correlation coefficient and P values are indicated.
DISCUSSION
Metabolic tissues must adjust to both internal and external metabolic environments in order to exert their proper functions. Since hepatocytes play a crucial role in whole-body energy homeostasis, how they utilize intra- and extracellular lipids depending on nutritional conditions is very important. As a part of the cell identity, such a strategy may be formulated through epigenetic mechanisms. Our current investigations based on transcriptome, epigenome, and metabolome analyses reveal that LSD2 depletion induces the increased expression of genes for lipid transport and metabolism and the enriched H3K4me1 in their putative regulatory regions, with concurrent accumulation of many types of toxic lipid metabolites. We also show that the loss of LSD2 led to increased sensitivity to lipotoxic stress in vitro, which was in concordance with our observation that LSD2 expression was reduced in mouse liver under severely lipotoxic conditions. Based on these findings, we propose a role for LSD2 in the epigenetic regulation of lipid flux and metabolism in hepatocytes, which is beneficial for protection from lipotoxic stress-induced damage (Fig. 9). Hepatocytes incorporate adipocyte- and food-derived fatty acids and release them into the bloodstream in the form of very-low-density lipoproteins. In a hyperlipidemic state, when fatty acid influx and metabolism exceed the capacity of the hepatocytes either to release them or to store them as triglycerides, toxic lipid intermediates such as lipid peroxides and ceramides accumulate, leading to cell damage. In our in vivo study, we found that mRNA and protein expression of LSD2 was reduced by HFD/MCD feeding in the liver but not by an HFD alone (Fig. 8C and D). Previous studies have demonstrated that LSD2 mRNA level in vitro was increased under a hyperglycemic condition and was decreased by ethanol exposure (39, 40). Thus, it is likely that LSD2 expression fluctuates in response to dietary and metabolic conditions, which may lead to an altered function of LSD2. Further work of particular interest would be to test the preventive function of LSD2 in the pathogenesis of NAFLD/NASH.
FIG 9.

Proposed model for homeostatic control of lipid metabolism by LSD2. In the normal state, LSD2 represses fatty acid transport and metabolism genes by erasing H3K4me1 near the TRE occupied by c-Jun, contributing to maintenance of the intracellular lipid level. When LSD2 is lost, the proper expression of the lipid metabolism genes becomes compromised, leading to excessive influx and metabolism of lipids that result in the impaired cell growth. acyl-CoA, acyl coenzyme A.
Mechanistically, we found that enrichment of LSD2 at lipid metabolism genes was dependent in part on the transcription factor c-Jun. It is well known that extracellular stress triggers JNK-mediated phosphorylation of c-Jun, which enters the nucleus to form a dimeric transcription factor called activator protein 1 (AP-1) (34). In hepatocytes, c-Jun promotes cell survival under endoplasmic reticulum (ER) stress (41), while it mediates fatty acid-induced lipoapoptosis (35). The seemingly contradictory functions of c-Jun indicate its context-dependent activities. Indeed, a recent study by Hasenfuss et al. demonstrated that Fra-1 and Fra-2, the dimerization partners of c-Jun, exhibited antisteatotic function, while another partner, c-Fos, was prosteatotic (36). Thus, it is possible that LSD2 associates with a specific AP-1 dimer to maintain the proper level of metabolic gene expression.
Genome-wide approaches described in previous reports established that transcriptional enhancers are marked by high levels of H3K4me1, H3K27 acetylation, and p300 but not H3K4me3 (42, 43). Using ChIP-seq analyses, we found that LSD2 coexists with the chromatin signature associated with active enhancers in putative regulatory regions (Fig. 5; see also Fig. S5 in the supplemental material). Moreover, Heintzman et al. reported that up to 51% of enhancers lie within the gene body (42), which is consistent with our observation of the distribution of LSD2 in HepG2 cells. Because LSD2 depletion increased the H3K4me1 level in lipid metabolism genes, a plausible interpretation of the function of LSD2 in our study is that it represses the transcription of these genes through repression of enhancer activity. We also noticed that LSD2 depletion was associated with a moderate increase in the H3K4me1 level at lipid metabolism gene loci. Since these genes are actively transcribed and exhibit signatures of accessible chromatin in hepatocytes (Fig. 5; see also Fig. S5), it is plausible that their expression is regulated by a dynamic equilibrium of active and repressive chromatin regulators. Removing the repressive forces may produce a mild but persistent shift toward the increase of active marks. Indeed, we and others have previously uncovered, through the depletion of H3K4 demethylase LSD1, that moderate changes (<2-fold) in the methylation status were associated with the expression changes of energy metabolism genes (11, 27). Therefore, we think that LSD2 contributes to the fine-tuning of a series of lipid metabolism genes leading to a widespread rewiring of the metabolic flow. Such a molecular function of LSD2 would be favorable for the effective adjustment to environmental changes such as fluctuating nutritional conditions.
Little is known about the biochemical and cellular functions of LSD2, although LSD1, the other member of the flavin-dependent histone demethylase family, has been implicated in the epigenetic regulation of many biological processes. Even in a limited number of studies, LSD2 has exhibited diverse gene regulatory functions depending on the experimental settings: H3K4 demethylation for supporting optimal transcriptional elongation in HeLa cells (14), H3K4 demethylation for maintaining CpG methylation at imprinted genes during embryonic development (16), H3K9 demethylation for activating NF-κB target genes in dendritic cells (15), and GAL4 reporter gene repression in the absence of demethylase activity in HeLa cells (13). Our findings represent a novel mode of LSD2-mediated gene regulation, in which LSD2 represses lipid metabolism genes via H3K4 demethylation at regulatory regions. It is also important that over one-third of the LSD2-bound genes showed reduced expression by LSD2-KD (Fig. 3D). Thus, the molecular function of LSD2 likely differs among target genes depending on the biological context.
Our conclusions based on the findings in human hepatic cell lines were further assessed in primary mouse hepatocytes, in which LSD2-KD induced the expression of some lipid metabolism genes, even to a limited extent (unpublished data). This may reflect the requirement of intrinsic and/or environmental factors that enhance the selectivity of LSD2 against lipid metabolism genes. One possibility is that the action of stress-responsive factors such as c-Jun is necessary to fully activate LSD2-mediated lipid regulation program. Since LSD2-KO mice appeared to be developmentally normal and healthy (16), it would be of great interest in the future to test how environmental stresses such as lipid overload and hormonal stimulations affect the lipid homeostasis in these mice.
In conclusion, we have reported a novel regulatory mechanism of hepatic lipid metabolism, in which LSD2 epigenetically maintains the proper expression of lipid metabolism genes in response to the cellular nutritional state. Our findings may explain how metabolic plasticity is supported by epigenetic machinery that is responsive to environmental changes in mammalian cells, and would contribute to the development of therapeutic approaches for the treatment of metabolic diseases.
Supplementary Material
ACKNOWLEDGMENTS
We thank Takashi Seki and Shingo Usuki for the technical assistance with high-throughput sequencing and Sayoko Fujimura for the support in preparing liver sections. We also thank the Center for Animal Resources and Development, Kumamoto University, for assistance in the animal studies.
This work was supported by a Grant-in-Aid for Scientific Research on Priority Areas and on Innovative Areas (3307) from the Ministry of Education, Culture, Sports, Science and Technology of Japan, by the Japan Science and Technology Agency (CREST) to M.N., and by a grant from the Takeda Science Foundation to M.N. and S.H. This work was also supported by a Grant-in-Aid for Scientific Research from the Japan Society for the Promotion of Science and by the Nakatomi Foundation to S.H.
Footnotes
Supplemental material for this article may be found at http://dx.doi.org/10.1128/MCB.01404-14.
REFERENCES
- 1.Feil R, Fraga MF. 2012. Epigenetics and the environment: emerging patterns and implications. Nat Rev Genet 13:97–109. doi: 10.1038/nrg3142. [DOI] [PubMed] [Google Scholar]
- 2.Jimenez-Chillarón JC, Diaz R, Martinez D, Pentinat T, Ramon-Krauel M, Ribo S, Plosch T. 2012. The role of nutrition on epigenetic modifications and their implications on health. Biochimie 94:2242–2263. doi: 10.1016/j.biochi.2012.06.012. [DOI] [PubMed] [Google Scholar]
- 3.Feinberg AP. 2007. Phenotypic plasticity and the epigenetics of human disease. Nature 447:433–440. doi: 10.1038/nature05919. [DOI] [PubMed] [Google Scholar]
- 4.Gut P, Verdin E. 2013. The nexus of chromatin regulation and intermediary metabolism. Nature 502:489–498. doi: 10.1038/nature12752. [DOI] [PubMed] [Google Scholar]
- 5.Kaelin WG Jr, McKnight SL. 2013. Influence of metabolism on epigenetics and disease. Cell 153:56–69. doi: 10.1016/j.cell.2013.03.004. [DOI] [PMC free article] [PubMed] [Google Scholar]
- 6.Hino S, Nagaoka K, Nakao M. 2013. Metabolism-epigenome crosstalk in physiology and diseases. J Hum Genet 58:410–415. doi: 10.1038/jhg.2013.57. [DOI] [PubMed] [Google Scholar]
- 7.Pedersen MT, Helin K. 2010. Histone demethylases in development and disease. Trends Cell Biol 20:662–671. doi: 10.1016/j.tcb.2010.08.011. [DOI] [PubMed] [Google Scholar]
- 8.Karytinos A, Forneris F, Profumo A, Ciossani G, Battaglioli E, Binda C, Mattevi A. 2009. A novel mammalian flavin-dependent histone demethylase. J Biol Chem 284:17775–17782. doi: 10.1074/jbc.M109.003087. [DOI] [PMC free article] [PubMed] [Google Scholar]
- 9.Shi Y, Lan F, Matson C, Mulligan P, Whetstine JR, Cole PA, Casero RA, Shi Y. 2004. Histone demethylation mediated by the nuclear amine oxidase homolog LSD1. Cell 119:941–953. doi: 10.1016/j.cell.2004.12.012. [DOI] [PubMed] [Google Scholar]
- 10.Lienhart WD, Gudipati V, Macheroux P. 2013. The human flavoproteome. Arch Biochem Biophys 535:150–162. doi: 10.1016/j.abb.2013.02.015. [DOI] [PMC free article] [PubMed] [Google Scholar]
- 11.Hino S, Sakamoto A, Nagaoka K, Anan K, Wang Y, Mimasu S, Umehara T, Yokoyama S, Kosai K, Nakao M. 2012. FAD-dependent lysine-specific demethylase-1 regulates cellular energy expenditure. Nat Commun 3:758. doi: 10.1038/ncomms1755. [DOI] [PMC free article] [PubMed] [Google Scholar]
- 12.Duteil D, Metzger E, Willmann D, Karagianni P, Friedrichs N, Greschik H, Gunther T, Buettner R, Talianidis I, Metzger D, Schule R. 2014. LSD1 promotes oxidative metabolism of white adipose tissue. Nat Commun 5:4093. doi: 10.1038/ncomms5093. [DOI] [PMC free article] [PubMed] [Google Scholar]
- 13.Yang Z, Jiang J, Stewart DM, Qi S, Yamane K, Li J, Zhang Y, Wong J. 2010. AOF1 is a histone H3K4 demethylase possessing demethylase activity-independent repression function. Cell Res 20:276–287. doi: 10.1038/cr.2010.12. [DOI] [PMC free article] [PubMed] [Google Scholar]
- 14.Fang R, Barbera AJ, Xu Y, Rutenberg M, Leonor T, Bi Q, Lan F, Mei P, Yuan GC, Lian C, Peng J, Cheng D, Sui G, Kaiser UB, Shi Y, Shi YG. 2010. Human LSD2/KDM1b/AOF1 regulates gene transcription by modulating intragenic H3K4me2 methylation. Mol Cell 39:222–233. doi: 10.1016/j.molcel.2010.07.008. [DOI] [PMC free article] [PubMed] [Google Scholar]
- 15.van Essen D, Zhu Y, Saccani S. 2010. A feed-forward circuit controlling inducible NF-kappaB target gene activation by promoter histone demethylation. Mol Cell 39:750–760. doi: 10.1016/j.molcel.2010.08.010. [DOI] [PubMed] [Google Scholar]
- 16.Ciccone DN, Su H, Hevi S, Gay F, Lei H, Bajko J, Xu G, Li E, Chen T. 2009. KDM1B is a histone H3K4 demethylase required to establish maternal genomic imprints. Nature 461:415–418. doi: 10.1038/nature08315. [DOI] [PubMed] [Google Scholar]
- 17.Murray RK, Granner DK, Mayes PA, Rodwell VW. 1999. Harper's biochemistry, 25th ed Maruzen Co., Ltd., Tokyo, Japan. [Google Scholar]
- 18.Cusi K. 2012. Role of obesity and lipotoxicity in the development of nonalcoholic steatohepatitis: pathophysiology and clinical implications. Gastroenterology 142:711–725.e716. doi: 10.1053/j.gastro.2012.02.003. [DOI] [PubMed] [Google Scholar]
- 19.Leamy AK, Egnatchik RA, Young JD. 2013. Molecular mechanisms and the role of saturated fatty acids in the progression of non-alcoholic fatty liver disease. Prog Lipid Res 52:165–174. doi: 10.1016/j.plipres.2012.10.004. [DOI] [PMC free article] [PubMed] [Google Scholar]
- 20.Sookoian S, Rosselli MS, Gemma C, Burgueno AL, Fernandez Gianotti T, Castano GO, Pirola CJ. 2010. Epigenetic regulation of insulin resistance in nonalcoholic fatty liver disease: impact of liver methylation of the peroxisome proliferator-activated receptor gamma coactivator 1alpha promoter. Hepatology 52:1992–2000. doi: 10.1002/hep.23927. [DOI] [PubMed] [Google Scholar]
- 21.Pogribny IP, Tryndyak VP, Bagnyukova TV, Melnyk S, Montgomery B, Ross SA, Latendresse JR, Rusyn I, Beland FA. 2009. Hepatic epigenetic phenotype predetermines individual susceptibility to hepatic steatosis in mice fed a lipogenic methyl-deficient diet. J Hepatol 51:176–186. doi: 10.1016/j.jhep.2009.03.021. [DOI] [PMC free article] [PubMed] [Google Scholar]
- 22.Ahrens M, Ammerpohl O, von Schonfels W, Kolarova J, Bens S, Itzel T, Teufel A, Herrmann A, Brosch M, Hinrichsen H, Erhart W, Egberts J, Sipos B, Schreiber S, Hasler R, Stickel F, Becker T, Krawczak M, Rocken C, Siebert R, Schafmayer C, Hampe J. 2013. DNA methylation analysis in nonalcoholic fatty liver disease suggests distinct disease-specific and remodeling signatures after bariatric surgery. Cell Metab 18:296–302. doi: 10.1016/j.cmet.2013.07.004. [DOI] [PubMed] [Google Scholar]
- 23.Fujita N, Watanabe S, Ichimura T, Tsuruzoe S, Shinkai Y, Tachibana M, Chiba T, Nakao M. 2003. Methyl-CpG binding domain 1 (MBD1) interacts with the Suv39h1-HP1 heterochromatic complex for DNA methylation-based transcriptional repression. J Biol Chem 278:24132–24138. doi: 10.1074/jbc.M302283200. [DOI] [PubMed] [Google Scholar]
- 24.Zhang Y, Liu T, Meyer CA, Eeckhoute J, Johnson DS, Bernstein BE, Nusbaum C, Myers RM, Brown M, Li W, Liu XS. 2008. Model-based analysis of ChIP-Seq (MACS). Genome Biol 9:R137. doi: 10.1186/gb-2008-9-9-r137. [DOI] [PMC free article] [PubMed] [Google Scholar]
- 25.Sugimoto M, Wong DT, Hirayama A, Soga T, Tomita M. 2010. Capillary electrophoresis mass spectrometry-based saliva metabolomics identified oral, breast and pancreatic cancer-specific profiles. Metabolomics 6:78–95. doi: 10.1007/s11306-009-0178-y. [DOI] [PMC free article] [PubMed] [Google Scholar]
- 26.Saldanha AJ. 2004. Java Treeview—extensible visualization of microarray data. Bioinformatics 20:3246–3248. doi: 10.1093/bioinformatics/bth349. [DOI] [PubMed] [Google Scholar]
- 27.Pan D, Mao C, Wang YX. 2013. Suppression of gluconeogenic gene expression by LSD1-mediated histone demethylation. PLoS One 8:e66294. doi: 10.1371/journal.pone.0066294. [DOI] [PMC free article] [PubMed] [Google Scholar]
- 28.Mootha VK, Lindgren CM, Eriksson KF, Subramanian A, Sihag S, Lehar J, Puigserver P, Carlsson E, Ridderstrale M, Laurila E, Houstis N, Daly MJ, Patterson N, Mesirov JP, Golub TR, Tamayo P, Spiegelman B, Lander ES, Hirschhorn JN, Altshuler D, Groop LC. 2003. PGC-1alpha-responsive genes involved in oxidative phosphorylation are coordinately downregulated in human diabetes. Nat Genet 34:267–273. doi: 10.1038/ng1180. [DOI] [PubMed] [Google Scholar]
- 29.Subramanian A, Tamayo P, Mootha VK, Mukherjee S, Ebert BL, Gillette MA, Paulovich A, Pomeroy SL, Golub TR, Lander ES, Mesirov JP. 2005. Gene set enrichment analysis: a knowledge-based approach for interpreting genome-wide expression profiles. Proc Natl Acad Sci U S A 102:15545–15550. doi: 10.1073/pnas.0506580102. [DOI] [PMC free article] [PubMed] [Google Scholar]
- 30.Fang R, Chen F, Dong Z, Hu D, Barbera AJ, Clark EA, Fang J, Yang Y, Mei P, Rutenberg M, Li Z, Zhang Y, Xu Y, Yang H, Wang P, Simon MD, Zhou Q, Li J, Marynick MP, Li X, Lu H, Kaiser UB, Kingston RE, Xu Y, Shi YG. 2013. LSD2/KDM1B and its cofactor NPAC/GLYR1 endow a structural and molecular model for regulation of H3K4 demethylation. Mol Cell 49:558–570. doi: 10.1016/j.molcel.2012.11.019. [DOI] [PMC free article] [PubMed] [Google Scholar]
- 31.Calo E, Wysocka J. 2013. Modification of enhancer chromatin: what, how, and why? Mol Cell 49:825–837. doi: 10.1016/j.molcel.2013.01.038. [DOI] [PMC free article] [PubMed] [Google Scholar]
- 32.Zhou VW, Goren A, Bernstein BE. 2011. Charting histone modifications and the functional organization of mammalian genomes. Nat Rev Genet 12:7–18. doi: 10.1038/nrg2905. [DOI] [PubMed] [Google Scholar]
- 33.Seki E, Brenner DA, Karin M. 2012. A liver full of JNK: signaling in regulation of cell function and disease pathogenesis, and clinical approaches. Gastroenterology 143:307–320. doi: 10.1053/j.gastro.2012.06.004. [DOI] [PMC free article] [PubMed] [Google Scholar]
- 34.Czaja MJ. 2010. JNK regulation of hepatic manifestations of the metabolic syndrome. Trends Endocrinol Metab 21:707–713. doi: 10.1016/j.tem.2010.08.010. [DOI] [PMC free article] [PubMed] [Google Scholar]
- 35.Kakisaka K, Cazanave SC, Fingas CD, Guicciardi ME, Bronk SF, Werneburg NW, Mott JL, Gores GJ. 2012. Mechanisms of lysophosphatidylcholine-induced hepatocyte lipoapoptosis. Am J Physiol Gastrointest Liver Physiol 302:G77–G84. doi: 10.1152/ajpgi.00301.2011. [DOI] [PMC free article] [PubMed] [Google Scholar]
- 36.Hasenfuss SC, Bakiri L, Thomsen MK, Williams EG, Auwerx J, Wagner EF. 2014. Regulation of steatohepatitis and PPARgamma signaling by distinct AP-1 dimers. Cell Metab 19:84–95. doi: 10.1016/j.cmet.2013.11.018. [DOI] [PMC free article] [PubMed] [Google Scholar]
- 37.Glatz JF, Luiken JJ, Bonen A. 2010. Membrane fatty acid transporters as regulators of lipid metabolism: implications for metabolic disease. Physiol Rev 90:367–417. doi: 10.1152/physrev.00003.2009. [DOI] [PubMed] [Google Scholar]
- 38.Hebbard L, George J. 2011. Animal models of nonalcoholic fatty liver disease. Nat Rev Gastroenterol Hepatol 8:35–44. doi: 10.1038/nrgastro.2010.191. [DOI] [PubMed] [Google Scholar]
- 39.Gupta J, Kumar S, Li J, Krishna Murthy Karuturi R, Tikoo K. 2012. Histone H3 lysine 4 monomethylation (H3K4me1) and H3 lysine 9 monomethylation (H3K9me1): distribution and their association in regulating gene expression under hyperglycaemic/hyperinsulinemic conditions in 3T3 cells. Biochimie 94:2656–2664. doi: 10.1016/j.biochi.2012.08.011. [DOI] [PubMed] [Google Scholar]
- 40.Veazey KJ, Carnahan MN, Muller D, Miranda RC, Golding MC. 2013. Alcohol-induced epigenetic alterations to developmentally crucial genes regulating neural stemness and differentiation. Alcohol Clin Exp Res 37:1111–1122. doi: 10.1111/acer.12080. [DOI] [PMC free article] [PubMed] [Google Scholar]
- 41.Fuest M, Willim K, MacNelly S, Fellner N, Resch GP, Blum HE, Hasselblatt P. 2012. The transcription factor c-Jun protects against sustained hepatic endoplasmic reticulum stress thereby promoting hepatocyte survival. Hepatology 55:408–418. doi: 10.1002/hep.24699. [DOI] [PubMed] [Google Scholar]
- 42.Heintzman ND, Stuart RK, Hon G, Fu Y, Ching CW, Hawkins RD, Barrera LO, Van Calcar S, Qu C, Ching KA, Wang W, Weng Z, Green RD, Crawford GE, Ren B. 2007. Distinct and predictive chromatin signatures of transcriptional promoters and enhancers in the human genome. Nat Genet 39:311–318. doi: 10.1038/ng1966. [DOI] [PubMed] [Google Scholar]
- 43.Barski A, Cuddapah S, Cui K, Roh TY, Schones DE, Wang Z, Wei G, Chepelev I, Zhao K. 2007. High-resolution profiling of histone methylations in the human genome. Cell 129:823–837. doi: 10.1016/j.cell.2007.05.009. [DOI] [PubMed] [Google Scholar]
Associated Data
This section collects any data citations, data availability statements, or supplementary materials included in this article.