Abstract
Background:
Excessive sleep fragmentation (SF) is common in pregnant women. Adult-onset metabolic disorders may begin during early development and exhibit substantial sex dimorphism. We hypothesized that metabolic dysfunction induced by gestational SF in male mice would not be apparent in female littermates.
Methods:
Body weight and food consumption were measured weekly in male and female offspring after late gestational SF or control sleep (SC). At 20 weeks, plasma leptin, adiponectin, lipid profiles, and insulin and glucose tolerance tests were assessed. Leptin and adiponectin, M1, and M2 macrophage messenger RNA expression and polarity were examined. Adiponectin gene promoter methylation levels in several tissues were assessed.
Results:
Food intake, body weight, visceral fat mass, and insulin resistance were higher, and adiponectin levels lower in male but not female offspring exposed to gestational SF. However, dyslipidemia was apparent in both male and female offspring exposed to SF, albeit of lesser magnitude. In visceral fat, leptin messenger RNA expression was selectively increased and adiponectin expression was decreased in male offspring exposed to gestational SF, but adiponectin was increased in exposed female offspring. Differences in adipokine expression also emerged in liver, subcutaneous fat, and muscle. Increased M1 macrophage markers were present in male offspring exposed to SF (SFOM) while increased M2 markers emerged in SF in female offspring (SFOF). Similarly, significant differences emerged in the methylation patterns of adiponectin promoter in SFOM and SFOF.
Conclusion:
Gestational sleep fragmentation increases the susceptibility to obesity and metabolic syndrome in male but not in female offspring, most likely via epigenetic changes. Thus, sleep perturbations impose long-term detrimental effects to the fetus manifesting as sex dimorphic metabolic dysfunction in adulthood.
Citation:
Khalyfa A, Carreras A, Almendros I, Hakim F, Gozal D. Sex dimorphism in late gestational sleep fragmentation and metabolic dysfunction in offspring mice. SLEEP 2015;38(4):545–557.
Keywords: adiponectin, epigenetic alterations, gestation, insulin resistance, metabolic syndrome, obesity, sexual dimorphism, sleep fragmentation
INTRODUCTION
Maternal health during gestation is critical for predicting fetal outcomes and adult diseases later in life.1 Evidence from both clinical and experimental studies indicates that early life environments play an important role in influencing later susceptibility to particular chronic diseases.2 In addition, some metabolic disorders, which become manifest in adult life, may have their roots during early development, and are thought to reflect fetal programming, the process by which the same genotype can give rise to divergent phenotypes according to early environmental conditions.3 Furthermore, the clinical manifestations of various epigenetically associated metabolic diseases, such as diabetes and obesity, appear to exhibit substantial gender-related differences.4
Obstructive sleep apnea (OSA) is the most prevalent form of sleep disordered breathing (SDB) both in adults and children. OSA is characterized by episodes of total and/or partial collapse of the upper airway alternating with normal breathing during sleep, leading to chronic intermittent hypoxia and sleep fragmentation (SF). It has now become quite apparent that SDB can initiate or contribute to the progression of several cardiovascular and metabolic diseases.5 Pregnancy has been associated with a high frequency of multiple sleep disturbances including SDB, especially in the third trimester.6 This period is characterized by increased frequency of snoring, disturbed sleep, daytime tiredness, decreased daytime alertness, and poor sleep quality. The prevalence of habitual snoring during late gestation hovers around 35%, compared with 4–14% of non-pregnant females of similar age.6 Several studies have evaluated the association between SDB symptoms in pregnancy and adverse fetal outcomes, but all of these studies were specifically circumscribed to the immediate postnatal period and did not explore long-term consequences of perturbed sleep during gestation. In a recent study, we showed that SF during late gestation in a murine model induced substantial metabolic derangements in male offspring mice as they reached adulthood.7 However, we did not examine whether such long-term effect of SF were also apparent in female offspring.
Indeed, sexual dimorphism of body composition, especially with regard to fat tissue distribution, is considered to modulate the risk of obesity, diabetes, and associated metabolic disorders.8 Sex-based differences play a role in metabolic rate and energy expenditure, as well as fat deposition and fat mobilization.9 Studies in human and animal models have demonstrated significant sex differences in the propensity to develop the metabolic syndrome. For example, female subjects exhibit less severe obesity-related metabolic disorders such as insulin resistance than male subjects.10 Furthermore, sons and daughters are at differential risk for various late-onset diseases that are apparently related to either the mother's diet or fetal environment during gestation.11–13 For instance, sons of obese mothers are more likely than daughters to become obese and insulin-resistant as they mature, even though no differences in birth weight may be apparent.13 In animal models, only male rat offspring exposed to maternal undernutrition during the preimplantation period exhibit elevated blood pressure,14,15 and disrupted maternal nutritional environments selectively elicit adverse consequences in male offspring.16–18
To further understand the mechanisms underlying developmental programming, various animal models have been used, in which hormonal and metabolic prenatal or postnatal environment were altered through changes in maternal nutritional status.19 Exposure to a high-fat diet in utero induces a metabolic syndrome-like phenotype in the offspring through epi-genetic modifications of adipocytokines such as adiponectin and leptin genes.20,21 In this study, we examined the potential sex dimorphic effects of SF during late gestation on the programming of metabolic function in the adult offspring with special emphasis on adipocytokine genes.
METHODS
Animal Experiments
All experiments were approved by the University of Chicago's animal care committee (IACUC protocol # 72169). Male and female C57BL/6J mice were purchased from Jackson Laboratories (Bar Harbor, ME, USA) for breeding. After arrival, all animals were allowed to recover within the animal care facility for 7 days. Animals were fed normal chow diet and were housed in a controlled environment with 12-h light-dark cycles (07:00 to 19:00) in constant temperature (24 ± 2°C) with ad libitum access to food and water.
Pregnant Female Mice
Adult individual male and virgin female at 3 months of age were used for breeding to generate only one litter. Male mice were removed after inspection of the female revealed the presence of a copulation plug, considered as corresponding to day 1 of gestation. Following 14 days of pregnancy, mice were distributed into two groups: control sleep (SC) mice were housed in standard housing conditions in cages in which the SF device was not operational but the motor was kept running, and sleep fragmented pregnant mice (SF) were exposed to a sleep fragmentation paradigm for five days (days 14 to 19 of gestation). Upon delivery, all litters were immediately culled to six pups with random selection of the remaining litter composition. During lactation, all mothers were fed with regular low-fat chow diet and pups were kept with their mothers until weaning.
Sleep Fragmentation
The SF device used to induce SF in rodents has been previously described,22–26 and uses intermittent tactile stimulation of freely behaving mice in a standard laboratory mouse cage, using a near-silent motorized mechanical sweeper. This method prevents the need for human contact and intervention, eliminates the need for introduction of foreign objects or touching of the animals during sleep, and is therefore superior to any other existing methods of chronic sleep disruption. To induce moderate to severe sleep fragmentation, we choose a 2-min interval between each sweep, implemented during the light period (07:00 to 19:00).
Offspring
After being weaned, offspring male (i.e., SCOM and SFOM) and female mice (i.e., SCOF and SFOF) were placed in individual cages, had unrestricted access to water and regular chow diet, and were housed in standard conditions in a temperature-controlled room (24 ± 2°C) with 12:12 h light–dark cycles (lights on at 07:00). Body weights of each of the offspring mice (SC or SF) were assessed from birth until 20 weeks of age. At least six different litters that included random numbers of male and female offspring were included in each of the experiments reported below. All animals were periodically monitored for signs of morbidity, mortality, and ruffled fur. Body weight and food intake were weekly measured at the same time.
Glucose and Insulin Tolerance Tests
Intraperitoneal glucose tolerance test (GTT) was performed at 20 weeks of age. Mice were injected glucose (intra-peritone-ally 2 mg/g body weight) after 3 h of fasting. Access to water was available and unrestricted during the fasting period. Blood samples for glucose determination were collected in heparin-coated capillary tubes from the tail vein at 0, 15, 30, 60, 90, and 120 min. The glucose response during the GTT was evaluated by estimating the total area under the glycemic curve as previously described.27
Intraperitoneal insulin tolerance tests (ITT) were performed in fasting conditions (3 h) at 20 weeks of age in a separate set of all offspring mouse groups (SCOM, SCOF, SFOM, and SFOF). Mice were injected intra-peritoneally with insulin (0.25 U/kg of body weight) and blood samples were collected via the tail vein from each mouse, and glucose levels were immediately measured using an OneTouch Ultra2 glucometer (Life Scan; Milpitas, CA, USA). Blood samples for insulin determination were also concurrently obtained from the cut tip of the tail at 0, 15, 30, 60, and 120 min following injection. Insulin resistance was assessed using both the homeostasis model assessment (HOMA) equation (fasting insulin μU/mL × fasting glucose mg/dL/405) for time 0 and by analysis of ITT glycemic trajectories as previously described.27
Plasma Measurements
As indicated, mice were fasted for 3 h, and blood collected in vacutainer tubes containing EDTA (Becton Dickinson, Franklin Lakes, NJ, USA). The collected fresh blood was centrifuged at 2000×g for 20 min at 4°C; subsequently plasma was centrifuged for 5 min at 13,000 rpm to remove remaining cells and platelets, and immediately frozen at −80°C until further analysis. Plasma insulin, leptin, and adiponectin levels were examined using enzyme-linked immunosorbent assay kits (Millipore, Billerica, MA, USA) according to the manufacturer's protocol. Lipid profiles, including total cholesterol, and triglycerides (TG) were determined using Infinity kits (Thermo Scientific, Pittsburgh, PA, USA). For the insulin assay, the appropriate range of the assay was 0.2–10 ng.mL−1, with the limit of sensitivity at 0.2 ng.mL−1, and intra-assay and interassay variations at 3.73% and 10.52%, respectively, within the assay range. For the leptin assay, the appropriate range was 0.2– 30 ng.mL−1, with the sensitivity threshold at 0.05 ng.mL−1, and intra-assay and interassay variations at 1.49% and 3.85%, respectively, within the assay range. For the adiponectin assay, the appropriate range was 1–50 ng.mL−1, with the sensitivity threshold at 0.2 ng.mL−1, and intra-assay and interassay variations at 5.75% and 5.98%, respectively, within the assay range.
Total RNA Extraction and Quantitative Reverse Transcription-Polymerase Chain Reaction
In another set of mice, various organs including subcutaneous (SCAT) and visceral white adipose tissues (VWAT), liver, and quadriceps as skeletal muscle were dissected from nonfasted mice. Total RNA were isolated using automated RNA extraction (Promega, Madison, WI, USA) according to manufacturer's protocol. The RNA quality and integrity were determined using the Eukaryote Total RNA Nano 6000 Lab-Chip assay (Agilent Technologies, Santa Clara, CA) on an Agilent 2100 Bioanalyzer.
Quantitative reverse transcription-polymerase chain reaction (qRT-PCR) gene expression assays (TaqMan; Applied Biosystems, Foster City, CA, USA) were performed using TaqMan gene expression. The target genes included: monocyte chemoattractant protein 1 (MCP-1), tumor necrosis factor-α (TNF-α), leptin, leptin receptor, adiponectin, adiponectin receptors 1 and 2, interleukin 6 (IL-6), Fizz-1 (“Found in the inflammatory zone” and also referred to as RELMα for Resistin-like molecule α), and IL-10, and their expression levels were assessed by qRT-PCR using high-capacity RNA to complementary DNA (cDNA) Master Mix (Applied Biosystems) and TaqMan PCR Master Mix (Applied Biosystems). Reverse transcription of total RNA was conducted with TaqMan reverse transcription reagents RT-PCR kit according to the manufacturer's instructions (Applied Biosystems). Gene expression was quantified as the second step of a two-step RTPCR. Reaction conditions consisted of pre-incubation at 50°C for 2 min and 95°C for 10 min, followed by 40 cycles of 95°C for 15 sec and 60°C for 1 min. Because other commonly used housekeeping genes are affected by SF (Khalyfa A and Gozal D, unpublished observations, 2013), 18S ribosomal messenger RNA (mRNA) expression was used as an internal control. The CT values were recorded automatically.
Flow Cytometry
Visceral and subcutaneous fat pads were minced in Krebs-Ringer bicarbonate buffer supplemented with 1% bovine serum albumin and incubated with collagenase (1 mg/mL; Worthington Biochemical Corporation, Lakewood, NJ, USA) at 37°C for 45 min with shaking. Cell suspensions were filtered through a 100-mm mesh and centrifuged at 500 g for 5 min to separate floating adipocytes from the stromal-vascular fraction (SVF) pellet. SVF pellets were then resuspended in fluorescence-activated cell sorting buffer (phosphate buffered saline plus 2% fetal bovine serum) and 105 cells were used for staining with fluorescence-conjugate primary antibodies or control immunoglobulin G at 4°C for 30 min. Cells were then washed twice and analyzed with a flow cytometer (Canto II; BD Biosciences, San Jose, CA, USA). Data analysis was performed using the FlowJo software (Tree Star, Ashland, OR, USA). Adipose tissue macrophages were defined as F4/80+ and CD11b+ cells, from which M1 and M2 macrophages were identified as CD11c+ or CD206+ cells, respectively. Flow cytometric analysis gating strategy included selection for F4/80 positive low CD11b low and F4/80 high (low-high), and high CD11b and high F4/80 (high-high).28 All antibodies were from Biolegend (San Diego, CA, USA).
Pyrosequencing
Genomic DNA were isolated from mouse liver, skeletal muscle, and visceral tissues using automated system (Promega, Madison, WI, USA) according to the manufacturer's protocol. Bisulfite modification of genomic DNA was carried out according to previously reported methods.29 Briefly, bisulfite conversion of DNA was performed using EZ DNA Methylation Gold kit (Zymo Research, Irvine, CA, USA) following the manufacturer's protocol. This bisulfite modification was carried out using Zymo Research EZ Methylation kit. About 200 ng of sample DNA was used for bisulfite modification followed by the PCR amplification at the following temperatures; 95°C 15 min; 40 cycles (95°C 30s; 56°C 30s; 72°C 30s); 72°C for 5 min; 4°C. Quantitative bisulfite Pyrosequencing was used to determine the percentage methylation at individual CpG sites within the differentially methylated region 0 and promoters. Assays performed in this study included adiponectin, leptin, and leptin receptor gene promoter regions.
Statistical Analyses
The results are presented as the mean ± standard error of the mean for the number of mice (n) indicated. All analyses were conducted using SPSS software (version 18; Chicago, IL, USA). A two-tailed P < 0.05 was considered statistically significant. The data were analyzed by one-way or two-way (sex and experimental condition) analysis of variance (ANOVA) followed by the Tukey-Kramer test for individual differences between groups. Nonpaired t tests were used whenever appropriate, and P < 0.05 indicated a significant difference.
RESULTS
Body Weight and Food Intake
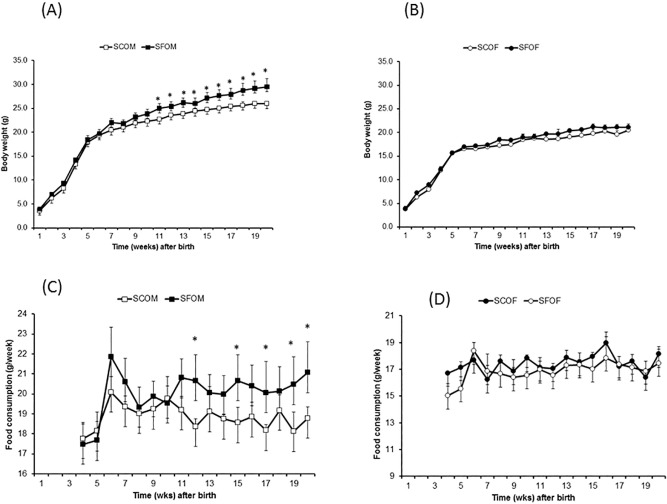
At birth, there were no significant differences in body weight for any of the pregnant dams or among the offspring mice (male: SFOM, SCOM, or female: SFOF, SCOF; Figure 1A). However, after 20 weeks of age, SFOM exhibited increased body weight (∼10% higher versus SCOM; P < 0.0001), and consumed more food intake g/week (P < 0.0001; Figure 1C). These differences in body weight started emerging around week 11–12 of life in SFOM, but were absent altogether in female offspring (Figure 1B and 1D; SFOF versus SCOF – P > 0.05).
Figure 1.
Body weight and food consumption in offspring of mice exposed to late gestational sleep fragmentation. (A,B) Body weight of males and females, respectively. Differences between SF and SC reached statistical significance after weeks 11–12 weeks of age in male (two-way analysis of variance (ANOVA) for repeated measures: P < 0.001), whereas in females no significant differences are apparent. (C,D) Food intake in male (SFOM and SCOM), and female (SCOF, and SFOF), respectively. Food intake is expressed as g/week and is increased in SFOM mice (two-way ANOVA for repeated measures: P < 0.0001). Data are presented as mean ± standard error; n = 18 per experimental group corresponding to at least six to seven litters/condition. *P < 0.01. SF, sleep fragmentation; SC, control sleep; SCOF, sleep control female mice; SCOM, sleep control male mice; SFOF, sleep fragmented female mice; SFOM, sleep fragmented male mice.
Fat Mass Distribution
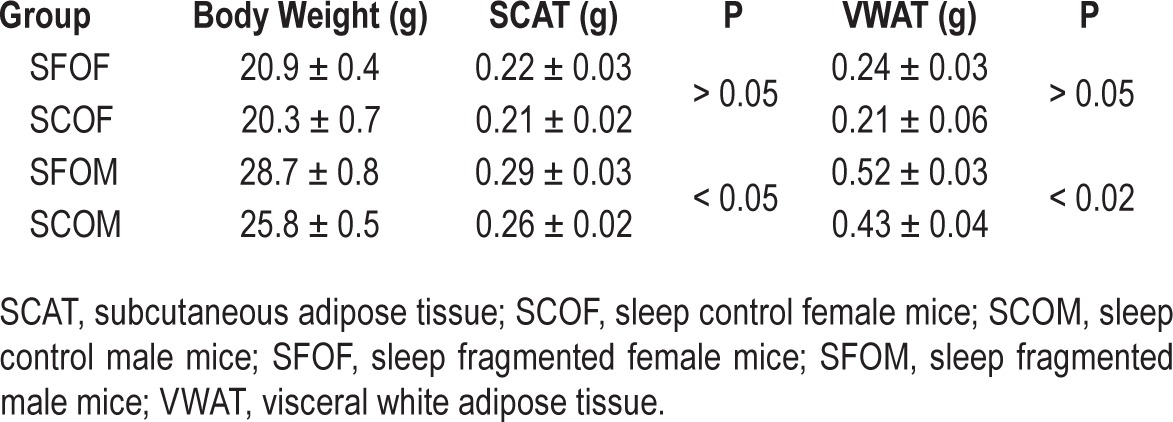
The mass of subcutaneous and visceral fats adipose tissue compartments in all four groups is shown in Table 1. SFOM exhibited higher SCAT and VWAT masses compared to SCOM (VWAT: P < 0.02; SCAT: P < 0.04). However, there were no significant differences in these two adipose tissue depots between SFOF and SCOF.
Table 1.
Body weight and adipose tissue mass in subcutaneous and visceral adipose tissue depots in offspring mice at 20 weeks of age.
Glucose Tolerance Test
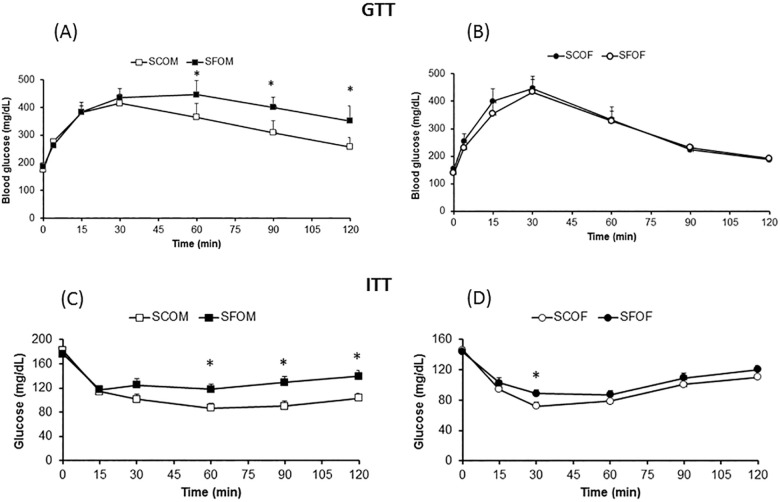
Fasting blood glucose levels were not different between offspring mice exposed to SC and SF during late gestation (Figure 2A and Table 2). Furthermore, markedly altered GTT curves with significantly higher peak glycemic levels after glucose injection and slower glucose level decline kinetics were apparent in SFOM when compared to SCOM, with no significant differences being present in female offspring (Figure 2).
Figure 2.
Effect of sleep fragmentation SF exposures in utero on GTT and ITT in offspring mice at 20 weeks of age. (A,B) GTT for males (SCOM and SFOM), and females (SCOF and SFOF), respectively. (C,D) ITT experimental results. Data are presented as mean ± standard deviation; SC versus SF at time point: *P < 0.05; n = 10–12/experimental condition. Two-way analysis of variance for repeated measures (SFOM versus. all other experimental groups: P < 0.0001). GTT, glucose tolerance text; ITT, insulin tolerance test; SF, sleep fragmentation; SC, sleep control; SCOF, sleep control female mice; SCOM, sleep control male mice; SFOF, sleep fragmented female mice; SFOM, sleep fragmented male mice.
Table 2.
Fasting plasma levels of lipids, glucose and insulin and adipokines in male and female offspring mice at 20 weeks of age.

Insulin Tolerance Test
Compared to SCOM, SFOM exhibited higher plasma glucose levels following exogenous insulin administration, indicating the presence of insulin resistance (Figure 2). However, insulin resistance was not present in female offspring mice, even among those who had been exposed to SF during late gestation. Similarly, fasting homeostasis model assessment-estimated insulin resistance (HOMA-IR) revealed significant increases in the SFOM group compared to SCOM mice (P < 0.003; Table 2), but similar HOMA-IR values emerged for SFOF and SCOF (P > 0.05). These data indicate that maternal SF imposes significant metabolic effects on male, but not on female offspring by the time they reach adulthood.
Lipid Profiles and Adipokine Levels
At 20 weeks of age, SFOM mice had significantly higher fasting total cholesterol (P < 0.005), and triglyceride serum levels (P < 0.006) compared to SCOM (Table 2). In SFOF, such differences were present (versus SCOF), but were of a lesser magnitude (Table 2). Plasma fasting leptin concentrations were higher in SFOM mice (P < 0.003), and conversely adiponectin levels were markedly lower (P < 0.002), with no significant differences being present between SFOF and SCOF (Table 2).
Gene Expression Patterns in Multiple Organs
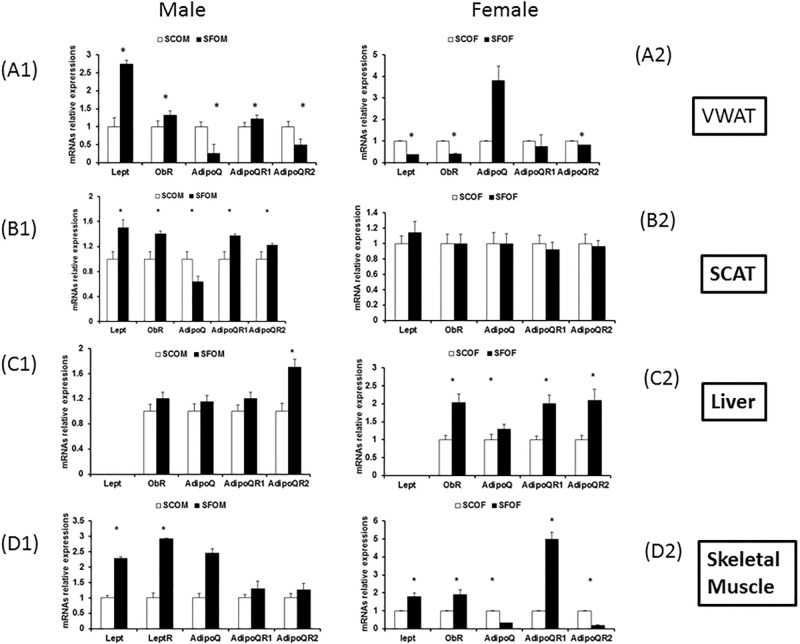
qRT-PCR for leptin, leptin receptor (ObR) and adiponectin (AdipoQ), adiponectin receptors (AdipoQR1 and AdipQR2) in various tissues, including adipose tissue depots (VWAT and SCAT), liver, and skeletal muscle in 20-week-old off-spring (Figure 3). In VWAT (Figure 3A1), leptin mRNA expression levels and its receptor were significantly upregulated in SFOM versus SCOM (P < 0.002 and P < 0.005, respectively). In SFOF, however, there were significant declines in mRNA of leptin and its receptor (versus SC-OF: P < 0.04 and P < 0.006, respectively; Figure 3A2). Conversely, AdipoQ expression was markedly reduced in SFOM (P < 0.0001), whereas significant increases occurred in SFOF (P < 0.03; Figure 3A1 and 3A2).
Figure 3.
Effect of SF exposures during late gestation on adipokines and their cognate receptor gene expression in adipose tissue depots (VWAT and SCAT), liver, and skeletal muscle in 20-week-old offspring. (A1–D1) Gene expression in males. (A2–D2) Gene expression in female offspring. Data were normalized to 18S messenger RNA level. The results are shown as the mean ± standard error (n = 6–8 for each experimental condition) *P < 0.05. AdipoQ, adiponectin; AdipoQR1 and AdipoQR2, adiponectin receptors; lept, leptin; ObR, leptin receptor; SCAT, subcutaneous adipose tissue; SCOF, sleep control female mice; SCOM, sleep control male mice; SFOF, sleep fragmented female mice; SFOM, sleep fragmented male mice; VWAT, visceral white adipose tissue.
A similar pattern emerged among SFOM in SCAT (Figure 3B1) and no differences in the expression of these genes occurred in SCAT of SFOF and SCOF (Figure 3B2). In liver tissues, leptin expression levels were undetectable in both male and female mice. However, there were significant increases in the expression in ObR (P < 0.02), AdipoQ (P < 0.01), adipoQR1 (P < 0.03), and adipoQR2 (P < 0.002) in SFOF which were absent in SMOM except for increases in AdipoQR2 (Figures 3C1 and 3C2). In skeletal muscles, we found significant increases of leptin (P < 0.001), ObR (P < 0.002), and AdipoQ (P < 0.004) in SFOM, whereas significant increases in leptin, ObR, and AdipoQR1 were present in SFOF, with reductions in AdipoQ and AdipoQR2 being noted as well (Figures 3D1 and 3D2).
Macrophage Subtypes and Inflammatory Gene Expression in VWAT and SCAT
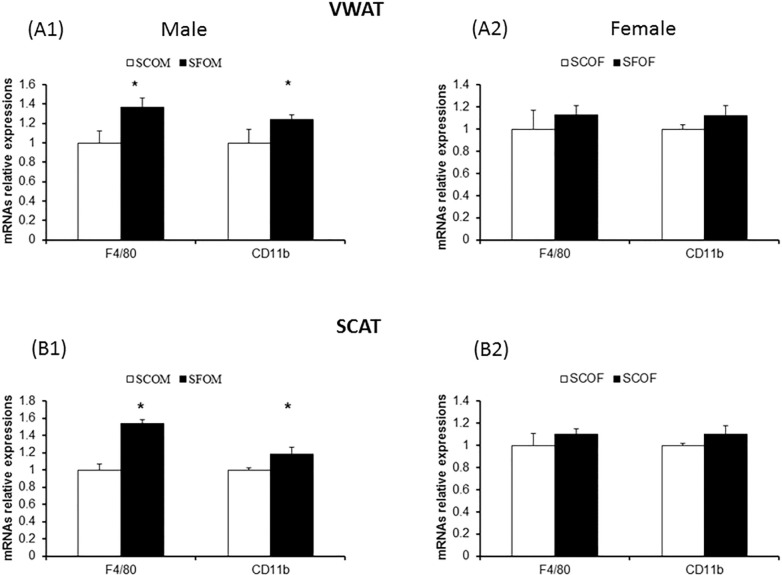
To examine whether SF during late gestation alters the presence of macrophages in adipose tissue depots and potentially changes their polarity and distribution, we studied gene expression of macrophage markers and inflammatory cytokines in both VWAT and SCAT using qRT-PCR and flow cytometry approaches. We selected several genes that illustrate macrophages (F4/80 and CD11b), as well as genes that are preferentially associated with either a M1 (TNF-α, MCP-1, IL-6) or a M2 (Fizz1 and Il-10) macrophage phenotype. In both VWAT and SCAT, both SFOM and SFOF exhibited mild, albeit significant increases in F4/80 and CD11b expression, suggesting the presence of increased number of macrophages (Figure 4). However, no significant differences emerged between sexes.
Figure 4.
Effect of sleep fragmentation (SF) exposures during late gestation on macrophage gene expression (F4/80 and CD11b) in adipose tissue depots (VWAT and SCAT) in 20-week-old offspring. (A1,B1) Gene expression in males. (A2,B2) Gene expression in female offspring. Increased expression of macrophage related genes emerged in SF versus sleep control (P < 0.01). However, no significant differences between male and female offspring mice occurred. Data were normalized to 18S mRNA level. The results are shown as the mean ± standard error (n = 6–8 for each experimental condition). mRNA, messenger RNA; SCAT, subcutaneous adipose tissue; SCOF, sleep control female mice; SCOM, sleep control male mice; SFOF, sleep fragmented female mice; SFOM, sleep fragmented male mice; VWAT, visceral white adipose tissue.
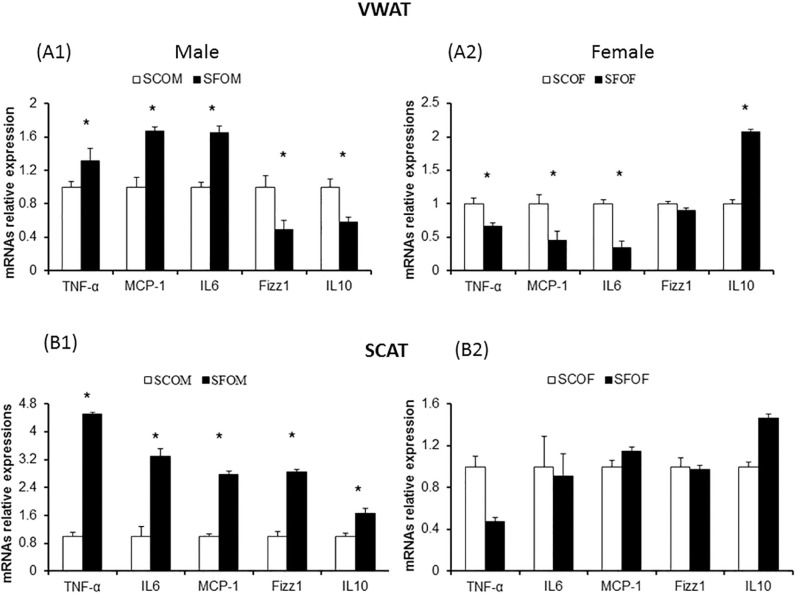
In contrast, VWAT in SFOM exhibited marked increases in M1 markers when compared to SCOM, whereas inverse patterns were detected in SFOF, in whom marked increases particularly in IL10 emerged indicated in a preferential M2 phenotype in VWAT (Figure 5). Similar overall findings were detected in SCAT, with the exception hat increases in both M1 and M2 markers occurred in SFOM (Figure 5).
Figure 5.
Effect of sleep fragmentation exposures during late gestation on macrophage M1 and M2 polarity-associated genes in adipose tissue depots (VWAT and SCAT) in 20-week-old offspring. (A1,B1) Gene expression in males. (A2,B2) Gene expression in female offspring. Increased expression of M1 macrophage-related genes with significant reductions in M2 macrophage gene expression emerged in SFOM versus SCOM in VWAT and SCAT (*P < 0.01). An inverse pattern of M1 and M2 gene expression changes was apparent in sleep fragmentation-exposed female offspring in both VWAT and SCAT (*P < 0.01). Data were normalized to 18S mRNA level. The results are shown as the mean ± standard error (n = 6–8 for each experimental condition). IL, interleukin; MCP, monocyte chemoattractant protein; mRNA, messenger RNA; SCAT, subcutaneous adipose tissue; SCOF, sleep control female mice; SCOM, sleep control male mice; SFOF, sleep fragmented female mice; TNF, tumor necrosis factor; SFOM, sleep fragmented male mice; VWAT, visceral white adipose tissue.
Flow Cytometry
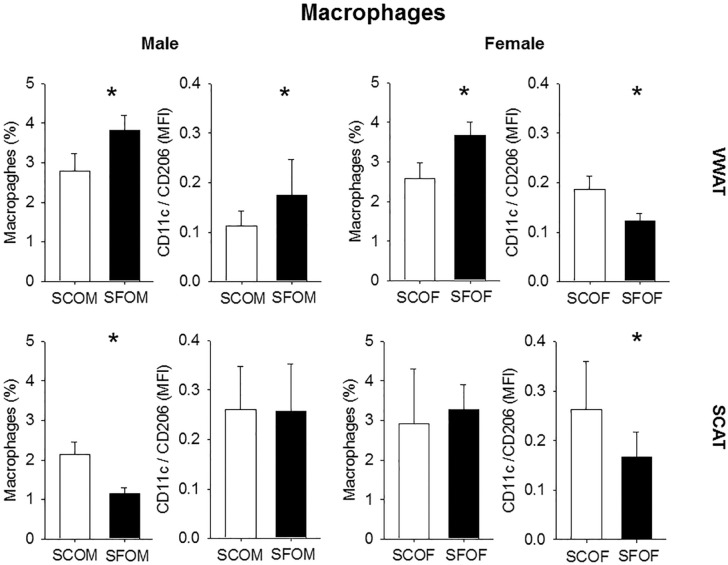
Considering the aforementioned findings, we performed flow cytometric analyses for the presence of macrophages and their polarity using flow cytometry in collagenase-digested SVF obtained from male and female in VWAT and SCAT depots. SF exposures in utero are associated with increased number of macrophages in the VWAT SVF of SFOM, but also in SFOF (Figure 6; n = 8/experimental group). However, although such increases were primarily represented by macrophages exhibiting the proinflammatory M1 phenotype in SFOM (i.e., increased CD11c/CD206; Figure 6), SFOF showed reductions in pro-inflammatory macrophage predominance (Figure 6; n = 8/experimental group). Of note, SCAT manifested a divergent pattern of polarity changes (Figure 6).
Figure 6.
Macrophage population and M1/M2 macrophage ratios in VWAT and SCAT in 20-week-old offspring after being exposed to sleep fragmentation or sleep control conditions during late gestation. The results are shown as the mean ± standard error (n = 6–8 for each experimental condition); *P < 0.01. SCAT, subcutaneous adipose tissue; SCOF, sleep control female mice; SCOM, sleep control male mice; SFOF, sleep fragmented female mice; SFOM, sleep fragmented male mice; VWAT, visceral white adipose tissue.
DNA Methylation
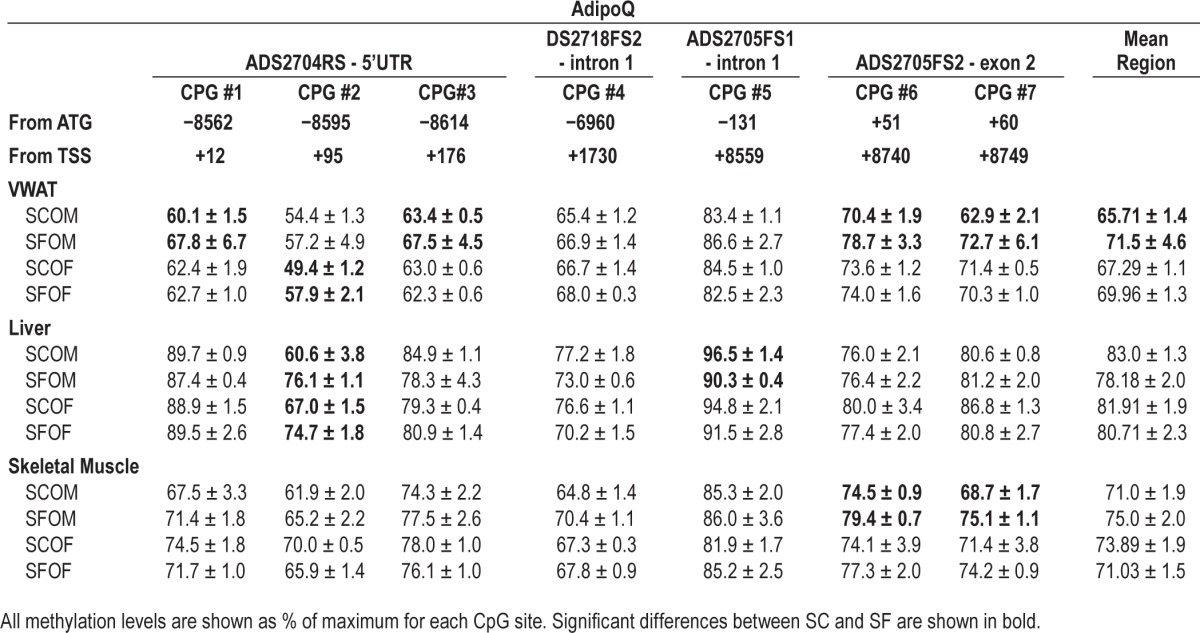
Methylation of AdipoQ gene promoter was also examined VWAT, liver, and muscle tissues of all four groups. The data presented in Table 3 show individual Cytosine-phosphate-Guanine (CpG) island methylation levels for each of the tissues and conditions. Differences in methylation between SF and SC mice emerged that were both tissue and CpG site specific. Globally, SFOM mice exhibited enhanced methylation of AdipoQ, particularly in VWAT (Table 3). Indeed, we found four CpG sites in AdipoQ at positions (+12, +176, +8740 and +8749) from transcriptional start site (TSS) that showed increased methylation in SFOM compared to SCOM mice (Table 3), whereas in SFOF there was only one CpG site in AdipoQ in which increased methylation was found at position +95 from TSS. Increased methylation at CpG sites were also found for AdipoQ in SFOM only in liver and skeletal muscle (Table 3).
Table 3.
Adiponectin gene methylation levels in 20-week-old offspring from pregnant mice exposed to SF during third trimester of gestation.
Based on these findings, we next looked at gene expression levels for DNA methyltransferases (DNMTs) including DNMT1, DNMT3a, and DNMT3b in VWAT in all four experimental groups. We found no evidence of significant differences in DNMT1 mRNA expression in SFOM compared to SCOM or between SFOF and SCOF (Table 4). However, expression of both DNMT3a and DNMT3b was markedly increased in SFOM (P < 0.002, and P < 0.003, respectively; Table 3), whereas in SFOF such changes were absent altogether (Table 4).
Table 4.
Expression of DNMT genes in VWAT of male and female offspring mice at 20 weeks of age.

DISCUSSION
In this study we show that sleep fragmentation during late gestation is associated with profound metabolic alterations, such as obesity, insulin resistance, and abnormal serum lipids in male offspring (SFOM) but not in their female littermates (SFOF). The mechanisms underlying this apparent sex dimorphism are unclear. In an effort to identify potential factors contributing to these sex-related disparities in phenotype, we also found altered gene expression and plasma levels of adipokines, as well as major differences in macrophage populations, particularly in VWAT. Furthermore, macrophage polarity was also distinctly affected in SFOM and SFOF, with the SFOM exhibiting increased abundance of the proinflammatory M1 macrophage phenotype, whereas the opposite, i.e., increased M2 abundance, was apparent in the VWAT tissues of SFOF mice. Moreover, epigenetic modifications such as increased methylation patterns in the AdipoQ gene promoter were clearly and dominantly present in SFOM, and are anticipated to account for aspects of the late adult-onset metabolic dys-function provoked by sleep perturbations during late gestation in male fetuses.
It widely recognized that diseases such as obesity, diabetes, dyslipidemia, and hypertension are a major cause of public health concern. These chronic diseases are not only dependent on adult lifestyle, but can be initiated and amplified in the context of adverse environmental stimuli encountered during early development.30 Studies from humans and animal models have demonstrated that predisposition to impaired glucose tolerance, blood pressure, and coronary heart disease may originate in fetal life.31 Thus, intrauterine environments can impose a significant long-term influence on body weight, energy homeostasis, and metabolic function in the offspring.32,33 To date, most of the studies have relied on a high-fat diet or alternatively malnutrition during pregnancy or perinatal period to assess the long-term consequences of such perturbations.21,34–40 Such studies have undoubtedly unraveled the link between metabolic stressors during pregnancy and the emergence of metabolic phenotypes in the offspring as they reach adult age.
In this study, after we identified a profound metabolic phenotype in male adult offspring subjected to perturbed sleep during late fetal life, we explored the potential presence of sex dimorphic effects of late gestational sleep fragmentation. To prevent nutritional confounding, we further provided standard low-fat chow diets to both pregnant mice and to all offspring mice after weaning, and thus focus our approach on the isolated effects of sleep fragmentation during late gestation. Sleep related complaints are common in pregnancy and many of the physiological and hormonal changes that occur during pregnancy may contribute to an increased risk for SDB.6 Our experimental SF paradigm was tailored to selectively mimic the sleep disruption of gestational SDB, such that the potential consequences of intermittent hypoxia and hyper-capnia on the fetus remain to be established. In this context, exposing the control dams to the same minimal noise of the motor driving the sweeper and cage environment (sweeper present but inactive) would cancel out any potential environmental stressor confounders introduced by differences in noise levels or objects in cage. Additional precautions to randomize the culling such that gender distribution in litters would be a priori uncontrolled and inclusion of mice derived from multiple litters in each of the experiments further reduce the potential inclusion of biases that could affect our findings. However, we cannot be certain that the maternal milk composition and overall lactating ability and disposition of the SF-exposed dams was not affected, even though no evidence for altered body weight trajectories were apparent during the first 3 weeks of life until weaning. To overcome this potential issue, use of surrogate mothers for all pups would be necessary.
Increasing evidence suggests that clinical manifestation of various metabolic diseases, such as diabetes and obesity are largely influenced by sex.4,9 The differential expansion of adi-pose tissue depots is very important because the association with metabolic disorders is stronger for (VWAT excess than for subcutaneous (SCAT) accumulation.41 A few studies have reported that males and females respond differently to maternal insults during pregnancy and lactation. For example, male offspring from obese mothers exhibit a pattern of excessive body fat accumulation compared to female offspring, but more studies need to be conducted to gain a better understanding of sexual dimorphism.42 In our experiments, the weight trajectories of SFOM mice showed statistical separation around 11–12 weeks of age, but such differences failed to emerge even at 20 weeks of age in SFOF. Although the mechanisms for such sexually dimorphic trajectories are unknown, they have been quite frequently reported. Indeed, animal studies have shown that prenatal nutrition can induce epigenetic changes in the offspring, resulting in altered expression of genes related to energy metabolism and long-term obesity, which may be differently expressed according to the sex of the offspring.43 A sexual dimorphism in Wistar rats was also observed for body weight and various metabolic parameters such as plasma lipids, leptin, and insulin levels.37,44 It has also been reported that serum adiponectin inversely associates with insulin resistance, and the possible increase in insulin sensitivity appears to be mediated by AdipoQR1 and AdipoQR2 expression in muscle and liver, respectively.45 In our study, we show statistically significance increases in body weight, calorie intake, and adipose tissue mass in male offspring gestationally exposed to SF when compared to control male mice, and that such changes are absent in exposed female offspring (Figures 1 and Table 1). The sexually dimorphic changes in body fat distribution introduced by gestational SF could underlie the increased risk of obesity, diabetes, and associated metabolic disorders.8 A potential area of further exploration for future studies should therefore focus on the distribution of body fat as the result of changes in androgens, estrogens, and their balance, on adipose tissues.8
In this study we did not examine multiple time points, and thus the temporal trajectory of all the changes in adipocytokines and VWAT inflammatory pattern described herein at 20 weeks of age. Therefore, we do not know whether such changes preceded, were concurrently present, or followed the differential body weight and adipose tissue changes in SFOM. Indeed, expansion of adipose tissues, particularly VWAT, can lead to chronic low-grade inflammation that contributes to the development of metabolic disorders, including dyslipidemia, insulin resistance, and type 2 diabetes.46 SFOM mice, but not SFOF mice, exhibited increases in plasma cholesterol and triglyceride levels, as well as increases in HOMA-IR and alterations in GTT and ITT responses indicative of systemic insulin resistance. The differential distribution of adipose tissues in SFOM could be the primary source of pro-inflammatory processes,47 such that the accelerated expansion of VWAT in SFOM could generate conditions leading to the release of a wide range of proinflammatory and anti-inflammatory mediators that have been linked to the development of insulin resistance and glucose intolerance. At the cellular level, macrophages, lymphocytes, and adipocytes are known to interact and regulate the inflammatory cascade and metabolism.48 It has been suggested that the differences concerning the sensitivity between males and females regarding the circulating leptin levels and fat accumulation in normal adult life condition may be because the brains of female rats are relatively more sensitive to the action of leptin, whereas males seem to be more sensitive to insulin.49 Here, we show that leptin levels in circulating plasma were significantly increased in SFOM compared to SCOM, whereas in females the increases were only borderline significant, and clearly the absolute levels were lower. In addition, AdipoQ plasma concentrations, the prototypic adipokines that afford protection against metabolic dysfunction, were significantly decreased in SFOM mice, whereas such changes were absent in SFOF mice.
Because an important link between inflammation and metabolic dysfunction, particularly insulin resistance and glucose intolerance, has repeatedly emerged,50 we sought to examine whether SFOM displaying insulin resistance while fed a normal low-fat diet exhibited evidence of macrophage infiltration in adi-pose tissue depots, and whether such changes, if present, would differ in their female littermates. In this context, the evidence of inflammatory processes is primarily derived from diet-induced obesity experiments. Indeed, animals fed a high-fat diet develop increases in adiposity that are associated with chronic low-grade systemic inflammation. The macrophage content of adi-pose tissues is correlated with adipocyte size and macrophages are the primary source of TNF-α and other pro-inflammatory molecules in adipose tissues.51 Macrophage activation has been defined into two separate polarization states, namely M1 and M2.52 The M1 macrophage produces TNF-α, IL-6, and MCP-1, whereas M2 macrophage produces anti-inflammatory cytokines such as IL-10. It has been suggested that the polarization of adi-pose tissue macrophages into a pro-inflammatory M1 phenotype will gradually replace M2-polarized macrophages, and provides a reporter balance status between adipose tissue inflammation and glucose intolerance,28 because adipose tissue can generate substantial amounts of pro-inflammatory molecules and thus contribute to insulin resistance. In human obese subjects, adi-pose tissue has been shown to contain increased numbers of M1 macrophages, including TNF-α and IL-6, whereas M2 macrophages are associated with increased production of arginase-1 and IL-10 and may provide protection from obesity and insulin resistance. Our findings showing increases in M1:M2 macrophage ratios in SFOM, but reductions in such ratios in SFOF, are therefore in close agreement with those studies. Of note, sexual dimorphism in the inflammatory status induced with high-fat diet and the differential response to the development of diet-induced insulin resistance has been recently reported.53
Epigenetic processes can control gene expression without modifying the genetic code. They do so by modifying DNA and histones, which alters the accessibility of chromatin, allowing gene transcription factors to interact with their binding sites within the regulatory region of genes. These epigenetic alterations can accumulate over time, and environmental factors can have profound effects on the repertoire of expressed genes. DNA methylation of cytosine at primarily CpG dinucleotides is the most common epigenetic modification. For example, promoters of transcriptionally active genes are typically hypomethylated, whereas DNA hypermethylation can result in gene silencing by affecting the binding of methylation-sensitive DNA binding proteins and/or by interacting with various histone modifications and co-repressors that alter DNA accessibility to transcriptional factors. Alterations of DNA methylation have also been implicated in chronic inflammation-related diseases.54 In previous studies in children with SDB, we uncovered evidence suggesting that epigenetic changes might occur in the context of this disease.55 Furthermore, histones in the promoter region of adiponectin have been suggested as playing important roles in adipogenesis,56 and methylation marks in AdipoQ gene have been linked to obesity states in humans.57 Furthermore, we have previously shown the presence of increased methylation in specific CpG sites of the AdipoQ in offspring born after late maternal high-fat diet.21 Our current findings further these previous findings, and indicate that SF during late gestation increases methylation of AdipoQ promoter region at specific sites in SFOM, but that such changes are not present in SFOF. Furthermore, because DNA methylation is a key epigenetic contributor to the maintenance of gene silencing, and is reprogrammed during development through DNMTs,58 we examined the expression of three CpG DNA methyltransferases (Dnmt), Dnmt1, Dnmt3a, and Dnmt3b) that coordinately regulate the methylation of DNA in the genome. Indeed, Dnmt1 promotes DNA methylation after DNA replication, and plays a major role in the maintenance of methylation. Dnmt3a and Dnmt3b are developmentally regulated enzymes required for the initiation of de novo methylation during embryogenesis.59 As would be predicted form the other findings, the expression of Dnmt1 was similar across all experimental groups, whereas DNMT3a and DNMT3b were significantly and exclusively upregulated in visceral adipose tissues in SFOM.
In the current study we restricted sleep fragmentation to the late gestational period because this is the period of human pregnancy most likely to present with a high frequency of sleep perturbations. However, it will be important to examine the effect of SF, if such is imposed during other delimited gestational periods or throughout the duration of gestation. As mentioned, we did not explore the temporal trajectory of the metabolic and epigenetic alterations in the current experiments, and examined only their presence during adulthood (i.e., 20 weeks). It is therefore unclear whether all of the metabolic and epigenetic changes reported herein coincide and become manifest around the same timeframe when body weight becomes increased in SF offspring, or whether each of the phenotypic, gene expression, or epigenetic characteristics has a different and unique temporal trajectory. Finally, it will be important to examine whether specific interventions such as prenatal and postnatal diets, food supplements (e.g., folic acid) or physical activity might either alleviate or exacerbate the SF-induced sex dimorphic phenotype in the offspring.
CONCLUSION
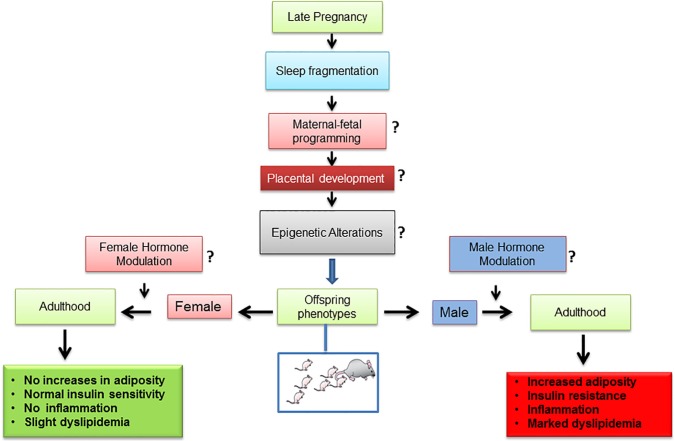
Sleep fragmentation exposures in utero during late gestation induce a sexually dimorphic phenotype characterized by increased body adiposity, altered lipid profile, increased insulin resistance, and adipose tissue inflammation (Figure 7). The observations presented in this study provide strong support for the developmental origins of adult disease, and further buttress the differences imposed by sex on the penetrance of the phenotype in the offspring. Understanding sex-specific adipose tissue adaptations underlying metabolic disorders linked to SF and unhealthy lifestyles will considerably contribute to the development of improved strategies for the prevention and treatment of metabolic and cardiovascular diseases.
Figure 7.
Schematic diagram showing potential steps involved in the effects of sleep fragmentation during late gestation and emergence of sexual dimorphic metabolic phenotypes in adulthood offspring mice. The questions marks shown in the diagram indicate areas requiring further investigation.
DISCLOSURE STATEMENT
This was not an industry supported study. This study was supported in part by the Herbert T. Abelson Endowed Chair in Pediatrics and a Comer Children's Hospital Research grant to Dr. Khalyfa. Dr. Gozal is the recipient of National Institutes of Health grants HL-065270 and HL-086662. The authors have indicated no financial conflicts of interest.
REFERENCES
- 1.Strakovsky RS, Pan YX. In utero oxidative stress epigenetically programs antioxidant defense capacity and adulthood diseases. Antioxid Redox Signal. 2012;17:237–53. doi: 10.1089/ars.2011.4372. [DOI] [PMC free article] [PubMed] [Google Scholar]
- 2.Gluckman PD, Hanson MA, Cooper C, Thornburg KL. Effect of in utero and early-life conditions on adult health and disease. N Engl J Med. 2008;359:61–73. doi: 10.1056/NEJMra0708473. [DOI] [PMC free article] [PubMed] [Google Scholar]
- 3.Matthews SG, Phillips DI. Minireview: transgenerational inheritance of the stress response: a new frontier in stress research. Endocrinology. 2010;151:7–13. doi: 10.1210/en.2009-0916. [DOI] [PubMed] [Google Scholar]
- 4.Kautzky-Willer A, Handisurya A. Metabolic diseases and associated complications: sex and gender matter! Eur J Clin Invest. 2009;39:631–48. doi: 10.1111/j.1365-2362.2009.02161.x. [DOI] [PubMed] [Google Scholar]
- 5.Ali SS, Oni ET, Warraich HJ, et al. Systematic review on noninvasive assessment of subclinical cardiovascular disease in obstructive sleep apnea: new kid on the block! Sleep Med Rev. 2014;18:379–91. doi: 10.1016/j.smrv.2014.01.004. [DOI] [PubMed] [Google Scholar]
- 6.Pien GW, Schwab RJ. Sleep disorders during pregnancy. Sleep. 2004;27:1405–17. doi: 10.1093/sleep/27.7.1405. [DOI] [PubMed] [Google Scholar]
- 7.Khalyfa A, Carreras A, Hakim F, Gozal D. Sleep disruption during late gestation of pregnancy induces metabolic dysfunction in offspring. Am J Respir Crit Care Med. 2013;187:A2382. [Google Scholar]
- 8.Wells JC. Sexual dimorphism of body composition. Best practice & research. Clin Endocrinol Metab. 2007;21:415–30. doi: 10.1016/j.beem.2007.04.007. [DOI] [PubMed] [Google Scholar]
- 9.Power ML, Schulkin J. Sex differences in fat storage, fat metabolism, and the health risks from obesity: possible evolutionary origins. Br J Nutr. 2008;99:931–40. doi: 10.1017/S0007114507853347. [DOI] [PubMed] [Google Scholar]
- 10.Macotela Y, Boucher J, Tran TT, Kahn CR. Sex and depot differences in adipocyte insulin sensitivity and glucose metabolism. Diabetes. 2009;58:803–12. doi: 10.2337/db08-1054. [DOI] [PMC free article] [PubMed] [Google Scholar]
- 11.Grigore D, Ojeda NB, Alexander BT. Sex differences in the fetal programming of hypertension. Gender Med. 2008;5:S121–32. doi: 10.1016/j.genm.2008.03.012. [DOI] [PMC free article] [PubMed] [Google Scholar]
- 12.Woods LL, Weeks DA, Rasch R. Programming of adult blood pressure by maternal protein restriction: role of nephrogenesis. Kidney Int. 2004;65:1339–48. doi: 10.1111/j.1523-1755.2004.00511.x. [DOI] [PubMed] [Google Scholar]
- 13.Mingrone G, Manco M, Mora ME, et al. Influence of maternal obesity on insulin sensitivity and secretion in offspring. Diabetes Care. 2008;31:1872–6. doi: 10.2337/dc08-0432. [DOI] [PMC free article] [PubMed] [Google Scholar]
- 14.Langley-Evans SC, Jackson AA. Captopril normalises systolic blood pressure in rats with hypertension induced by fetal exposure to maternal low protein diets. Comparative biochemistry and physiology. Part A. Physiology. 1995;110:223–8. doi: 10.1016/0300-9629(94)00177-u. [DOI] [PubMed] [Google Scholar]
- 15.Kwong WY, Wild AE, Roberts P, Willis AC, Fleming TP. Maternal undernutrition during the preimplantation period of rat development causes blastocyst abnormalities and programming of postnatal hypertension. Development. 2000;127:4195–202. doi: 10.1242/dev.127.19.4195. [DOI] [PubMed] [Google Scholar]
- 16.Sanchez-Garrido MA, Castellano JM, Ruiz-Pino F, et al. Metabolic programming of puberty: sexually dimorphic responses to early nutritional challenges. Endocrinology. 2013;154:3387–400. doi: 10.1210/en.2012-2157. [DOI] [PubMed] [Google Scholar]
- 17.Guo C, Li C, Myatt L, Nathanielsz PW, Sun K. Sexually dimorphic effects of maternal nutrient reduction on expression of genes regulating cortisol metabolism in fetal baboon adipose and liver tissues. Diabetes. 2013;62:1175–85. doi: 10.2337/db12-0561. [DOI] [PMC free article] [PubMed] [Google Scholar]
- 18.Gabory A, Attig L, Junien C. Sexual dimorphism in environmental epigenetic programming. Mol Cell Endocrinol. 2009;304:8–18. doi: 10.1016/j.mce.2009.02.015. [DOI] [PubMed] [Google Scholar]
- 19.Armitage JA, Taylor PD, Poston L. Experimental models of developmental programming: consequences of exposure to an energy rich diet during development. J Physiol. 2005;565:3–8. doi: 10.1113/jphysiol.2004.079756. [DOI] [PMC free article] [PubMed] [Google Scholar]
- 20.Masuyama H, Hiramatsu Y. Effects of a high-fat diet exposure in utero on the metabolic syndrome-like phenomenon in mouse offspring through epigenetic changes in adipocytokine gene expression. Endocrinology. 2012;153:2823–30. doi: 10.1210/en.2011-2161. [DOI] [PubMed] [Google Scholar]
- 21.Khalyfa A, Carreras A, Hakim F, Cunningham JM, Wang Y, Gozal D. Effects of late gestational high-fat diet on body weight, metabolic regulation and adipokine expression in offspring. Int J Obes (Lond) 2013;37:1481–9. doi: 10.1038/ijo.2013.12. [DOI] [PMC free article] [PubMed] [Google Scholar]
- 22.Nair D, Zhang SX, Ramesh V, et al. Sleep fragmentation induces cognitive deficits via nicotinamide adenine dinucleotide phosphate oxidase-dependent pathways in mouse. Am J Respir Crit Care Med. 2011;184:1305–12. doi: 10.1164/rccm.201107-1173OC. [DOI] [PMC free article] [PubMed] [Google Scholar]
- 23.Ramesh V, Nair D, Zhang SX, et al. Disrupted sleep without sleep curtailment induces sleepiness and cognitive dysfunction via the tumor necrosis factor-alpha pathway. J Neuroinflammation. 2012;9:91. doi: 10.1186/1742-2094-9-91. [DOI] [PMC free article] [PubMed] [Google Scholar]
- 24.Vijay R, Kaushal N, Gozal D. Sleep fragmentation differentially modifies EEG delta power during slow wave sleep in socially isolated and paired mice. Sleep Science. 2009;2:64–75. [Google Scholar]
- 25.Wang Y, Carreras A, Lee S, et al. Chronic sleep fragmentation promotes obesity in young adult mice. Obesity. 2014;22:758–62. doi: 10.1002/oby.20616. [DOI] [PMC free article] [PubMed] [Google Scholar]
- 26.Zhang SX, Khalyfa A, Wang Y, et al. Sleep fragmentation promotes NADPH oxidase 2-mediated adipose tissue inflammation leading to insulin resistance in mice. Int J Obes (Lond) 2014;38:619–24. doi: 10.1038/ijo.2013.139. [DOI] [PMC free article] [PubMed] [Google Scholar]
- 27.Carreras A, Kayali F, Zhang J, Hirotsu C, Wang Y, Gozal D. Metabolic effects of intermittent hypoxia in mice: steady versus high-frequency applied hypoxia daily during the rest period. Am J Physiol Regul Integr Comp Physiol. 2012;303:R700–9. doi: 10.1152/ajpregu.00258.2012. [DOI] [PMC free article] [PubMed] [Google Scholar]
- 28.Lumeng CN, Bodzin JL, Saltiel AR. Obesity induces a phenotypic switch in adipose tissue macrophage polarization. J Clin Invest. 2007;117:175–84. doi: 10.1172/JCI29881. [DOI] [PMC free article] [PubMed] [Google Scholar]
- 29.Grunau C, Clark SJ, Rosenthal A. Bisulfite genomic sequencing: systematic investigation of critical experimental parameters. Nucleic Acids Res. 2001;29:E65–5. doi: 10.1093/nar/29.13.e65. [DOI] [PMC free article] [PubMed] [Google Scholar]
- 30.Friedman JM. Obesity: causes and control of excess body fat. Nature. 2009;459:340–2. doi: 10.1038/459340a. [DOI] [PubMed] [Google Scholar]
- 31.Barker DJ. The developmental origins of insulin resistance. Horm Res. 2005;64:2–7. doi: 10.1159/000089311. [DOI] [PubMed] [Google Scholar]
- 32.Entringer S, Buss C, Swanson JM, et al. Fetal programming of body composition, obesity, and metabolic function: the role of intrauterine stress and stress biology. J Nutr Metab. 2012;2012:632548. doi: 10.1155/2012/632548. [DOI] [PMC free article] [PubMed] [Google Scholar]
- 33.Tamashiro KL, Moran TH. Perinatal environment and its influences on metabolic programming of offspring. Physiol Behav. 2010;100:560–6. doi: 10.1016/j.physbeh.2010.04.008. [DOI] [PMC free article] [PubMed] [Google Scholar]
- 34.Bayol SA, Simbi BH, Stickland NC. A maternal cafeteria diet during gestation and lactation promotes adiposity and impairs skeletal muscle development and metabolism in rat offspring at weaning. J Physiol. 2005;567:951–61. doi: 10.1113/jphysiol.2005.088989. [DOI] [PMC free article] [PubMed] [Google Scholar]
- 35.Khan I, Dekou V, Hanson M, Poston L, Taylor P. Predictive adaptive responses to maternal high-fat diet prevent endothelial dysfunction but not hypertension in adult rat offspring. Circulation. 2004;110:1097–102. doi: 10.1161/01.CIR.0000139843.05436.A0. [DOI] [PubMed] [Google Scholar]
- 36.Khan IY, Taylor PD, Dekou V, et al. Gender-linked hypertension in offspring of lard-fed pregnant rats. Hypertension. 2003;41:168–75. doi: 10.1161/01.hyp.0000047511.97879.fc. [DOI] [PubMed] [Google Scholar]
- 37.Zambrano E, Bautista CJ, Deas M, et al. A low maternal protein diet during pregnancy and lactation has sex- and window of exposure-specific effects on offspring growth and food intake, glucose metabolism and serum leptin in the rat. J Physiol. 2006;571:221–30. doi: 10.1113/jphysiol.2005.100313. [DOI] [PMC free article] [PubMed] [Google Scholar]
- 38.Elahi MM, Cagampang FR, Mukhtar D, Anthony FW, Ohri SK, Hanson MA. Long-term maternal high-fat feeding from weaning through pregnancy and lactation predisposes offspring to hypertension, raised plasma lipids and fatty liver in mice. Br J Nutr. 2009;102:514–9. doi: 10.1017/S000711450820749X. [DOI] [PubMed] [Google Scholar]
- 39.Hanson M, Godfrey KM, Lillycrop KA, Burdge GC, Gluckman PD. Developmental plasticity and developmental origins of noncommunicable disease: theoretical considerations and epigenetic mechanisms. Prog Biophys Mol Biol. 2011;106:272–80. doi: 10.1016/j.pbiomolbio.2010.12.008. [DOI] [PubMed] [Google Scholar]
- 40.Torrens C, Ethirajan P, Bruce KD, et al. Interaction between maternal and offspring diet to impair vascular function and oxidative balance in high fat fed male mice. PloS One. 2012;7:e50671. doi: 10.1371/journal.pone.0050671. [DOI] [PMC free article] [PubMed] [Google Scholar]
- 41.Goodpaster BH, Krishnaswami S, Harris TB, et al. Obesity, regional body fat distribution, and the metabolic syndrome in older men and women. Arch Intern Med. 2005;165:777–83. doi: 10.1001/archinte.165.7.777. [DOI] [PubMed] [Google Scholar]
- 42.El Akoum S, Lamontagne V, Cloutier I, Tanguay JF. Nature of fatty acids in high fat diets differentially delineates obesity-linked metabolic syndrome components in male and female C57BL/6J mice. Diabetol Metab Syndr. 2011;3:34. doi: 10.1186/1758-5996-3-34. [DOI] [PMC free article] [PubMed] [Google Scholar]
- 43.Seki Y, Williams L, Vuguin PM, Charron MJ. Minireview: epigenetic programming of diabetes and obesity: animal models. Endocrinology. 2012;153:1031–8. doi: 10.1210/en.2011-1805. [DOI] [PMC free article] [PubMed] [Google Scholar]
- 44.Hanson MA, Gluckman PD. Developmental processes and the induction of cardiovascular function: conceptual aspects. J Physiol. 2005;565:27–34. doi: 10.1113/jphysiol.2004.082339. [DOI] [PMC free article] [PubMed] [Google Scholar]
- 45.Yamauchi T, Kamon J, Ito Y, et al. Cloning of adiponectin receptors that mediate antidiabetic metabolic effects. Nature. 2003;423:762–9. doi: 10.1038/nature01705. [DOI] [PubMed] [Google Scholar]
- 46.Ng SF, Lin RC, Laybutt DR, Barres R, Owens JA, Morris MJ. Chronic high-fat diet in fathers programs beta-cell dysfunction in female rat offspring. Nature. 2010;467:963–6. doi: 10.1038/nature09491. [DOI] [PubMed] [Google Scholar]
- 47.Nishimura S, Manabe I, Nagasaki M, et al. CD8+ effector T cells contribute to macrophage recruitment and adipose tissue inflammation in obesity. Nat Med. 2009;15:914–20. doi: 10.1038/nm.1964. [DOI] [PubMed] [Google Scholar]
- 48.Shaul ME, Bennett G, Strissel KJ, Greenberg AS, Obin MS. Dynamic, M2-like remodeling phenotypes of CD11c+ adipose tissue macrophages during high-fat diet--induced obesity in mice. Diabetes. 2010;59:1171–81. doi: 10.2337/db09-1402. [DOI] [PMC free article] [PubMed] [Google Scholar]
- 49.Clegg DJ, Riedy CA, Smith KA, Benoit SC, Woods SC. Differential sensitivity to central leptin and insulin in male and female rats. Diabetes. 2003;52:682–7. doi: 10.2337/diabetes.52.3.682. [DOI] [PubMed] [Google Scholar]
- 50.Yang H, Youm YH, Vandanmagsar B, et al. Obesity increases the production of proinflammatory mediators from adipose tissue T cells and compromises TCR repertoire diversity: implications for systemic inflammation and insulin resistance. J Immunol. 2010;185:1836–45. doi: 10.4049/jimmunol.1000021. [DOI] [PMC free article] [PubMed] [Google Scholar]
- 51.Weisberg SP, McCann D, Desai M, Rosenbaum M, Leibel RL, Ferrante AW., Jr Obesity is associated with macrophage accumulation in adipose tissue. J Clin Invest. 2003;112:1796–808. doi: 10.1172/JCI19246. [DOI] [PMC free article] [PubMed] [Google Scholar]
- 52.Mantovani A, Sica A, Sozzani S, Allavena P, Vecchi A, Locati M. The chemokine system in diverse forms of macrophage activation and polarization. Trends Immunol. 2004;25:677–86. doi: 10.1016/j.it.2004.09.015. [DOI] [PubMed] [Google Scholar]
- 53.Medrikova D, Jilkova ZM, Bardova K, Janovska P, Rossmeisl M, Kopecky J. Sex differences during the course of diet-induced obesity in mice: adipose tissue expandability and glycemic control. Int J Obes (Lond) 2012;36:262–72. doi: 10.1038/ijo.2011.87. [DOI] [PubMed] [Google Scholar]
- 54.Stenvinkel P, Karimi M, Johansson S, et al. Impact of inflammation on epigenetic DNA methylation - a novel risk factor for cardiovascular disease? J Intern Med. 2007;261:488–99. doi: 10.1111/j.1365-2796.2007.01777.x. [DOI] [PubMed] [Google Scholar]
- 55.Kheirandish-Gozal L, Khalyfa A, Gozal D, Bhattacharjee R, Wang Y. Endothelial dysfunction in children with obstructive sleep apnea is associated with epigenetic changes in the eNOS gene. Chest. 2013;143:971–7. doi: 10.1378/chest.12-2026. [DOI] [PMC free article] [PubMed] [Google Scholar]
- 56.Musri MM, Corominola H, Casamitjana R, Gomis R, Parrizas M. Histone H3 lysine 4 dimethylation signals the transcriptional competence of the adiponectin promoter in preadipocytes. J Biol Chem. 2006;281:17180–8. doi: 10.1074/jbc.M601295200. [DOI] [PubMed] [Google Scholar]
- 57.Houde AA, Hivert MF, Bouchard L. Fetal epigenetic programming of adipokines. Adipocyte. 2013;2:41–6. doi: 10.4161/adip.22055. [DOI] [PMC free article] [PubMed] [Google Scholar]
- 58.Mutskov V, Felsenfeld G. Silencing of transgene transcription precedes methylation of promoter DNA and histone H3 lysine 9. EMBO J. 2004;23:138–49. doi: 10.1038/sj.emboj.7600013. [DOI] [PMC free article] [PubMed] [Google Scholar]
- 59.Okano M, Bell DW, Haber DA, Li E. DNA methyltransferases Dnmt3a and Dnmt3b are essential for de novo methylation and mammalian development. Cell. 1999;99:247–57. doi: 10.1016/s0092-8674(00)81656-6. [DOI] [PubMed] [Google Scholar]


