Abstract
Study Objectives:
Our investigation aims to assess the impact of symptoms of maternal sleep-disordered breathing, specifically sleep apnea risk and daytime sleepiness, on fetal leukocyte telomere length.
Participants and Setting:
Pregnant women were recruited upon hospital delivery admission.
Interventions:
Sleep exposure outcomes were measured using the Berlin Questionnaire to quantify sleep apnea and the Epworth Sleepiness Scale to measure daytime sleepiness. Participants were classified as “High Risk” or “Low Risk” for sleep apnea based on responses to the Berlin, while “Normal” or “Abnormal” daytime sleepiness was determined based on responses to the Epworth.
Design:
Neonatal umbilical cord blood samples (N = 67) were collected and genomic DNA was isolated from cord blood leukocytes using Quantitative PCR. A ratio of relative telomere length was derived by telomere repeat copy number and single copy gene copy number (T/S ratio) and used to compare telomere lengths. Bootstrap and ANOVA statistical procedures were employed.
Measurements and Results:
On the Berlin, 68.7% of participants were classified as Low Risk while 31.3% were classified as High Risk for sleep apnea. According to the Epworth scale, 80.6% were determined to have Normal daytime sleepiness, and 19.4% were found to have Abnormal daytime sleepiness. The T/S ratio among pregnant women at High Risk for sleep apnea was significantly shorter than for those at Low Risk (P value < 0.05), and the T/S ratio among habitual snorers was significantly shorter than among non-habitual snorers (P value < 0.05). Although those with Normal Sleepiness had a longer T/S ratio than those with Abnormal Sleepiness, the difference was not statistically significant.
Conclusion:
Our results provide the first evidence demonstrating shortened telomere length among fetuses exposed to maternal symptoms of sleep disordered breathing during pregnancy, and suggest sleep disordered breathing as a possible mechanism of accelerated chromosomal aging.
Citation:
Salihu HM, King L, Patel P, Paothong A, Pradhan A, Louis J, Naik E, Marty PJ, Whiteman V. Association between maternal symptoms of sleep disordered breathing and fetal telomere length. SLEEP 2015;38(4):559–566.
Keywords: bootstrapping statistical methodology, fetal telomere length, neonatal umbilical cord blood, sleep apnea, maternal daytime sleepiness
INTRODUCTION
Sleep quality has long been associated with psychological and physiological health. With a rising proportion of Americans reporting reduced sleep quality, results of several studies linking sleep quality to health are now available. Many women, especially during pregnancy, report poor sleep quality, showing maternal sleep patterns that adversely affect fetal development, resulting in poor birth outcomes including low birth weight, small for gestational age, preeclampsia, and pre-term delivery.1–4 Sleep-disordered breathing (SDB), such as obstructive sleep apnea, has been shown to be associated with preeclampsia,5 neonatal intensive care admissions, cesarean deliveries, low birthweight, preterm birth, small for gestational age, and low Apgar score.6 Some of these same adverse pregnancy outcomes have also been reported among women with symptoms of SDB and habitual snoring.7
Telomeres are regions of repetitive nucleotide sequences that cap the ends of chromosomes. Known to protect chromosome ends from degradation during DNA replication, the telomeres themselves progressively shorten with each cell cycle due to the inability of DNA polymerase to replicate all the way to the 5′ end of the lagging strand.8 While telomere length is maintained in specific germ cells, stem cells, and proliferating cancer cells by the ribonucleoprotein complex telomerase that replenishes the repeating nucleotide sequences at the ends of chromosomes, somatic cells have very low telomerase levels. As a result, telomeres gradually shorten with age in most somatic tissues, and can hence serve as a biological marker of aging.8 Once the telomeres are deteriorated to the point of a critical length, somatic cells reach their replicative limit and advance to programmed cellular senescence or apoptosis.8
Whether in the form of sleep quantity or quality, including sleep apnea, sleep dysfunction has been linked to shorter telo-mere lengths in both adult males and females. A study of adult patients with obstructive sleep apnea syndrome showed that telomere length was significantly shorter in patients with the syndrome than in those without.9
While several studies link sleep dysfunction to telomere length in adults, research on the effects of maternal sleep patterns on fetal telomere length is sparse, limiting our understanding of how early the telomere biological system is affected by maternal sleep disorders. Our investigation aims to assess the impact of maternal symptoms of SDB, specifically, sleep apnea risk, habitual snoring, and excessive daytime sleepiness during pregnancy on fetal leukocyte telomere length. Given that telomere length is heritable and that SDB is associated with a shorter mean telomere length in adults, we hypothesize that perturbed maternal sleep during pregnancy will be associated with a shorter fetal telomere length, a marker for potential early intrauterine programming for accelerated ageing and adverse health outcomes as the child grows and develops.
METHODS
Study Population
Study participants were recruited among women delivering at Tampa General Hospital (TGH) in Florida. Recruitment began in July 2011 and ended in September 2012. Faculty of the Department of Obstetrics and Gynecology at the University of South Florida (USF) Health Morsani College of Medicine provide obstetrical care services at TGH. TGH is a large safety-net hospital serving a multicounty metropolitan population of over 2 million people in West-Central Florida. A hospital statistical report (unpublished data) from 2012 showed that women who deliver at the university-affiliated hospital are typically socioeconomically disadvantaged and ethnically diverse. Very few patients have private health insurance and most are either un-insured or covered by Medicaid.
Eligibility criteria included women age 18–44 years delivering singleton full-term live births with fetuses showing no indication of congenital and or chromosomal anomalies. Informed consent was sought preceding delivery by trained research staff. Prior to approaching a potential participant, research staff made sure that the patient was not under duress and was competent to provide full written informed consent. The research staff took care to explain fully the following issues: the voluntary nature of the research, its distinction from clinical care, the right to withdraw without penalty, and the steps to be taken to protect confidentiality of information. Informed consent was available in both English and Spanish. This study was approved by the USF Institutional Review Board and ethics committee.
Information pertaining to sociodemographic characteristics and newborn measures was abstracted from hospital electronic medical records. Data from this study is part of a larger study assessing prenatal smoking and fetal outcomes. A questionnaire packet was administered either verbally by research staff or self-administered by participants before or after delivery but prior to hospital discharge. Psychosocial questionnaires for the larger study included tobacco exposure, signs/symptoms of stress and depression, dietary history, daytime sleepiness, and sleep apnea; however, only the sleep scales will be assessed in this analysis.
Sleep Exposure Measures
Sleep exposure outcomes for this study were measured using two sleep questionnaires, the Berlin Questionnaire (BQ) for sleep apnea10 and the Epworth Sleepiness Scale (ESS) to measure daytime sleepiness.3,11 The 2 questionnaires have been previously validated for use in pregnancy.12
The BQ for sleep apnea is a 10-item scale consisting of 3 symptom categories related to risk factors for sleep apnea, including snoring behavior, sleepiness or fatigue during wake time hours (including sleepiness while driving), and the presence of obesity, hypertension, and SDB.10 Other information collected included age, sex, weight, and height. Participants reported weight in pounds. Weight was converted from pounds to kilograms. Body mass index (BMI) was calculated from weight and height.
BMI ≥ 30 was defined as obesity. Participants were classified into “High Risk” or “Low Risk” for sleep apnea based on their responses to the items on the BQ and their overall scores in the categories. Participants were classified as High Risk for sleep apnea if ≥ 2 categories were positive. Participants were classified as Low Risk for sleep apnea if 1 or 0 categories had a positive score.10 Habitual snoring was defined as a self-reported frequency of snoring ≥ 3–4 times per week. We classified the remaining participants as “non-habitual snorers.”
The Epworth Sleepiness Scale (ESS) is an 8-item scale used to measure the participant's daytime sleepiness.11 Participants are given 8 situations and asked to rate on a scale of 0 to 3 the chances they would doze off or fall asleep. The scores for each question are added together to give a total score between 0 and 24. The ESS attempts to overcome the fact that participants have different daily routines, some that facilitate and others that inhibit daily sleep. Some examples of questions asked include rating the chance of dozing off “while watching TV” and “in a car, while stopped for a few minutes in traffic.”11 Normal range is considered 0–10, borderline is 10–12, and abnormal sleepiness is 12–24.11 For this study, the 3 categories were collapsed into 2 categories: 0–10 was considered Normal Sleepiness and 11–24 was considered Abnormal Sleepiness.
The following is a summary of our definitions of sleep status for this study, creating 2 groups for each sleep scale:
Berlin = Low Risk, if Berlin score = 0 or 1.
Berlin = High Risk, if Berlin score = 2 or 3.
Epworth = Normal, if Epworth score ≤ 10.
Epworth = Abnormal, if Epworth score > 10.
Cord Blood Collection
Neonatal umbilical cord blood was collected from infants at birth using a collection device called the UmbiliCup. The UmbiliCup was engineered without the utilization of an exposed sharp needle, thereby reducing the chance of needle sticks and exposure to blood-borne pathogens. The device is sterile and a safe and cost-effective method of collecting a large volume of cord blood for this study. The device is suitable for vaginal deliveries and cesarean sections and can be used by physicians and nurses. It eliminates blood splatter and is safely disposable. The umbilical cord segment is placed in the device's blood sampling container. Blood pools into the container and a blood collection tube is inserted to draw the sample. Once the blood is collected into the tube, the bottom of the UmbiliCup is capped (DeRoyal Industries, TN, USA). Cord blood was collected by the physician or nurse who was present at delivery. All physicians and nurses who collected the blood underwent training in using the UmbiliCup through an annual grand rounds and quarterly inservice on the uniform collection process. They have also watched a video available through the manufacturer.
Umbilical cord blood was stored in a refrigerator in the delivery unit immediately following collection. Research coordinators picked up the blood from the refrigerator, packaged it, and transported it to the laboratory for analysis. All research coordinators were certified in the Transportation of Infectious Substances, Biological Materials, and Dry Ice through the Division of Research Integrity and Compliance. Samples were processed at the University of South Florida Global Health Infectious Disease Research laboratory within 24 h of collection. The processing was supervised by a professor of Parasitology and Global Infectious Disease. Laboratory personnel were blinded to birth outcome, demographic information, and health indicators.
DNA Extraction and Telomere Length Measures
We extracted approximately 200 μL Buffy-coat layer from the umbilical cord blood and processed it for genomic DNA as per manufacturer's instructions (Qiagen, DNeasy Blood and Tissue Kit) with slight adjustments. We used 20 ng DNA as a template for all reactions. The relative telomere lengths in the DNA samples (T/S ratio) were determined from the quantitative PCR (qPCR) cycle threshold (ΔCt) values obtained using GoTaq qPCR Master Mix reagent (Promega, Madison, WI, USA), based on the assay described by Cawton et al.13 The telo-mere primer concentrations used in qPCR were: tel1 270 nM; tel2, 900 nM. The final 36B4 (single copy gene) primer concentrations were: 36B4u, 300 nM; 36B4d, 500 nM. The primer sequences (from 5'→3') were: tel1, GGTTTTTGAGGGTGAGGGTGAGGGTGAGGGTGAGGGT; tel2, TCCCGACTATCCCTATCCCTATCCCTATCCCTATCCCTA; 36B4u, CAGCAAGTGGGAAGGTGTAATCC; 36B4d, CCCATTCTATCATCAACGGGTACAA. The thermal cycling profile for the single copy gene and the telomere started with 2 min at 95°C for hot start activation followed by 40 cycles of 15-s denaturation at 95°C and annealing/extension at 54°C for 2 min.
We obtained the relative quantities of telomere repeats (T) and the single copy gene (S) by plotting the respective qPCR generated ΔCt values in the standard curve obtained from an arbitrary human DNA ΔCt. The relative ratio is usually tightly proportional to average telomere length and is therefore the ratio of the telomere to single copy gene (T/S) for each experimental sample. Subsequently, T/S = 1 when the anonymous DNA is identical to the reference gene in ratio of its relative copy number to a single gene copy number. To determine the absolute copies of repeats, telomere (T) was divided by absolute copy of the single copy gene 36B4 (S), or T/S ratio.
Telomere length variations can be described with 3 different variant analyses: T/S ratio (using the obtained ΔCt values), relative T/S ratio or RTS (a log derivation of the ΔCt values using the standard curve intercept), and the Cawthon ratio ([1910.5 × log T/S ratio] + 4157). The standard curves of the telomere length and the single copy gene 36B4 were generated by plotting the ΔCt values from qPCR reactions of a reference human DNA serially diluted 6 points from 1.9 to 60 ng. Thereafter, in all DNA samples the ΔCt values for telomere repeat gene and the single copy gene was determined. To determine the 3 different variables to compare telomere lengths in DNA samples, the above-mentioned relative algorithms were used. These 3 variables showed very high correlations. RTS and T/S ratio have a perfect positive correlation (r = +1.0) based on the formula used to convert T/S ratio to RTS:
Cawthon ratio and T/S are also highly correlated, with correlation equal to 0.8834, based on a simple regression between Cawthon and T/S:
with R2 = 0.8834.
Because these 3 variables are very highly correlated, we opted to use T/S ratio in this study, as T/S ratio is the most commonly reported measure of telomere length in recent literature.14,15
Statistical Analysis
To compare maternal sociodemographic and delivery characteristics between those at Low Risk for sleep apnea vs High Risk for sleep apnea and those with Normal Sleepiness vs. those with Abnormal Sleepiness, we employed analysis of variance (ANOVA) for differences in continuous outcomes. For the categorical variables, we applied χ2 test to assess differences in proportions. Where expected cell size was < 5, we used Fisher exact test instead.
Negative T/S ratio values and values > 3 are meaningless outliers and were excluded. Therefore, in our analysis, we restricted T/S ratio to values between 0 and 3. We decided to apply a resampling statistical technique called bootstrapping in combination with repeated ANOVA for each sampled unit.
Bootstrapping is a robust alternative to conventional statistical methods, as it requires fewer assumptions and provides more precise inferences mainly when the sample size is small.16 The technique involves repetitively sampling from an observed data set with replacement a fixed number of times.17 Then, we derive the sampling distribution of the desired statistic (e.g., mean telomere length) from each sampled unit. The distribution of the collection of these individual statistics provides a framework to estimate the overall mean value.18
In our study, we conducted a simulation analysis in order to derive precise estimates from our collected data using following steps:
We resampled with replacement from the original dataset.
Using simulation technique, we calculated the mean of T/S ratio for each category for the BQ: Low Risk and High Risk for sleep apnea. We did the same for each category for the ESS scale: Normal and Abnormal Sleepiness.
We then performed repeated ANOVA and derived the P value.
Finally, we repeated steps 1–3 five thousand (5,000) times.
The simulation procedure for each scale is illustrated as a flow chart in Figure 1.
Figure 1.
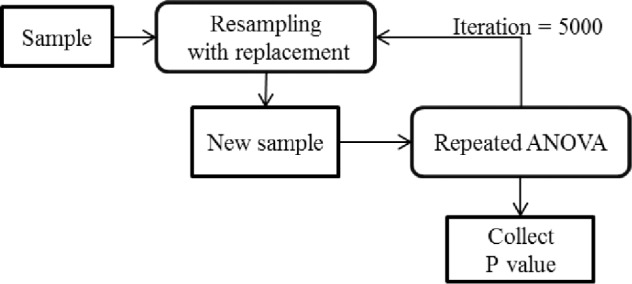
Simulation procedure for bootstrap analysis.
The ANOVA model that we used is represented as follows:
where:
μ = grand mean, a fixed parameter;
αh = effect of group and is a fixed parameter, ∑h=12 αh = 0;
τj = effect of sample, a fixed parameter, ∑ τj = 0;
(ατ)hj = interaction effect of sample and group, a fixed parameter, and ∑h=12 ∑(ατ)hj = 0;
bi(h) = individual difference component, bi(h) ∼ NID(0, σb2);
ehij = random error, ehij ∼ NID(0, σe2).
It is to be noted that this model tests the following hypotheses:
where: αLow is for Low Risk for sleep apnea, αHigh is for High Risk for sleep apnea; and
where: αNormal is for Normal Sleepiness, αAbnormal is for Abnormal Sleepiness.
We employed generalized linear regression modeling (GLM) to assess the relationship between SDB and telomere length accounting for the confounding effects of the following covariates: maternal age, gestational age, number of previous pregnancies, maternal BMI, birthweight, head circumference at birth, marital status, race/ethnicity, type of insurance, and smoking status. Statistical analyses were performed using R version 3.0.2 (www.R-project.org). All tests of hypothesis were two-tailed with a type 1 error rate set at 5%.
RESULTS
Table 1 shows detailed sociodemographic and delivery variables of the study sample for the following characteristics: maternal age, gestational age, number of previous pregnancies, maternal BMI, birthweight, head circumference at birth, marital status, race/ethnicity, and type of insurance. The population in this study was largely disadvantaged, with 70.1% of the participants covered by Medicaid and 14.9% reporting no insurance coverage. Approximately, 74.6% were single and 55.2% were black or Hispanic. There was no difference in mean gestational age between the 2 groups (mean ± SD = 40 ± 1.46 for Low Risk for sleep apnea and 40 ± 1.21 for those at High Risk for sleep apnea [P = 0.635); and 39 ± 1.36 for those with Normal Sleepiness and 39 ± 1.54 for those with Abnormal Sleepiness [P = 0.498]) at the time of delivery.
Table 1.
Maternal sociodemographic and delivery measures between the two groups for the Berlin and Epworth scales.
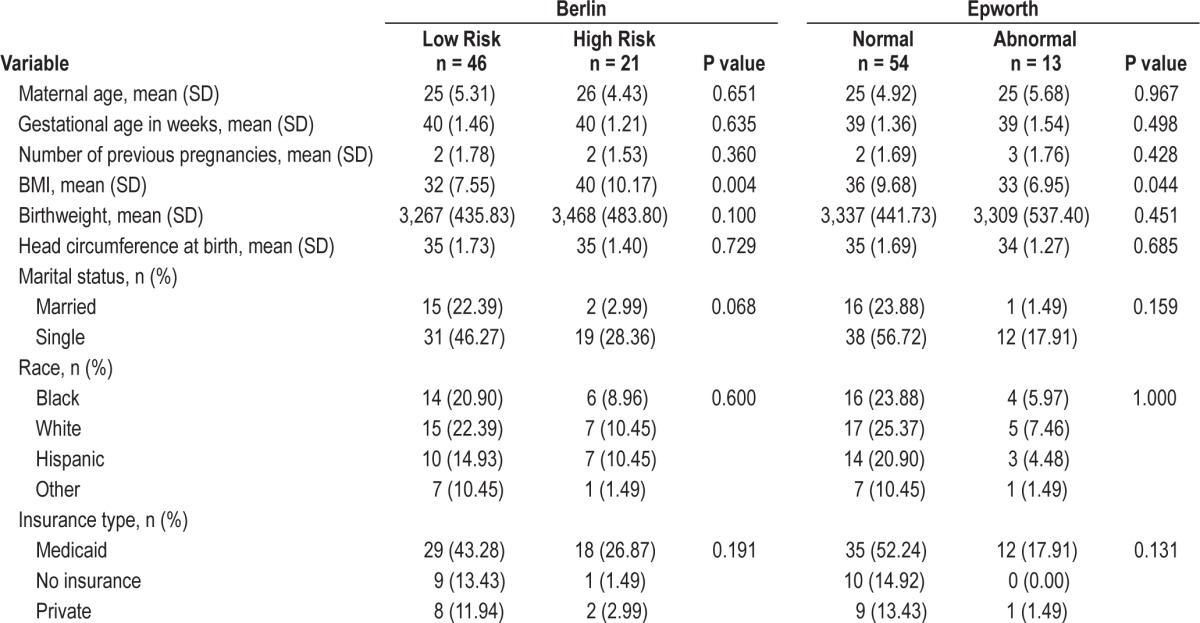
We also did not observe a difference between the 2 groups with respect to birthweight of infants (mean ± SD = 3,267 ± 435.83 g for Low Risk for sleep apnea and 3,468 ± 483.80 g for High Risk for sleep apnea [P = 0.100]; 3,337 ± 441.73 g for Normal Sleepiness and 3,309 ± 537.40 g for Abnormal Sleepiness [P = 0. 451]). Similarly, there was no difference between the 2 groups in relation to head circumference of infants (mean ± SD = 35 ± 1.73 cm for Low Risk for sleep apnea and 35 ± 1.40 cm for High Risk for sleep apnea [P = 0.729]; 35 ± 1.69 cm for Normal Sleepiness and 34 ± 1.27 cm for Abnormal Sleepiness [P = 0.685]).
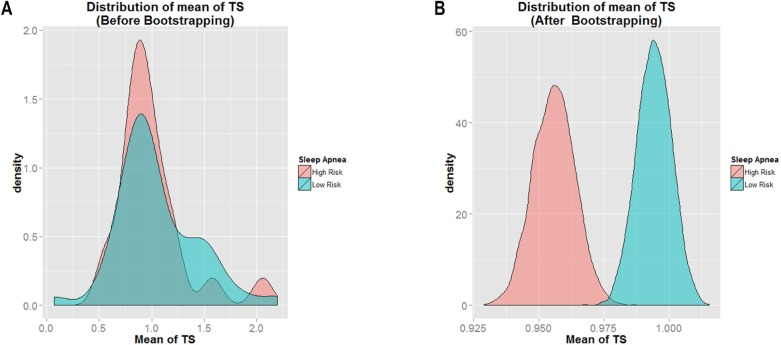
Of the 67 women included in this study, 46 (68.7%) were classified as Low Risk for sleep apnea and 21 (31.3%) were classified as High Risk for sleep apnea. Additionally, 54 (80.6%) were classified as Normal Sleepiness and 13 (19.4%) were classified as Abnormal Sleepiness. The overall mean T/S ratio was [mean ± SD] 0.8608 ± 1.0442. Figure 2A shows the mean distribution of T/S ratio within the study sample before bootstrapping approach was applied for the BQ. Figure 2B shows the same results after bootstrapping. By visual examination, the data distribution appeared smoother after bootstrapping, and the mean T/S ratio of Low Risk for sleep apnea (shown in blue) had a greater value than that for the High Risk category (shown in pink). This was indicated by the location of mean T/S ratio of Low Risk (farther to the right) as compared to the mean T/S ratio of High Risk (farther to the left). It is clear that the mean T/S ratio of Low Risk > High Risk for sleep apnea.
Figure 2.
Histogram of mean of T/S ratio for Low Risk versus High Risk for sleep apnea.
Figure 3 represents the histogram of all P values generated using repeated ANOVA from the 5,000 bootstrapping simulations performed. The figure shows that in 4,723 of the 5,000 iterations, the P value returned was < 0.05. Hence, the result represents evidence that there was significant group effect with respect to T/S ratio in the study. The differences in T/S ratio between the 2 groups was statistically significant 94.46% of the time. This means that fetuses born to mothers in the Low Risk category for sleep apnea had a longer telomere length than those born to mothers denoted as High Risk for sleep apnea.
Figure 3.
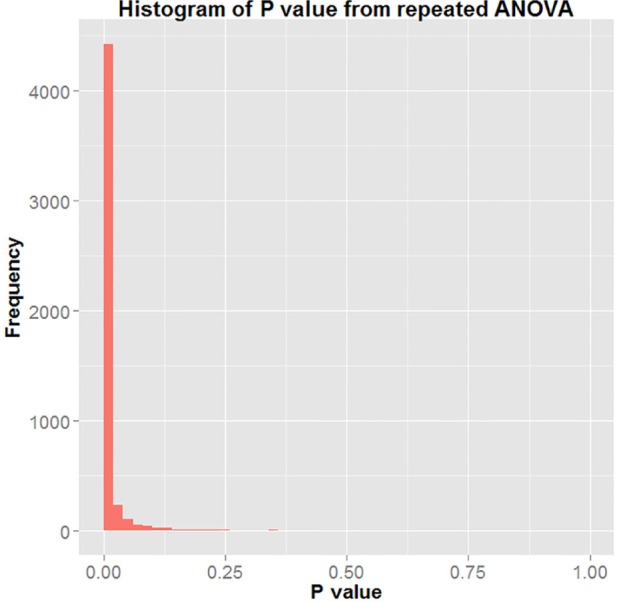
Histogram of P value of repeated ANOVA.
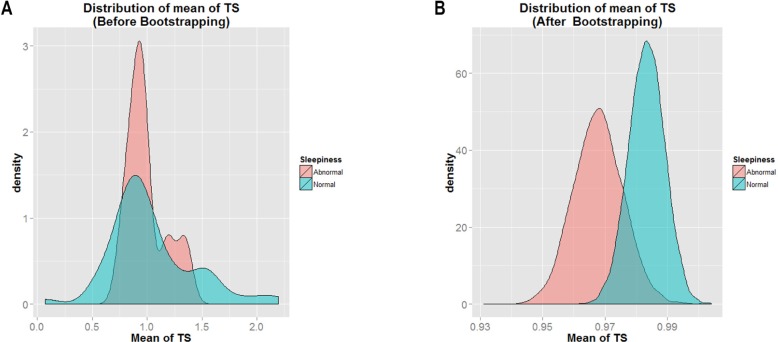
Figure 4A shows the mean distribution of T/S ratio within the study sample before bootstrapping approach was applied for the ESS scale. Figure 4B shows the same results after the bootstrapping. By visual examination, the data distribution appeared smoother after bootstrapping, and the mean T/S ratio of Normal Sleepiness (shown in blue) had the greater value as indicated by its location farther to the right than that of Abnormal Sleepiness (shown in pink). It is clear that the mean T/S ratio of Normal Sleepiness > Abnormal Sleepiness.
Figure 4.
Histogram of mean of T/S ratio for Normal Sleepiness and Abnormal Sleepiness.
The histogram in Figure 5 represents all P values generated using repeated ANOVA from the 5,000 bootstrapping simulations performed. The figure shows that in 295 of the 5,000 iterations, the P value returned was < 0.05 (5.9%). This means that T/S ratio was similar for the 2 groups.
Figure 5.
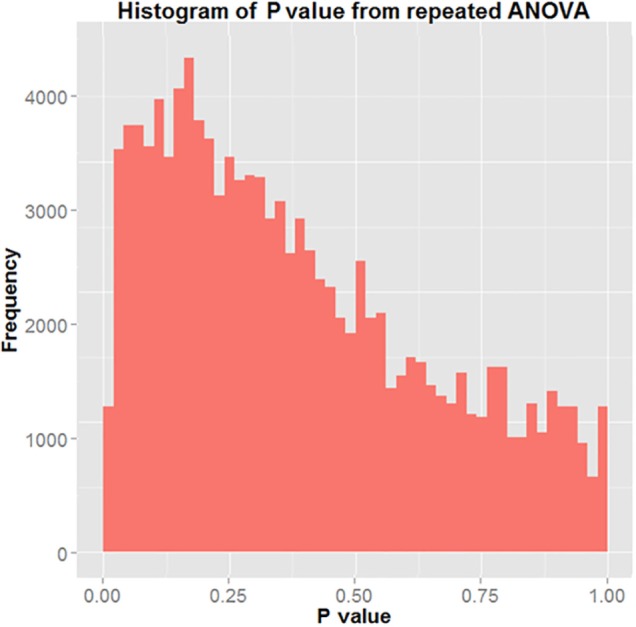
Histogram of P value of repeated ANOVA.
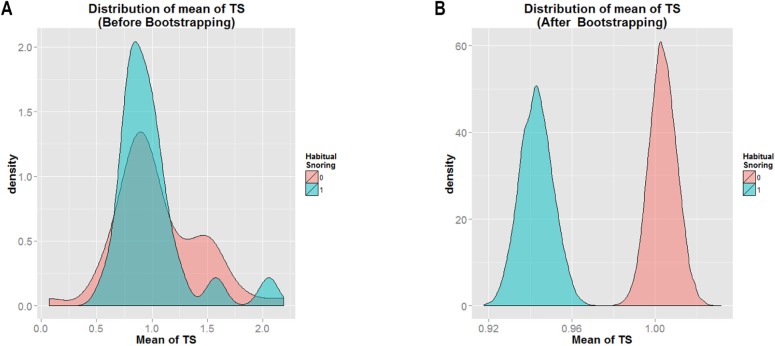
Among the cohort, 31.3% were classified as habitual snorers. Figure 6A shows the mean distribution of T/S ratio among women with and without habitual snoring before bootstrapping approach was applied. Figure 6B shows the same results after bootstrapping. By visual examination, the data distribution appeared smoother after bootstrapping, and the mean T/S ratio of those who were classified as non-habitual snorers (shown in pink) had a greater value than that those classified as habitual snorers (shown in blue). This was indicated by the location of mean T/S ratio of non-habitual snorers (farther to the right) as compared to the mean T/S ratio of habitual snorers (farther to the left). It is clear that the mean T/S ratio of non-habitual snorers > habitual snorers.
Figure 6.
Histogram of mean of TS for “Snore = 0” and “Snore = 1.”
Figure 7 represents the histogram of all P values generated using repeated ANOVA from the 5,000 bootstrapping simulations performed. The figure shows that in 5,000 of the 5,000 iterations, the P value returned was < 0.05. Hence, the result represents evidence that there was significant group effect with respect to T/S ratio in the study. The differences in T/S ratio between the 2 groups was statistically significant 100% of the time. This means that fetuses born to mothers in the non-habitual snorer category had a longer telomere length than those born to mothers denoted as habitual snorers.
Figure 7.
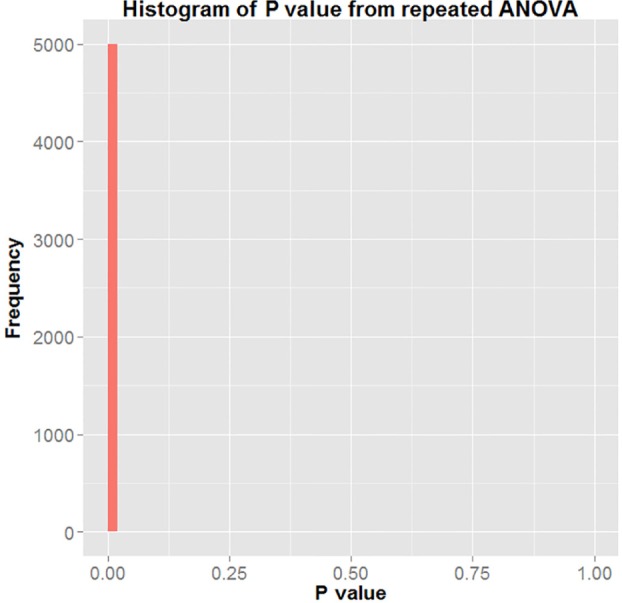
Histogram of P value of repeated ANOVA with H0: αNormal = αAbnormal = 0.
DISCUSSION
In this study, we sought to assess the impact of maternal symptoms of SDB, specifically, sleep apnea risk and daytime sleepiness, on fetal telomere length. We found that fetuses born to mothers at high risk for sleep apnea or habitual snorers had shorter fetal telomere length than their counterparts born to those at low risk for sleep apnea or without habitual snoring. This difference was statistically significant. By contrast, although we found that infants of mothers with normal daytime sleepiness had longer fetal telomere length than those born to mothers with abnormal daytime sleepiness, this difference was not statistically significant. These findings support our hypothesis that maternal symptoms of SDB during pregnancy may be associated with shorter fetal telomere length. Our results were validated using a robust statistical tool (bootstrapping), a resampling technique that reduces errors due to small sample sizes.
To our knowledge, our findings represent the first study that assesses the association between maternal symptoms of SDB during pregnancy and telomere length in the newborn. The results are consistent with studies performed in the adult population linking telomere shortening with abnormal sleep during adult life. The Helsinki Birth Cohort study found that sleep apnea in adults was significantly associated with shorter leukocyte telomere lengths,19 which could provide explanation of why patients with sleep apnea have a higher risk for developing age-related diseases.
The Whitehall II Cohort Study found that healthy adult men with greater sleep duration had longer telomeres than those with shorter sleep duration.20 The study also suggested that shorter sleep duration could lead to accelerated disease development due to shortened telomeres.20 These findings are consistent with similar results from other studies.19,21
Research is lacking in finding plausible biological mechanisms that could explain how symptoms of SDB, sleep apnea, and sleep dysfunction negatively affect the fetus. Sleep apnea is characterized by recurrent upper airway collapse and obstruction and oxygen desaturations.22 This repetitive obstruction of breathing associated with sleep apnea could lead to maternal hypertension and reduced oxygen flow to the placenta, suggesting a relationship between sleep apnea and intrauterine growth restriction and/or low birth weight.23 A review article explored the biological pathways of the association between SDB and adverse fetal outcomes and suggested that maternal sleep apnea is likely to increase gestational hypertension, preeclampsia, and possibly gestational diabetes.24 The article also suggests that oxidative stress, increased sympathetic activity, and insulin resistance could be potential mechanisms through which sleep apnea could lead to adverse pregnancy outcomes.24 These mechanisms could also be linked to shorter telomere lengths in fetuses exposed to sleep apnea, although research is needed to elucidate such an association.
Our study has notable strengths. To our knowledge, this is the first evidence showing a correlation between umbilical cord blood telomere shortening and sleep disordered breathing symptoms during pregnancy. An additional strength of the study is the robust methodology applied in our analysis (bootstrapping).
There are some limitations to consider. One of the limitations is the small sample size (N = 67); more studies using a larger sample size are needed to confirm our findings. As a result of paucity of numbers, we were not able to do subgroup analysis/dose-response analysis, but future studies should look at that possibility in order to strengthen the level of evidence. However, the small sample size adds weight to our findings, as we were able to attain significant results despite the smaller sample size. Additionally, our findings show that those with normal daytime sleepiness have longer fetal telomere lengths than those with abnormal sleepiness, but this finding was not statistically significant. More research is needed in maternal daytime sleepiness and the association with fetal telomere length employing larger sample sizes. That being the case, what we are reporting in this paper may represent an underestimation of the magnitude of the association between sleep disordered breathing and telomere length.
Subjects did not undergo polysomnography to provide objective testing for SDB. Therefore, a major limitation of this study is that we could not measure SDB clinically. We were only able to measure symptoms of SDB using the questionnaire data. Future research should look at the possibility of expanding the study by using polysomnography as a data collection instrument. Further, the timing of the questionnaire completion during the time period immediately before or after delivery may have introduced bias in the responses depending on the difficulty of their labor and delivery course. More recent studies have indicated that the Berlin Questionnaire lacks specificity for sleep apnea in pregnancy and therefore some subjects may have been misclassified. To the extent that such misclassification is more likely to be a random occurrence, the findings in this study of an association between symptoms of SDB and telomere length could have underestimated the actual magnitude of the association, and represent a conservative estimate.25 The ESS may not be an ideal tool during pregnancy. Future research should to be done using more precise instruments. Finally, we were unable to obtain pre-pregnancy BMI for the participants in this study. Because the majority of study participants were of low-income status, 90% started their prenatal care later in pregnancy. Because our study participants were recruited at labor and delivery hospital admission, rather than relying on medical records, we would have had to ask patients their pre-pregnancy weight. Many participants might not know or give accurate information about their pre-pregnancy weight. We report this as a major limitation of this study. Obesity is typically defined by pre-pregnancy BMI. Future research should obtain pre-pregnancy BMI when measuring the impact of symptoms of sleep disordered breathing on fetal telomere length.
Our conclusions are preliminary and raise the need for additional studies to replicate results and further examine the association between intrauterine exposure to maternal sleep disturbances and fetal telomere length. Further studies across populations are warranted in order to have a more generalizable result. Although identifying the most innovative and effective approaches of preventing sleep apnea and other sleep dysfunctions during pregnancy are challenging, it remains critical in making any meaningful impact on our ability to improve birth outcomes early in life to prevent adult onset disease.
In summary, our results provide the first evidence demonstrating shortened telomere length among fetuses exposed to maternal symptoms of SDB during pregnancy, and suggest symptoms of SDB as a possible mechanism of accelerated chromosomal aging.
DISCLOSURE STATEMENT
This work was supported by the James and Esther King Biomedical Research Program, Florida Department of Health (grant number 4KB03 & 1KG14-33987) and the University of South Florida Neuroscience Collaborative – Seed Grant Program and the University of South Florida Internal Awards Program Proposal Enhancement Grant. The authors have indicated no financial conflicts of interest.
ABBREVIATIONS
- BMI
body mass index
- BQ
Berlin Questionnaire
- ΔCt
cycle threshold
- ESS
Epworth Sleepiness Scale
- qPCR
quantitative PCR
- TGH
Tampa General Hospital
- T/S ratio
a ratio of relative telomere length was derived by telomere repeat copy number and single copy gene copy number
- USF
University of South Florida
REFERENCES
- 1.Zafarghandi N, Hadavand S, Davati A, Mohseni SM, Kimiaiimoghadam F, Torkestani F. The effects of sleep quality and duration in late pregnancy on labor and fetal outcome. J Matern Fetal Neonatal Med. 2012;25:535–7. doi: 10.3109/14767058.2011.600370. [DOI] [PubMed] [Google Scholar]
- 2.Owusu JT, Anderson FJ, Coleman J, Oppong S, Seffah JD, Aikins A, O'Brien LM. Association of maternal sleep practices with preeclampsia, low birth weight, and stillbirth among Ghanaian women. Int J Gynaecol Obstet. 2013;121:261–5. doi: 10.1016/j.ijgo.2013.01.013. [DOI] [PMC free article] [PubMed] [Google Scholar]
- 3.Abeysena C, Jayawardana P, DE A Seneviratne R. Maternal sleep deprivation is a risk factor for small for gestational age: a cohort study. Aust N Z J Obstet Gynaecol. 2009;49:382–7. doi: 10.1111/j.1479-828X.2009.01010.x. [DOI] [PubMed] [Google Scholar]
- 4.Chang PJ, Chu LC, Hsieh WS, Chuang YL, Lin SJ, Chen PC. Working hours and risk of gestational hypertension and pre-eclampsia. Occup Med (Lond) 2010;60:66–71. doi: 10.1093/occmed/kqp119. [DOI] [PubMed] [Google Scholar]
- 5.Ugur MG, Boynukalin K, Atak Z, Ustuner I, Atakan R, Baykal C. Sleep disturbances in pregnant patients and the relation to obstetric outcome. Clin Exp Obstet Gynecol. 2012;39:214–7. [PubMed] [Google Scholar]
- 6.Louis J, Auckley D, Miladinovic B, et al. Perinatal outcomes associated with obstructive sleep apnea in obese pregnant women. Obstet Gynecol. 2012;120:1085–92. doi: 10.1097/AOG.0b013e31826eb9d8. [DOI] [PMC free article] [PubMed] [Google Scholar]
- 7.O'Brien LM, Bullough AS, Owusu JT, et al. Snoring during pregnancy and delivery outcomes: a cohort study. Sleep. 2013;36:1625–32. doi: 10.5665/sleep.3112. [DOI] [PMC free article] [PubMed] [Google Scholar]
- 8.Atzmon G, Cho M, Cawthon RM, et al. Evolution in health and medicine Sackler colloquium: genetic variation in human telomerase is associated with telomere length in Ashkenazi centenarians. Proc Natl Acad Sci U S A. 2010;107(Suppl 1):1710–7. doi: 10.1073/pnas.0906191106. [DOI] [PMC free article] [PubMed] [Google Scholar]
- 9.Barceló A, Piérola J, López-Escribano H, et al. Telomere shortening in sleep apnea syndrome. Respir Med. 2010;104:1225–9. doi: 10.1016/j.rmed.2010.03.025. [DOI] [PubMed] [Google Scholar]
- 10.Netzer NC, Stoohs RA, Netzer CM, Clark K, Strohl KP. Using the Berlin Questionnaire to identify patients at risk for the sleep apnea syndrome. Ann Intern Med. 1999;131:485–91. doi: 10.7326/0003-4819-131-7-199910050-00002. [DOI] [PubMed] [Google Scholar]
- 11.Johns MW. A new method for measuring daytime sleepiness: the Epworth sleepiness scale. Sleep. 1991;14:540–5. doi: 10.1093/sleep/14.6.540. [DOI] [PubMed] [Google Scholar]
- 12.Sahin FK, Koken G, Cosar E, et al. Obstructive sleep apnea in pregnancy and fetal outcome. Int J Gynaecol Obstet. 2008;100:141–6. doi: 10.1016/j.ijgo.2007.08.012. [DOI] [PubMed] [Google Scholar]
- 13.Cawthon RM. Telomere measurement by quantitative PCR. Nucleic Acids Res. 2002;30:e47. doi: 10.1093/nar/30.10.e47. [DOI] [PMC free article] [PubMed] [Google Scholar]
- 14.Aviv A, Hunt SC, Lin J, Cao X, Kimura M, Blackburn E. Impartial comparative analysis of measurement of leukocyte telomere length/ DNA content by Southern blots and qPCR. Nucleic Acids Res. 2011;39:e134. doi: 10.1093/nar/gkr634. [DOI] [PMC free article] [PubMed] [Google Scholar]
- 15.Drury SS, Theall K, Gleason MM, et al. Telomere length and early severe social deprivation: linking early adversity and cellular aging. Mol Psychiatry. 2012;17:719–27. doi: 10.1038/mp.2011.53. [DOI] [PMC free article] [PubMed] [Google Scholar]
- 16.Porter S, Rao ST, Ku J, Poirot RL, Dakins M. Small sample properties of nonparametric bootstrap t confidence intervals. J Air Waste Manag Assoc. 1997;47:1197–203. [Google Scholar]
- 17.Preacher KJ, Hayes AF. Asymptotic and resampling strategies for assessing and comparing indirect effects in multiple mediator models. Behav Res Methods. 2008;40:879–91. doi: 10.3758/brm.40.3.879. [DOI] [PubMed] [Google Scholar]
- 18.Efron B. Bootstrap methods: another look at the jackknife. Ann Stat. 1979;7:1–26. [Google Scholar]
- 19.Savolainen K, Eriksson JG, Kajantie E, Lahti M, Räikkönen K. The history of sleep apnea is associated with shorter leukocyte telomere length: the Helsinki Birth Cohort Study. Sleep Med. 2014;15:209–12. doi: 10.1016/j.sleep.2013.11.779. [DOI] [PubMed] [Google Scholar]
- 20.Jackowska M, Hamer M, Carvalho LA, Erusalimsky JD, Butcher L, Steptoe A. Short sleep duration is associated with shorter telomere length in healthy men: findings from the Whitehall II cohort study. PLoS One. 2012;7:e47292. doi: 10.1371/journal.pone.0047292. [DOI] [PMC free article] [PubMed] [Google Scholar]
- 21.Prather AA, Puterman E, Lin J, et al. Shorter leukocyte telomere length in midlife women with poor sleep. J Aging Res. 2011;2011:721390. doi: 10.4061/2011/721390. [DOI] [PMC free article] [PubMed] [Google Scholar]
- 22.Venkata C, Venkateshiah SB. Sleep-disordered breathing during pregnancy. J Am Board Fam Med. 2009;22:158–68. doi: 10.3122/jabfm.2009.02.080057. [DOI] [PubMed] [Google Scholar]
- 23.Micheli K, Komninos I, Bagkeris E, et al. Sleep patterns in late pregnancy and risk of preterm birth and fetal growth restriction. Epidemiology. 2011;5:738–44. doi: 10.1097/EDE.0b013e31822546fd. [DOI] [PubMed] [Google Scholar]
- 24.Izci-Balserak B, Pien GW. Sleep-disordered breathing and pregnancy: potential mechanisms and evidence for maternal and fetal morbidity. Curr Opin Pulm Med. 2010;16:574–82. doi: 10.1097/MCP.0b013e32833f0d55. [DOI] [PMC free article] [PubMed] [Google Scholar]
- 25.Wilson DL, Walker SP, Fung AM, O'Donoghue F, Barnes M, Howard M. Can we predict sleep disordered breathing in pregnancy? The clinical utility of symptoms. J Sleep Res. 2013;22:670–8. doi: 10.1111/jsr.12063. [DOI] [PubMed] [Google Scholar]


