

Abstract
Study Objective:
Blood pressure (BP) may be adversely affected by a variety of sleep disturbances, including sleep fragmentation, hypoxemia, respiratory disturbances, and periodic limb movements. We aim to identify which polysomnography indices are most strongly and consistently associated with systolic and diastolic blood pressure (SBP, DBP) levels in a population-based sample.
Design:
Cross-sectional analysis of data from 2,040 participants in the Multi-Ethnic Study of Atherosclerosis (MESA) who underwent polysomnography at MESA Exam 5 in 2011–2013.
Setting:
Multisite cohort study.
Participants:
Participants were mean age 68 y (54% females; 28% African American, 24% Hispanic, 11% Chinese).
Measurements:
Thirty-two candidate polysomnography predictors were identified representing the domains of breathing disturbance frequency, hypoxemia, sleep architecture, and periodic limb movements. Cluster analysis was used for variable reduction. Statistical models, adjusted for potential confounders, were derived using stepwise regression. Final models were selected using cross-validation techniques.
Results:
The apnea-hypopnea index (AHI) defined using a 4% desaturation hypopnea criterion (AHI4P) was most consistently associated with SBP level. The AHI and periodic limb movement index (associated with arousals; PLMIA) were significantly associated with DBP. Estimated adjusted differences in SBP and DBP levels between an individual with no sleep apnea (AHI4P = 0) and one with moderately severe sleep apnea (AHI4P = 30) were 2.2 mm Hg and 1.1 mm Hg, respectively. Each 10-unit increase in the PLMIA was associated with an increase in DBP of 1.2 mm Hg.
Conclusion:
Our results support the use of a currently recommended apnea-hypopnea index definition as a marker of blood pressure risk and indicate that measurement of limb movements with arousals is also independently associated with diastolic blood pressure.
Citation:
Dean DA, Wang R, Jacobs DR, Duprez D, Punjabi NM, Zee PC, Shea S, Watson K, Redline S. A Systematic assessment of the association of polysomnographic indices with blood pressure: the Multi-Ethnic Study of Atherosclerosis (MESA). SLEEP 2015;38(4):587–596.
Keywords: cluster analysis, cohort study, cross validation, diastolic blood pressure, hypertension, imputation, multiethnic, sleep exposure, systolic blood pressure
INTRODUCTION
Hypertension is prevalent in the United States, with a third of adults having a hypertension diagnosis.1–4 Untreated hyper-tension is associated with an increased risk of cardiovascular disease, ischemic heart disease, stroke, and congestive heart failure.5 There are a number of well-established risk factors for hypertension, such as advanced age, obesity, sodium in-take, reduced physical activity, alcohol intake, diabetes mellitus, elevated low-density lipoprotein, smoking, psychological factors, and family history.6–9 Additionally, recent data point to sleep disturbances as novel and potentially modifiable risk factors for hypertension. During healthy sleep, blood pressure decreases by 10% or more, a condition known as nocturnal dipping. During disturbed sleep, with or without hypoxemia occurring secondary to disordered breathing, the normal para-sympathetic-sympathetic nervous system balance may be altered, contributing to non-dipping or reverse nocturnal dipping, as well as sustained daytime hypertension.10,11 Experimental exposures to episodes of airway occlusion or arousal12 or to selective deprivation of slow wave sleep,13 or to a single night of sleep deprivation14 lead to acute blood pressure elevations. Prospective studies also indicate that incident hypertension is increased in association with untreated sleep disordered breathing (SDB),15–21 periodic limb movements (PLMs),22–28 and curtailed sleep duration,29 as well as reduced slow wave sleep duration.30 However, prior research has not systematically or comprehensively addressed the independent relationships of these varied sleep disturbances to hypertension in population samples. Understanding which sleep exposures are most consistently associated with elevated blood pressure could provide physiological insights into hypertension mechanisms as well as help inform the choice of sleep parameters for measurement in clinical or research settings.
In this study, we aimed to systematically evaluate the association of measures of breathing disturbances, sleep fragmentation, sleep duration, hypoxemia, limb movements, and sleep stage distribution with systolic blood pressure (SBP) and diastolic blood pressure (DBP) in a large, ethnically diverse population, the Multi-Ethnic Study of Atherosclerosis (MESA).31 To address the analytical challenges that arise when modeling multiple measures, many of which are highly correlated (Tables S1–S6, supplemental material), we use a rigorous four-stage statistical modeling procedure. Looking across five sleep exposure domains—sleep structure, arousals, breathing event frequency, oxygen saturation and limb movements—we specifically sought to identify which sleep measures associate with elevated blood pressure. We hypothesized that one or more sleep exposures would be selected by the analysis procedure and that the selected sleep measure may differ by SBP and DBP.
METHODS
Sample and Protocol
The current report is based on data collected from MESA, a multicenter prospective study designed to investigate the progression from subclinical to clinical cardiovascular disease.31 In total, 6,814 participants free of cardiovascular disease were recruited from July 2000 to August 2002 from six sites (Baltimore, MD; Chicago, IL, Forsyth County, NC; Los Angeles County, CA; Northern Manhattan, NY; and St. Paul, MN) and underwent assessment of a wide range of cardiovascular disease risk factors and measures of subclinical cardiovascular disease as described previously.31 Four subsequent examinations occurred after median 1.5, 3.2, 5, and 9.7 y. At Exam 5 (2010–2012), participants underwent standardized measurements of height, weight, and blood pressure and other measurements at a research clinic exam. Resting blood pressure was measured in triplicate using a Dinamap automated device (Model PRO 100, GE Healthcare) in a sitting position from the right arm during a morning examination (average measurement time 08:54 ± 48 min). The first blood pressure measurement was recorded after 5 min in the sitting position. Subsequent measurements were 5 min apart. Anthropometry was performed as previously described.32 Medical history, personal history, medication use, and physical activity were obtained using standardized questionnaires.31
Participants in Exam 5 were invited to participate in a sleep examination for collection of polysomnography (PSG), actigraphy, and sleep questionnaire data during a subsequent in-home examination. Sleep habits and sleep symptoms were collected with a sleep questionnaire adapted from the Hispanic Community Health Study Sleep Questionnaire33 and which includes questions from validated instruments.22,34–37 Unattended PSG was conducted in the participants' homes or other convenient location by certified staffed members who followed procedures similar to those described for the Sleep Heart Health Study.35 PSG data were collected using a 15-channel monitor (Compumedics Somte System; Compumedics Ltd., Abbots-ville, AU). The recoding montage included central, frontal, and occipital electroencephalography (EEG) sampled at 256 Hz, bilateral electrooculograms, a chin electromyogram, bipolar echocardiography, thoracic and abdominal respiratory inductance plethysmography, airflow measured by thermo-couple and nasal pressure cannula, finger pulse oximetry, and bilateral limb movements measured using by piezoelectric sensors. The median time between the Exam 5 clinic examination and the sleep study was 300 days. Institutional Review Board approval was obtained at each study site and written informed consent was obtained from all participants.
PSG Scoring
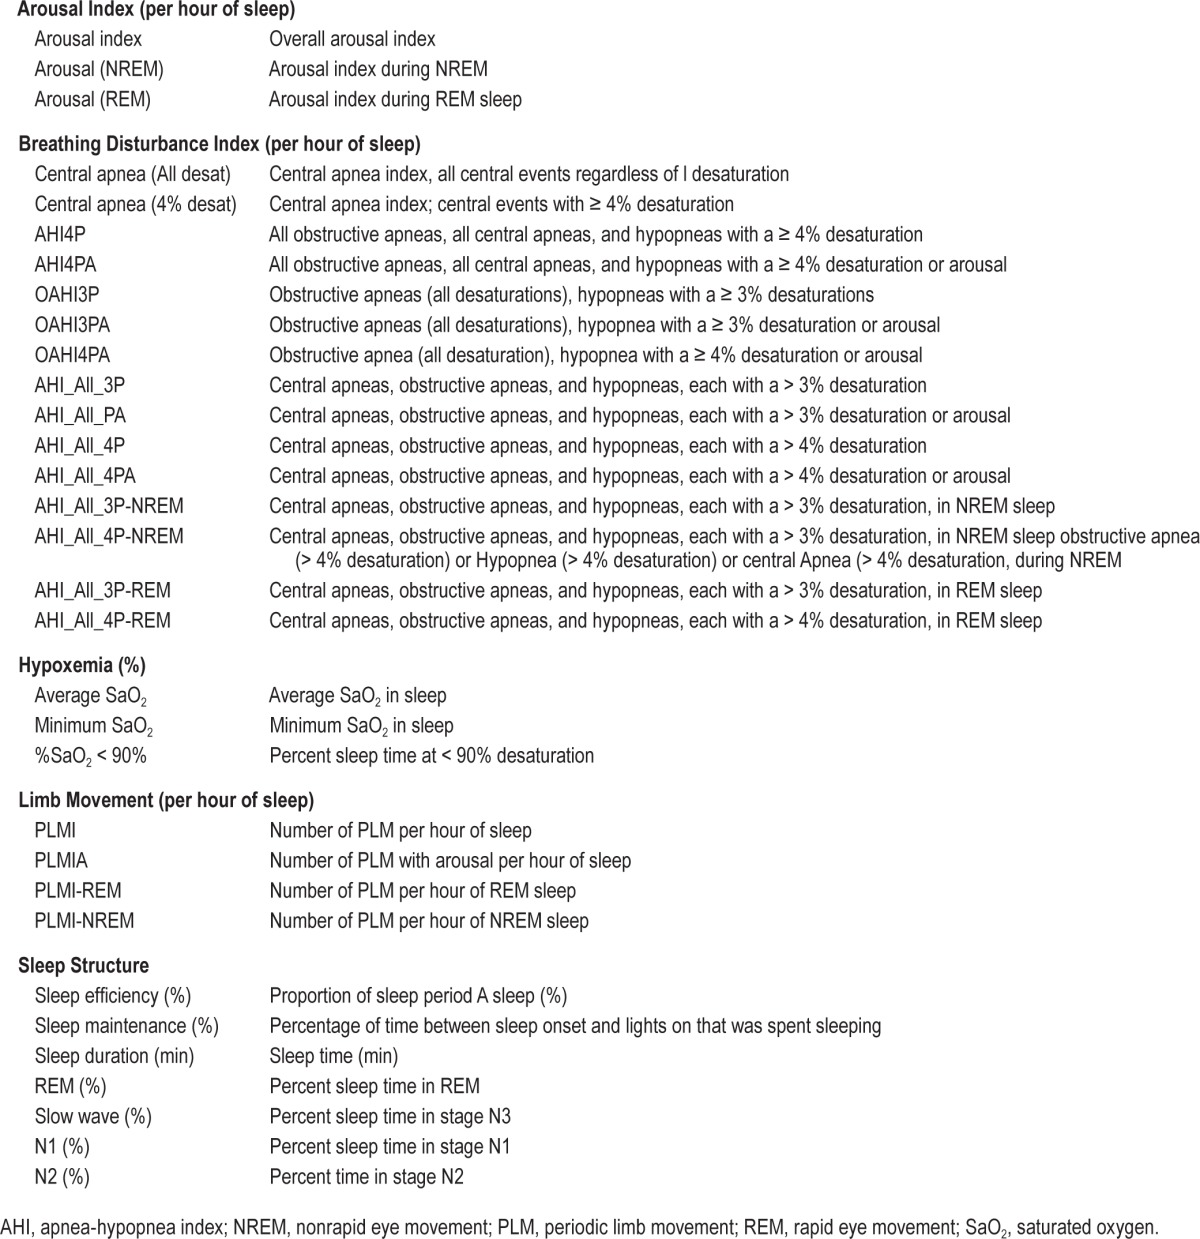
Each sleep study was reviewed for quality and scored by registered polysomnologists according to standardized criteria,38 using similar approaches as for the Sleep Heart Health Study at a centralized reading center (Brigham and Women's Hospital, Boston, MA).39,40 Sleep stages and arousals were scored according to American Academy of Sleep Medicine scoring guidelines.41 Apneas were scored when the thermocouple signal flattened or nearly flattened for greater than 10 sec. Hypopneas were scored when the amplitude of the sum of the abdominal and thoracic inductance signals or the nasal pressure flow signal decreased by 30% or more for greater than or equal to 10 sec. Events were classified as either “central” or “obstructive” according to the presence of absence of respiratory effort. Specialized software link apnea and hypopnea with data from the oxygen saturation and EEG signals, allowing each event to be characterized according to the degree of associated desaturation and arousal. PLMs were identified by the number and pattern of limb movements (greater than four movements each separated by 5–90 seconds). Software provide summary measures of apnea-hypopnea indices (AHIs) computed using different degrees of associated desaturation and arousal, arousal indices, and PLM index computed with all limb movements or limb movements with EEG arousals, with all indices stratified by rapid eye movement (REM) and nonrapid eye movement (NREM) sleep (Table 1). Given the multiple ways to derive these various indices, in total, over 2,500 PSG variables were available for potential analysis.
Table 1.
Candidate sleep exposures.
Definitions
The average of the second and third blood pressure measurements taken from Exam 5 were used to calculate SBP and DBP. Hypertension is defined as SBP > 140 mm Hg, SBP > 90, or use of hypertension medication. For statistical modeling, measured values of SBP and DBP values were adjusted for hypertension medication use by an imputation technique described in the literature.42,43 This imputation approach used data from the subset of new drug users throughout the MESA study to build a parametric model to estimate the underlying untreated variable of interest as a function of observed treated value, type of medication, and patient characteristics, assuming that the most recent pretreatment value is the underlying unobserved untreated value at the time when the first posttreatment value was measured. This is a reasonable assumption because the model was built based on the subset of new drug users and their pretreatment value and “unobserved untreated values” are not too far apart in time. The specific imputation model used included the following variables: observed on-treatment SBP or DBP, indicators for each class of antihypertensive medication (beta blockers, calcium channel blockers, diuretics, ace inhibitors/angiotensin II receptor blockers, vasodilators), age, sex, race/ethnicity, body mass index, diabetes, high-density lipoprotein and total cholesterol, smoking status (never/former/current), all two-way interactions between different medication types, and twoway interactions between each of sex and race/ethnicity with each medication type. To incorporate the variability in the imputed values, we generated 10 imputed SBP and DBP datasets and pooled the results using standard multiple imputation methods.44 Medication use was assessed from review of the participants' medication containers. Smoking and alcohol status was determined by a personal history questionnaire. Smoking status was defined as having ever smoked (yes/no) and the variable was dichotomized from the current smoking status question. Alcohol use was defined as a positive response to the statement, “Presently Drink Alcohol.” Information on potential cardiovascular disease (CVD) events was obtained during each cohort exam and follow-up calls to each participant that occurred every 10–12 mo. Reported events were confirmed by a centralized endpoint committee based on medical record abstractions, death certificates, autopsy reports, and/or obituaries. CVD events included myocardial infarction, resuscitated cardiac arrest, definite angina, probable angina (if followed by revascularization), stroke, stroke death, coronary heart disease death, other atherosclerotic death. and other CVD death.45 Diabetes was defined as fasting glucose ≥ 126 ml/dL and/or use of antidiabetes medications, a definition based on the 2003 American Diabetes Association criteria.46,47 Congestive heart failure (CHF) was adjudicated and required one or more criteria, such as pulmonary edema/congestion by chest x-ray, dilated ventricle, reduced left ventricular function, or diastolic dysfunction by an imaging study. CHF events required physician diagnosis, supporting clinical evidence and symptoms such as shortness of breath or edema.48 Covariates were derived from MESA Exam 5 and follow-up of 10 measurements.
Statistical Methods
Overview
A cross section analysis aimed at identifying sleep exposures predictive of SBP and DBP is undertaken. A four-stage procedure was used to prioritize polysomnographic indices for subsequent statistical modeling from five domains (breathing disturbance frequency, overnight hypoxemia, sleep fragmentation, sleep stage distribution, and PLMs) through use of variable reduction procedures.49–51 After reducing the set of exposure variables, stepwise regression modeling and cross validation of the reduced set of exposure variables were conducted to identify those variables that were most strongly and consistently associated with blood pressure.52
Exposure Selection (Variable Reduction)
Each sleep study included 2,687 scored sleep variables across 11 groupings (Figure 1), including indices specific for REM/NREM sleep and indices with and without different degrees of oxygen desaturation and/ or arousal. The first data reduction was accomplished by reviewing commonly used sleep terms in the literature and reviewing the selected variables with practicing sleep clinicians. The variable selection process was designed to ensure that variables across arousals, breathing disturbances, hypoxemia, limb movements, and sleep structure domain were included. The primary objective of the data selection step was to ensure that the generated models were clinically relevant and interpretable. The initial data reduction step resulted in 32 polysomnographic indices that represented indices from each of the aforementioned five domains49–51 (Table 1). Second, cluster analysis was used to reduce this variable set to a smaller representative subset. This approach first found groups of variables that were as correlated as possible among themselves and as uncorrelated as possible with variables in other clusters, then chose one variable from each group with a high correlation with its own cluster and a low correlation with the other clusters.49,51
Figure 1.

Sleep exposure variable selection schematic. (A) Exposures were selected from the technician scored and automatically generated variables generated for each subject. The exposures include 2,687 variables across 11 sections. (B) The first data reduction was conducted by selecting 32 variables commonly used in the literature and by clinician input. (C) Cluster analysis was used to reduce the 32 selected exposures to eight clusters each represented by an exposure. The numbers of clusters were selected by an automated algorithm. Two exposures (AHI4PA-REM and Sleep Efficiency) were replaced with clinically relevant alternatives (AHI4PA and Sleep Maintenance). (D) Eight sleep exposures selected for modeling are presented.
Statistical Modeling
The group of candidate sleep measurements selected by the data reduction method were evaluated for their association with SBP and DBP adjusted for hypertension medication use using a tenfold cross-validated stepwise variable selection procedure.52 In the stepwise procedure, variables were included at P ≤ 0.05 and removed at P ≥ 0.1. The P value was computed based on an F-test of the change in the sum of squared error by adding or removing the term. The cross validation procedure generated 10 models by first randomly dividing the dataset into 10 approximately equal partitions. The stepwise procedure was applied to nine tenths of the data, resulting in a model that was validated in the remaining one tenth of data not used during the model fitting procedure. Of the 10 generated models, the model with the lowest mean square error was selected as the final model. The final model was fit to the entire dataset. All models were adjusted for ethnicity, age, sex, alcohol use, smoking, body mass index (BMI), and waist circumference. Each of the 10 SBP and DBP imputed data sets were fit; model parameter estimates were obtained by averaging the estimates from each imputed dataset using the multiple imputation method.44,53 The linearity assumptions was assessed graphically and using nonparametric regression.54,55 In sensitivity analyses, the final models were alternatively fit by adjusting SBP and DBP for hypertension medications by using a fixed constant (10 and 5 mm Hg, respectively, for SBP and DBP) rather than using the imputed values; and models were further adjusted for diabetes, CHF, and CVD. SAS 9.3 (Gary, IN) and MATLAB 2013a (MathWorks, Natick, MA) were used to perform analyses.
RESULTS
Sample Characteristics
PSG data were available for 2,040 MESA participants. They were age 68.0 (13.0) y (mean; standard deviation) and included 54% females, 28% African Americans, 24% Hispanics, and 12% Chinese. Of this sample, 57.5% were classified as hyper-tensive and 54% reporting using antihypertensive medications. The population is on average overweight (mean BMI 27.9 kg/m2). The prevalence of CVD and CHF was 4.6% and 2.5%, respectively. The average SBP and DBP are respectively 120.0 (interquartile range [IQR] = 26.0) and 68.0 (IQR = 13.0) mm Hg. Compared to participants in the Exam 5 who did not undergo the sleep examination, examination participants were younger, less likely to be hypertensive, and more likely to be Hispanic (Table S7, supplemental material).
Sample Characteristics by Level of Blood Pressure
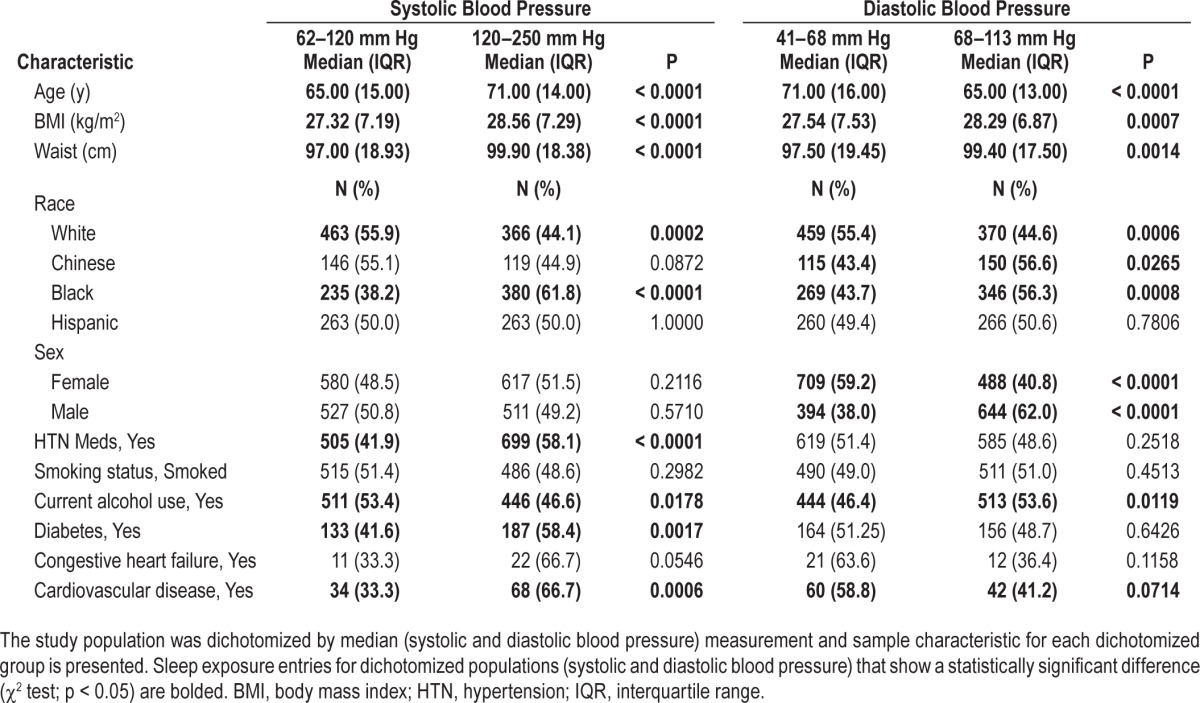
Sample characteristics for the upper and lower 50th percentile for SBP and DBP are presented in Table 2. Higher SBP is associated with older age, higher BMI and waist circumference, increased hypertension medication use, lower alcohol use, and African American race. Higher DBP is associated with male sex, African American race, younger age, increased BMI and waist circumference, and an increase in alcohol use.
Table 2.
Sample characteristics by median blood pressure.
Sleep Characteristics by Blood Pressure Level
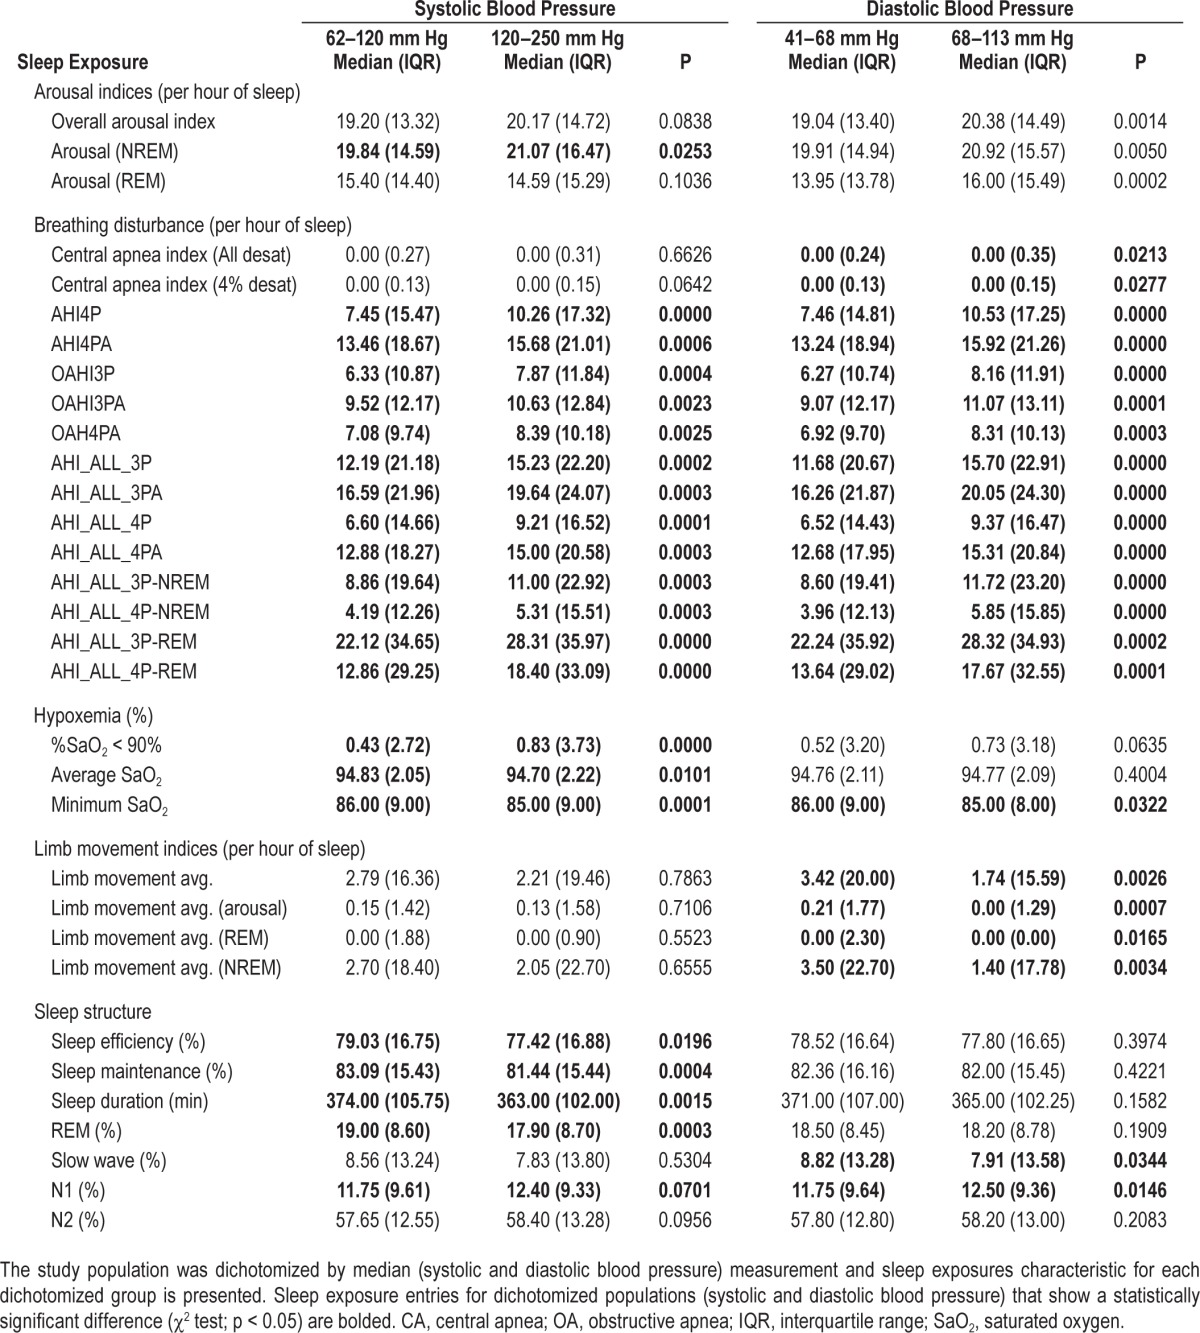
Sleep characteristics for the upper and lower 50th percentiles of SBP and DBP are presented in Table 3. In unadjusted analyses, both overall and NREM-specific arousal indices and indices of the various apnea hypopnea indices were higher in participants with elevated SBP or DBP. However, the arousal index in REM and central apnea indices were only higher in association with elevated DBP. Additionally, measures of hypoxemia and sleep efficiency and duration were more disturbed in association with SBP than DBP, whereas PLM indices and sleep stage distributions were more abnormal in association with DBP.
Table 3.
Sleep exposures by median blood pressure.
Sleep Indices Selected by Cluster Analysis
The cluster procedure identified eight clusters. The sleep exposures that explained the highest proportion of variance within each cluster were: arousal index, AHI4PA (defined as all central and obstructive apneas and hypopneas with 4% desaturation or arousal), AHI_All_4P-REM (central apneas, obstructive apneas, and hypopneas, each with a > 4% desaturation, in REM sleep), central apnea (all desat), percent sleep time in oxygen saturation of less than 90%, PLM with associated arousal (PLMIA), sleep efficiency, and percentage of sleep time in stage N2. Each of the initial five sleep exposure domains represented in the complete sleep exposure data set are represented in the reduced dataset of selected exposures. The selected variables were reviewed for clinical relevance and potential replacement. It was noted that the variance explained by the AHI4PA and AHI4 (all central and obstructive apneas and hypopneas with a 4% desaturation) were nearly identical. Therefore, the simpler measurement was selected, which corresponds to the American Academy of Sleep Medicine recommended definition.
SBP Model
The SBP model is depicted in Table 4. Each of the 10 cross-validated models was evaluated using the mean square error (MSE), which ranged from 228.3 to 319.6. The model with the smallest MSE was selected as the final model. All 10 models generated by the cross- validation procedure included the AHI4P and seven of 10 models included the PLMIA. The cross-validation procedure identified the AHI4P as significantly associated with SBP when adjusted for age, sex, race, alcohol use, smoking, BMI, and waist (β = 0.0735 events/h/mm Hg, P = 0.0053). SBP model parameters variances that take into account within and between imputed dataset variance are presented in the supplementary materials (Table S8, supplemental material).
Table 4.
Systolic blood pressure models.
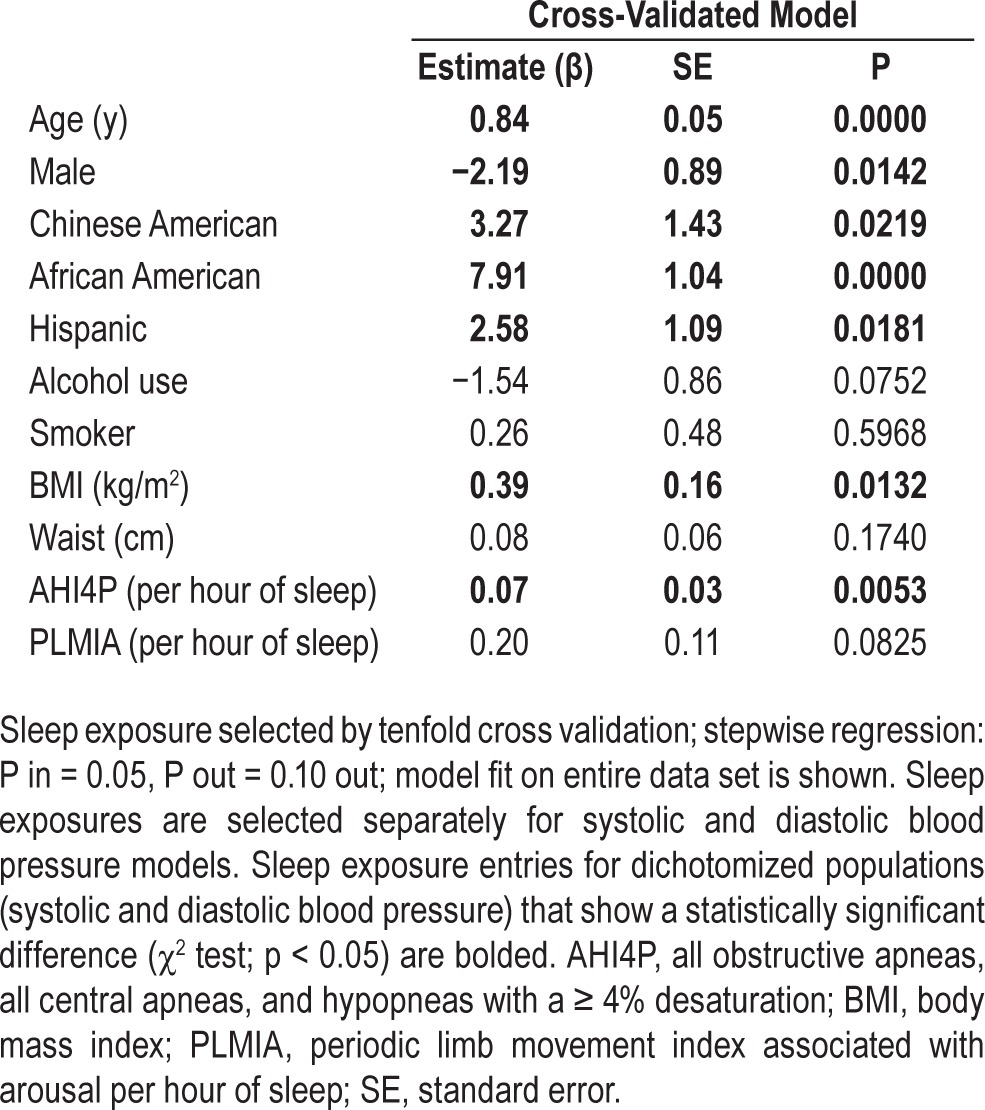
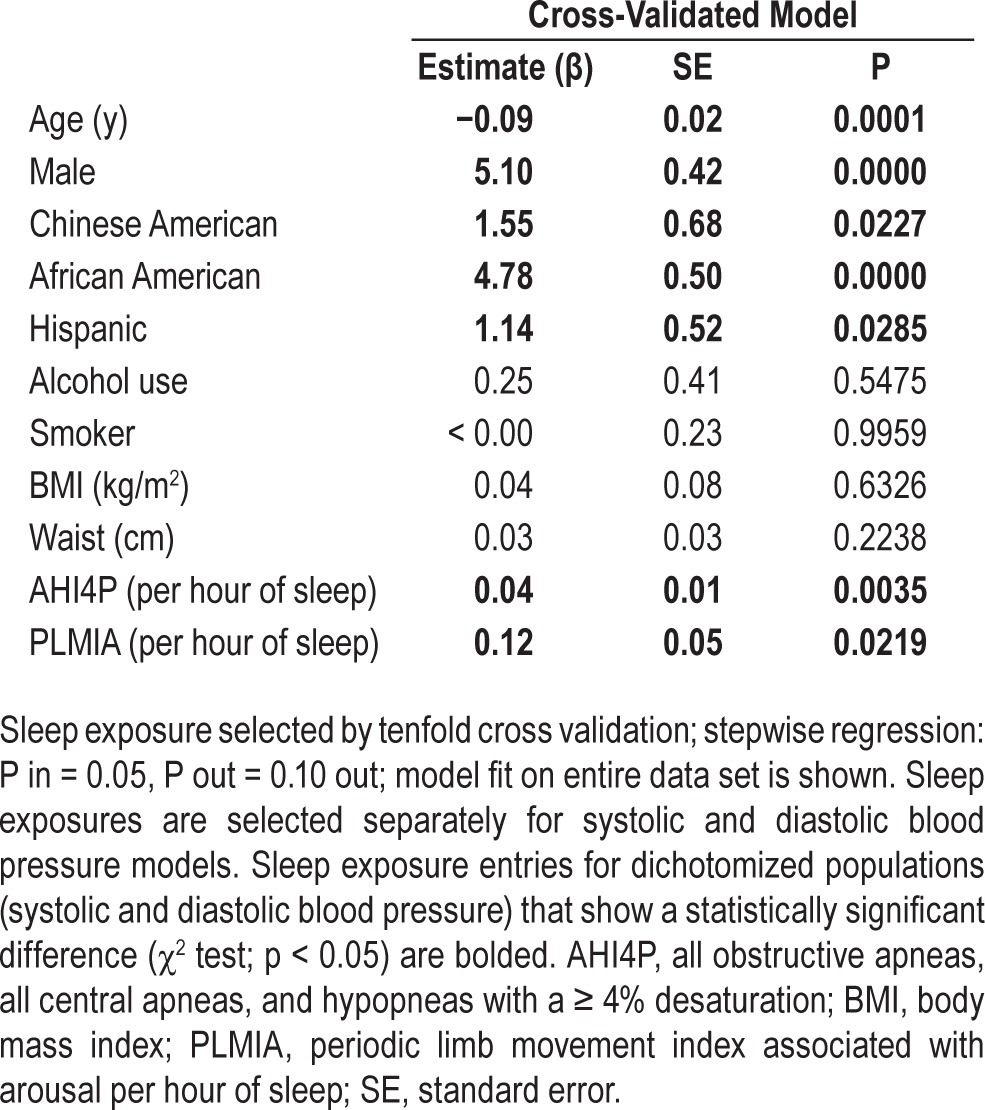
DBP Model
The DBP model is depicted in Table 5. Each of the 10 cross-validated models was evaluated using the MSE, which ranged from 45.3 to 77.5. The model with the smallest MSE was selected as the final model. All 10 models generated by the cross-validation procedure included PLMIA and eight of 10 models included the AHI4P. The best model selected by MSE included AHI4P (β = 0.037 events/h/mm Hg, P = 0.004) and PLMIA (β = 0.123 events/h/mm Hg, P = 0.022) as associated with DBP when adjusted by age, sex, race, alcohol use, smoking, BMI, and waist. DBP model parameter variances that take into account within and between imputed dataset variance are presented in the supplementary materials (Table S8).
Table 5.
Diastolic blood pressure models.
Sensitivity Analyses
The final models for continuously measured SBP and DBP outcomes shown in Tables 3 and 4 were re-fit to the measured SBP and DBP adjusted for medication use by adding a fixed constant (10 and 5 mm Hg, respectively, for SBP and DBP) (Tables S9 and S10, supplemental material) rather than with use-imputed BP values. The SBP model resulted in comparable parameter estimates for PLMAI but had larger standard errors. The SBP model also had comparable parameters estimates for AHI4P but had larger standard errors. Similarly, the DBP models had comparable parameters for both PLMIA and AHI4P, but with larger standard errors. Final cross-validated SBP and DBP models further adjusted for diabetes, CHF, and CVD (possible confounders or outcomes of hypertension) were consistent with the models presented in the manuscript and are provided in the supplement (Tables S11 and S12, supplemental material).
DISCUSSION
PSG provides the ability to collect numerous types of physiological data, which when processed can result in thousands of potential metrics to use for research and clinical purposes. Dissecting the relative contributions of numerous and often correlated measures poses numerous challenges. In this analysis, we attempted to overcome these challenges by applying a structured and comprehensive assessment of the association of a wide range of polysomnographic indices with blood pressure (BP) levels in a well-characterized and ethnically diverse sample. Through a rigorous cross-validated variable selection procedure, we identified two commonly used PSG metrics as providing the most consistent associations with BP. Of note, among 16 possible derivations of the AHI (using different degrees of desaturation, arousal, and inclusion or not of central events) this analysis identified the AHI4P—corresponding to the currently recommended AHI definition—as the AHI derivation that most consistently was associated with SBP and DBP. Notably, AHI metrics that used hypopnea definitions that required an arousal with or without a desaturation did not provide superior information compared to the simpler AHI4P. The selection of AHI by the methods described in this article is supported by previous findings.20,21,56 Of note, the utility of using an AHI at 4% oxygen desaturation has been identified using data from the Sleep Heart Health Study20 and the Wisconsin Sleep Cohort Study.21 After AHI was included in the models considered, there was little added predictive information for SBP attributable to consideration of arousal frequency, hypoxemia, or sleep stage distribution. The PLMIA (i.e., PLM associated with arousals) was significantly associated with DBP, and marginally associated with SBP. These analyses support the clinical utility of a commonly measured AHI20,21,56 as well as the PLM index (with arousals) for characterizing physiological sleep disturbances associated with outcomes such as hypertension.
A major challenge in analyzing the association between measures of sleep disturbances and BP relates to the frequent use of antihypertensive medication in older adults. Because of this, most prior research studies have not analyzed continuously measured BP values, but rather have analyzed binary outcomes that have combined measured BP values with self-reported medication use.20,29,57–59 This approach has numerous limitations and does not address the potential effect of sleep disturbances on BP level. Through use of a rigorous imputation procedure that estimated BP level with use of longitudinal study data, we were able to estimate the incremental influence of variation in AHI and PLMIA on BP level. After adjusting for key confounders, we estimate that each 10-unit increment in the AHI corresponds to a 0.74 mm Hg increase in SBP and a 0.37 mm Hg increase in DBP. In other words, the estimated adjusted differences in SBP and DBP levels between an individual with no sleep apnea (AHI4P = 0) and moderately severe sleep apnea (AHI4P = 30) is 2.2 and 1.1 mm Hg, respectively. Similarly, comparing those without sleep apnea to those with severe sleep apnea (AHI4P = 60) yields estimated average adjusted differences in SBP and DBP of 4.4 and 1.2 mm Hg, respectively. The estimated BP differences between individuals without and with moderate to severe sleep apnea are similar in magnitude to the reported differences in BP level after sleep apnea intervention with continuous positive airway pressure observed in clinical trials.60,61 In aggregate, these data support the growing consensus that sleep apnea contributes to elevations in BP and our findings quantify the average increase in SBP and DBP across a range of the AHI.
For DBP, we also identified a strong association between the PLMIA and elevations in BP. Our model estimated that for each 10-unit per hour increase in the number of PLMs associated with arousals, DBP was increased by 1.2 mm Hg. A similar association was observed for SBP, but with a wider standard error. This finding has potentially large implications for individuals with PLM disorder who may experience hundreds of limb movements per night, and also indicates that individuals with a lower frequency of nocturnal limb movements may have BP elevations. An adverse effect of PLMs on BP is supported by recent population and clinical research. PLMs are associated with bursts of sympathetic activity, increased heart rate, and acute surges in BP,23 which may provide a basis for sustained daytime hypertension. PLMs with arousals are also more likely to disturb sleep quality than are leg movements unassociated with arousals.62 The finding of a stronger association between BP and PLMs associated with arousals compared to all PLMs is similar to the strong association observed for the PLMIA with peripheral vascular disease in the Outcomes of Sleep Disorders in Older Men (MrOS) Study.63
PLMS also may co-occur with restless legs syndrome, which has been associated with an increased odds ratio for hypertension in the Nurse's Health Study II.64 Our findings, based on a rigorous assessment of sleep disturbances across five domains, indicate that measurement of leg movement frequency may be important in understanding vascular risk.
Identifying the best predictors of hypertension in sleep-monitoring data is challenging because of multiple interacting physiological pathways that result in correlated physiological signals. Prior research has compared selective sleep measures. In the Sleep Heart Health Study, cross-validation procedures implemented to identify PSG predictors of BP produced less consistent results compared with the current study, possibly because of differences in modeling and the adjustment procedures for BP medications.65 Sulit et al.66 identified the arousal index as a stronger predictor of hypertension than AHI in 394 subjects in the Cleveland Family Study (CFS). Study differences may relate to the consideration of a dichotomous hyper-tension outcome of because of the younger age in the CFS.
Although the AHI has been criticized because of the limitations of a “count” in quantifying sleep disturbances, the current findings suggest that after AHI is considered other measures of hypoxemia and sleep fragmentation may not appreciably improve the prediction of BP. This may be because the AHI reflects influences relates to changes in inspiratory effort, pleural pressure swings, oxygen saturation, and sleep fragmentation that together may contribute to changes in BP level.
We faced several data analysis challenges related to the number of sleep exposures of interest and their known inter-correlations. We addressed this by first identifying variables that represent five classes of sleep disturbances and then applied a systematic variable selection approach which avoided overfitting of highly correlated measures. For data reduction, we chose the variable clustering method instead of principal component analysis or factor analysis because of the ability to easily interpret individual variables that each represented a cluster of correlated indices. Furthermore, the use of a cross-validated model building strategy provided an objective way to select statistical models, reducing the chance of identifying spurious or nonreplicable associations. In addition, we used a sophisticated approach for imputing BP level in individuals on medications, which accounts for additional uncertainty associated with imputing unobserved blood pressure values compared to an alternative strategy of adding a constant to the BP values. These statistical approaches may be adapted to future studies that share some of these challenges related to multiple correlated variables or to interest in modeling continuous outcomes that can be affected by medication use.
The study strengths include the analysis of highly standardized data with available longitudinal data, enabling imputation of BP levels. The cohort provided a broad ethnic representation. The sleep data were both comprehensive and rigorously analyzed. Well-delineated statistical methods provided a systematic methodology for selecting candidate sleep exposures; the cross-validation technique reduced the likelihood that the models are spurious or over fitted.
There are also several study limitations. The cross-sectional analysis limits causal inferences. Although consistent with the goal of generating clinically interpretable models, it is possible that in the process of reducing the dataset to 32 candidate variables, several predictive variables may have been missed. Further application of the cluster analysis technique in other cohort studies is warranted to better understand the generaliz-ability of our findings, including sensitivity to population and measurement differences. As with any imputation-based approaches, the accuracy of imputed blood pressure values relies on the underlying assumptions. The key assumption of treating the last pretreatment value as the first unobserved untreated value posttreatment appeared to be reasonable because the imputation model was built based on the subset of new drug users whose last pretreatment value and first unobserved untreated values posttreatment are not too far apart in time.
In summary, this study found that AHI and limb movements with arousals to be consistently associated with elevations in BP. The estimated effects for individuals with frequent breathing disturbances or limb movements are in the range considered clinically significant. Furthermore, our results supported a commonly used definition for the AHI. Although linking hypopneas with arousals did not strengthen the association between AHI and BP, linking arousals to limb movements did result in a PLM index that was strongly associated with DBP. Thus, future PSG montages may benefit from including sensors that allow reliable derivation of both the AHI as well as the PLMIA. Last, out findings suggests that PLMIA may be an addressable risk for hypertension, which warrants future study.
DISCLOSURE STATEMENT
This was not an industry supported study. Dr. Redline has received research grants from ResMed Inc. and ResMed foundation and equipment for research from Philips-Respironics and ResMed. The other authors have indicated no financial conflicts of interest.
The Multi-Ethnic Study of Atherosclerosis (MESA) is supported by contracts N01-HC-95159 through N01-HC-95169 from the National Heart, Lung, and Blood Institute (NHLBI) at the National Institutes of Health. The work presented in this paper was funded by: NIH 1R01HL083075-01, R01HL098433, R01 HL098433-02S1, 1U34HL105277-01, 1R01HL110068-01A1 1R01HL113338-01, R21 HL108226, P20 NS076965, and R01 HL109493; and a research agreement with the Emma B. Bradley Hospital/Brown University funded by the Periodic Breathing Foundation.
ACKNOWLEDGMENTS
This manuscript has been reviewed by the MESA Investigators for scientific content and consistency of data interpretation with previous MESA publications and significant comments have been incorporated before submission for publication. The authors thank the other investigators, staff, and participants of the MESA and MESA-Lung Studies for their valuable contributions. A full list of participating MESA Investigators and institutions can be found at http://www.mesa-nhlbi.org.
Author contributions: Dr. Dean, developed analysis procedure, analyzed data, drafted manuscript; Dr. Wang, developed statistical analysis procedure, manuscript preparation; Dr. Jacobs, manuscript preparation; Dr. Duprez, manuscript preparation; Dr. Punjabi, data collection and study design, manuscript preparation; Dr. Zee, data collection and study design, manuscript preparation; Dr. Shea, data collection and study design, manuscript preparation; Dr. Watson, data collection and study design, manuscript preparation; Dr. Redline, designed study, developed analysis procedure, and manuscript preparation.
SUPPLEMENTAL MATERIAL
Sleep exposure Spearman rank correlation coefficients for arousals.
Sleep exposure Spearman rank correlation coefficients breathing disturbances I.
Sleep exposure Spearman rank correlation coefficients for breathing disturbances II.
Sleep exposure Spearman rank correlation coefficients for hypoxemia.
Sleep exposure Spearman rank correlation coefficients for limb movements.
Sleep exposure Spearman rank correlation coefficients for sleep structure.
Characteristics of Multi-Ethnic Study of Atherosclerosis sleep participants with MESA exam 5 subjects not studied.
Blood pressure models, predictor mean and between-imputation variance for 10 imputed blood pressure datasets.
Comparison of systolic blood pressure models when adjusting for blood pressure medication with imputed blood pressure values and with blood pressure adjusted with a constant.
Comparison of diastolic blood pressure models when adjusting for blood pressure medication with imputed blood pressure values and with blood pressure adjusted with a constant.
Systolic blood pressure model further adjusted for diabetes, congestive heart failure, and cardiovascular disease.
Diastolic blood pressure model further adjusted for diabetes, congestive heart failure, and cardiovascular disease.
REFERENCES
- 1.James PA, Oparil S, Carter BL, et al. 2014 Evidence-based guideline for the management of high blood pressure in adults: report from the panel members appointed to the eight joint national committee (JNC 8) JAMA. 2014;310:E1–14. doi: 10.1001/jama.2013.284427. [DOI] [PubMed] [Google Scholar]
- 2.Mancia G, Fagard R, Narkiewicz K, et al. 2013 ESH/ESC guidelines for the management of arterial hypertension. Eur Heart J. 2013;32:2–72. [Google Scholar]
- 3.Roger VL, Go AS, Loyd-Jones DM, et al. Heart disease and stroke statistics-2012 update: a report from the American Heart Association. Circulation. 2012;125:e2–220. doi: 10.1161/CIR.0b013e31823ac046. [DOI] [PMC free article] [PubMed] [Google Scholar]
- 4.Basu S, Millet C. Social epidemiology of hypertension in middle-income countries: determinants of prevalence, diagnosis, treatment, and control ion the WHO SAGE Study. Hypertension. 2013;62:1–86. doi: 10.1161/HYPERTENSIONAHA.113.01374. [DOI] [PubMed] [Google Scholar]
- 5.Weber MA. Hypertension: a companion to Brenner and Rector's The Kidney. Philadelphia, PA: W.B. Saunders Company; 2000. [Google Scholar]
- 6.Chobanian AV, Bakris GL, Black HR, et al. Seventh report on the joint national committee on prevention, detection, evaluation, and treatment of high blood pressure. Hypertension. 2003;42:1206–52. doi: 10.1161/01.HYP.0000107251.49515.c2. [DOI] [PubMed] [Google Scholar]
- 7.Archbold KH, Vasquez MM, Goodwin JL, Quan SF. Effects of sleep patterns and obesity on increases in blood Pressure in a 5-year period: report from the Tuscon Children's Assessment of Sleep Apnea Study. J Pediatr. 2012;161:26–30. doi: 10.1016/j.jpeds.2011.12.034. [DOI] [PMC free article] [PubMed] [Google Scholar]
- 8.Haas DC, Foster GL, Nieto FJ, et al. Age-dependent association between sleep-disordered breathing and hypertension: importance of discriminating between systolic/diastolic hypertension and isolated systolic hypertension in the Sleep Heart Health Study. Circulation. 2005;111:614–21. doi: 10.1161/01.CIR.0000154540.62381.CF. [DOI] [PubMed] [Google Scholar]
- 9.Narkiewicz K, Montano N, Cogliati C, van de Borne PJH, Dyken ME, Somers VK. Altered cardiovascular variability in obstructive sleep apnea. Circulation. 1998;98:1071–7. doi: 10.1161/01.cir.98.11.1071. [DOI] [PubMed] [Google Scholar]
- 10.Wolf J, Hering D, Narkiewwicz K. Non-dipping pattern of hypertension and obstructive sleep apnea syndrome. Hypertens Res. 2010;33:867–71. doi: 10.1038/hr.2010.153. [DOI] [PubMed] [Google Scholar]
- 11.Hinderliter AL. Reproducibility of blood pressure dipping: relation to day-to-day variability in sleep quality. J Am Soc Hypertens. 2013;7:432–9. doi: 10.1016/j.jash.2013.06.001. [DOI] [PMC free article] [PubMed] [Google Scholar]
- 12.Brooks D, Horner RL, Kozar LF, Render-Teixeira CL, Phillipson EA. Obstructive sleep apnea as a cause of systemic hypertension. Evidence from a canine model. J Clin Invest. 1997;99:106–9. doi: 10.1172/JCI119120. [DOI] [PMC free article] [PubMed] [Google Scholar]
- 13.Tasali E, Leproult R, Ehrmann DA, Van Cauter E. Slow-wave sleep and the risk of type 2 diabetes in humans. Proc Natl Acad Sci. 2008;105:1044–9. doi: 10.1073/pnas.0706446105. [DOI] [PMC free article] [PubMed] [Google Scholar]
- 14.Sauvet F, Leftheriotis G, Gomez-Merino D, et al. Effect of acute sleep deprivation on vascular function in healthy subjects. J Appl Physiol. 2010;108:68–75. doi: 10.1152/japplphysiol.00851.2009. [DOI] [PubMed] [Google Scholar]
- 15.Hla KM, Young T, Finn L, Peppard P, Szklo-Coxe M, Stubbs M. Logitudinal assoication of sleep-disordered breathing and nondipping of nocturnal blood pressure in the Wisconsin Sleep Cohort Study. Sleep. 2008;31:795–800. doi: 10.1093/sleep/31.6.795. [DOI] [PMC free article] [PubMed] [Google Scholar]
- 16.Peppard PE, Young T, Palta M, Skatrud J. Prospective study of the association between sleep-disordered breathing and hypertension. N Engl J Med. 2000;342:1378–84. doi: 10.1056/NEJM200005113421901. [DOI] [PubMed] [Google Scholar]
- 17.Gutierrez-Misis A, Sanchez-Santos MT, Banegas JR, Zunzunequi MV, Castell MV, Otero A. Prevalence and incidence of hypertension in a population cohort of people aged 65 years or older in Spain. J Hypertens. 2011;29:1863–70. doi: 10.1097/HJH.0b013e32834ab497. [DOI] [PubMed] [Google Scholar]
- 18.Peralta CA, Adeney KL, Shipak MG, et al. Structural and functional vascular alterations and incident hypertension in normotensive adults: the Multi-Ethnic Study of Atherosclerosis. Am J Epidemiol. 2010;171:63–71. doi: 10.1093/aje/kwp319. [DOI] [PMC free article] [PubMed] [Google Scholar]
- 19.Roche F, Pepin J-L, Achour-Crawford E, et al. At 68 years, unrecognized sleep apnoea is associated with elevated ambulatory blood pressure. Eur Respir J. 2012;3:649–56. doi: 10.1183/09031936.00162710. [DOI] [PubMed] [Google Scholar]
- 20.Punjabi NM, Newman AB, Young TB, Resnick HE, Sanders MH. Sleep-disordered breathing and cardiovascular disease: an outcome-based definition of hypopneas. Am J Respir Crit Care Med. 2008;177:1150–5. doi: 10.1164/rccm.200712-1884OC. [DOI] [PMC free article] [PubMed] [Google Scholar]
- 21.Young T. Rationale, design and findings from the Wisconsin Sleep Cohort Study: toward understanding the total societal burden of sleep disordered breathing. Sleep Med Clin. 2009;4:37–46. doi: 10.1016/j.jsmc.2008.11.003. [DOI] [PMC free article] [PubMed] [Google Scholar]
- 22.Walters AS, LeBrocq C, Dhar A, et al. Validation of the International Restless Limbs Syndrome Study Group rating scale for restless limbs syndrome. Sleep Med. 2003;4:121–32. doi: 10.1016/s1389-9457(02)00258-7. [DOI] [PubMed] [Google Scholar]
- 23.Allena M, Campus C, Morrone E, et al. Periodic limb movements both in NREM and REM sleep: relationship between cerebral and autonomic activities. Clin Neurophysiol. 2009;120:1282–90. doi: 10.1016/j.clinph.2009.04.021. [DOI] [PubMed] [Google Scholar]
- 24.Scofield H, Roth T, Drake CL. Periodic limb movements during sleep: population prevalence, clinical correlates, and racial differences. Sleep. 2008;31:1221–7. [PMC free article] [PubMed] [Google Scholar]
- 25.Ancoli-Israel S, Kripke DF, Klauber MR, Mason WJ, Fell R, Kaplan O. Periodic limb movement in sleep in community-dwelling elderly. Sleep. 1991;14:496–500. doi: 10.1093/sleep/14.6.496. [DOI] [PubMed] [Google Scholar]
- 26.Pennestri MH, Montplasisir J, Colombo R. Nocturnal blood pressure changes in patients with restless limb syndrome. Neurology. 2007;68:1213–8. doi: 10.1212/01.wnl.0000259036.89411.52. [DOI] [PubMed] [Google Scholar]
- 27.Mesas AE, Lopez-Garcia E, Leon-Munoz LM, Guallar-Castillon P, Rodriguez-Artalejo F. Sleep duration and mortality according to health status in older adults. J Am Geriatr Soc. 2010;58:1870–7. doi: 10.1111/j.1532-5415.2010.03071.x. [DOI] [PubMed] [Google Scholar]
- 28.Sabanayagam C, Shankar A. Sleep duration and cardiovascular disease: results from the National Health Interview Survey. Sleep. 2009;33:1037–42. doi: 10.1093/sleep/33.8.1037. [DOI] [PMC free article] [PubMed] [Google Scholar]
- 29.Gottlieb DJ, Redline S, Nieto FJ, et al. Association of usual sleep duration with hypertension: the Sleep Heart Health Study. Sleep. 2006;29:1009–14. doi: 10.1093/sleep/29.8.1009. [DOI] [PubMed] [Google Scholar]
- 30.Fung MM, Peters K, Redline S, et al. Decreased slow wave sleep increases risk of developing hypertension in elderly men. Hypertension. 2011;58:596–603. doi: 10.1161/HYPERTENSIONAHA.111.174409. [DOI] [PMC free article] [PubMed] [Google Scholar]
- 31.Bild DE, Bluemke DA, Burke GL, et al. Multi-Ethnic Study of Atherosclerosis: objective and design. Am J Epidemiol. 2002;156:871–81. doi: 10.1093/aje/kwf113. [DOI] [PubMed] [Google Scholar]
- 32.Lutsey PL, Pereira MA, Bertoni AG, Kandula NR, Jacobs D., Jr Interactions between race/ethnicity and anthropometry in risk of incident diabetes: the Multi-Ethnic Study of Atherosclerosis. Am J Epidemiol. 2010;172:197–204. doi: 10.1093/aje/kwq100. [DOI] [PMC free article] [PubMed] [Google Scholar]
- 33.Sorlie PD, Aviles-Santa LM, Wassertheil-Smoller S, et al. Design and implementation of the Hispanic Community Health Study/Study of Latinos. Ann Epidemiol. 2010;20:629–41. doi: 10.1016/j.annepidem.2010.03.015. [DOI] [PMC free article] [PubMed] [Google Scholar]
- 34.Levine DW, Kripke DF, Kaplan RM, et al. Reliability and validity of the Women's Health Initiative Insomnia Rating Scale. Psychol Assess. 2003;15:137–48. doi: 10.1037/1040-3590.15.2.137. [DOI] [PubMed] [Google Scholar]
- 35.Quan SF, Howard BT, Iber C, et al. The Sleep Heart Health Study: design, rationale, and methods. Sleep. 1997;20:1077–85. [PubMed] [Google Scholar]
- 36.Zavada A, Gordijn MC, Beersma DG, Daan S, Roenneberg T. Comparison of the Munich Chronotype Questionnarie witht he Horne-Ostberg's Morningness-Eveningness Score. Chronobiol Int. 2005;22:267–8. doi: 10.1081/cbi-200053536. [DOI] [PubMed] [Google Scholar]
- 37.Spielberger CD, Gorsuch RL, Lushene R, Vagg PR, Jacobs GA. Manual for the State-Trait Anxiety Inventory. Palo Alto, CA: Consulting Psychologists Press; 1983. [Google Scholar]
- 38.Rechtschaffen A, Kales A. National Institutes of Health; 1968. A manual of standardized terminology, techniques and scoring system for sleep stages of human subjects. [DOI] [PubMed] [Google Scholar]
- 39.Whitney CW, Gottlieb DJ, Redline S, et al. Reliability of scoring respiratory distrubance indices and sleep staging. Sleep. 1998;21:749–57. doi: 10.1093/sleep/21.7.749. [DOI] [PubMed] [Google Scholar]
- 40.Redline S, Sanders MH, Lind BK, et al. Methods for obtaining and analyzing unattended polysomnography data for a multicenter study. Sleep Heart Health Research Group. Sleep. 1998;21:759–67. [PubMed] [Google Scholar]
- 41.Iber C, Ancoli-Israel S, Chesson AL, Jr., Quan SF. The AASM manual for the scoring of sleep and associated events. Westchester, IL: American Academy of Sleep Medicine; 2007. [Google Scholar]
- 42.McClelland. R.L., Kronmal RA, Haesslaer J, Blumenthal RS, Goff DC., Jr Estimation of risk factor associations when the response is influenced by medication use: an imputation approach. Stat Med. 2008;27:5039–53. doi: 10.1002/sim.3341. [DOI] [PMC free article] [PubMed] [Google Scholar]
- 43.McClelland RL, Jorgensen NW, Post WS, Szklo M, Kronmal RA. Methods for estimation of disparities in medication use in an observational cohort study: results from the Multi-Ethnic Study of Atherosclerosis. Pharmacoepidemiol Drug Saf. 2013;22:533–41. doi: 10.1002/pds.3406. [DOI] [PMC free article] [PubMed] [Google Scholar]
- 44.Rubin DB. Multiple imputation for nonresponse in surveys. John Wiley & Sons; 1987. [Google Scholar]
- 45.Wellons M, Ouyang P, Schreiner PJ, Herrington DM, Vaidya D. Early menopause predicts future coronary heart disease and stroke: the Multi-Ethnic Study of Atherosclerosis (MESA) Menopause. 2012;19:1081–7. doi: 10.1097/gme.0b013e3182517bd0. [DOI] [PMC free article] [PubMed] [Google Scholar]
- 46.Kandula NR, Diez-Roux AV, Chan C, et al. Association of acculturation levels and prevalence of diabetes in the multi-ethnic study of atherosclerosis (MESA) Diabetes Care. 2008;31:1621–8. doi: 10.2337/dc07-2182. [DOI] [PMC free article] [PubMed] [Google Scholar]
- 47.The Expert Committe on the Diagnosis and Classification of Diabetes Mellitus. Report of the expert committee on the diagnosis and classification of diabetes mellitus. Diabetes Care. 2003;26:S5–20. doi: 10.2337/diacare.26.2007.s5. [DOI] [PubMed] [Google Scholar]
- 48.Bahrami H, Kronmal R, Bluemke DA, et al. Differences in the incidence of congestive heart failure by ethnicity: the Multi-Ethnic Study of Atherosclerosis. Arch Intern Med. 2008;168:2138–45. doi: 10.1001/archinte.168.19.2138. [DOI] [PMC free article] [PubMed] [Google Scholar]
- 49.Anderberg MR. Cluster analysis for applications. Academic Press; 1973. [Google Scholar]
- 50.Nelson BD. Variable reduction for modeling using PROC VARCLUS. SAS User's Group International Conference. 261.26.1–.26.3. [Google Scholar]
- 51.SAS. The VARCLUS procedure. SAS online documentation, version 8. 2012:3591–621. [Google Scholar]
- 52.Haste T, Tibshirani R, Friedman J. The elements of statistical learning: data mining, inference and prediction. 2nd ed. New York: Springer; 2009. [Google Scholar]
- 53.Rubin DB. Multiple imputation for nonresponse in surveys. New York: John Wiley & Sons; 1987. [Google Scholar]
- 54.Nadaraya EA. On estimating regression. Theory Probab Appl. 1964;9:141–2. [Google Scholar]
- 55.Watson GS. Smooth regression analysis. Ind J Stat. 1964;26:359–72. [Google Scholar]
- 56.Sharhar E, Whitney CW, Redline S, et al. Sleep-disordered breathing and cardiovascular disease: cross-sectional results of the Sleep Heart Health Study. Am J Respir Crit Care Med. 2001;163:19–25. doi: 10.1164/ajrccm.163.1.2001008. [DOI] [PubMed] [Google Scholar]
- 57.Nieto EJ, Young TB, Lind BK, et al. Association of sleep-disordered breathing, sleep apnea, and hypertension in a large community based study. JAMA. 2000;283:1829–36. doi: 10.1001/jama.283.14.1829. [DOI] [PubMed] [Google Scholar]
- 58.Mehra R, Stone KL, Blackwekk T, et al. Prevalence and correlates of sleep-disordered breathing in older men: Osteoporotic Fractures in Men Sleep Study. J Am Geriatr Soc. 2007;55:1356–64. doi: 10.1111/j.1532-5415.2007.01290.x. [DOI] [PMC free article] [PubMed] [Google Scholar]
- 59.Shahar E, Whitney CW, Redline S, et al. Sleep-disordered breathing and cardiovascular disease: cross-sectional results of the Sleep Heart Health Study. Am J Respir Crit Care Med. 2001;163:19–25. doi: 10.1164/ajrccm.163.1.2001008. [DOI] [PubMed] [Google Scholar]
- 60.Martinez-Garcia M-A, Capote F, Campos-Rodriguez F, et al. Effect of CPAP on blood pressure in patients with obstructive sleep apnea and resistant hypertension: the HIPARCO Randomized Clinical Trial. JAMA. 2013;310:2407–15. doi: 10.1001/jama.2013.281250. [DOI] [PubMed] [Google Scholar]
- 61.Dimsdale JE, Loredo JS, Profant J. Effect of continuous positive pressure on blood pressure: a placebo trial. Hypertension. 2000;35:144–7. doi: 10.1161/01.hyp.35.1.144. [DOI] [PubMed] [Google Scholar]
- 62.Claman DM, Ewing SK, Redline S, Ancoli-Israel S, Cauley JA, Stone KL. Periodic leg movements associated with reduced sleep quality in older men: the MrOs Sleep Study. J Clin Sleep Med. 2013;9:1109–17. doi: 10.5664/jcsm.3146. [DOI] [PMC free article] [PubMed] [Google Scholar]
- 63.Koo BB, Blackwell T, Ancoli-Israel S, Stone KL, Stefanick ML, Redline S. Association of incident cardiovasccular disease with periodic limb movements during sleep in older men: Outcomes of Sleep Disorders in Older Men (MrOS) Study. Circulation. 2011;124:1223–31. doi: 10.1161/CIRCULATIONAHA.111.038968. [DOI] [PMC free article] [PubMed] [Google Scholar]
- 64.Batool-Anwar S, Malhotra A, Forman J, Winkelman J, Li Y, Gao X. Restless limbs syndrome and hypertension in middle-aged women. Hypertension. 2011;58:791–6. doi: 10.1161/HYPERTENSIONAHA.111.174037. [DOI] [PMC free article] [PubMed] [Google Scholar]
- 65.Redline S, Min NI, Shahar E, Rapoport D, O'Connor G. Polysomnographic predictors of blood pressure and hypertension: is one index best? Sleep. 2005;28:1122–30. doi: 10.1093/sleep/28.9.1122. [DOI] [PubMed] [Google Scholar]
- 66.Sulit L, Storfer-Isser A, Lester-Kirchner H, Redline S. Differences in polysomnography predictors for hypertension and imparied glucose. Sleep. 2006;29:777–83. doi: 10.1093/sleep/29.6.777. [DOI] [PubMed] [Google Scholar]
Associated Data
This section collects any data citations, data availability statements, or supplementary materials included in this article.
Supplementary Materials
Sleep exposure Spearman rank correlation coefficients for arousals.
Sleep exposure Spearman rank correlation coefficients breathing disturbances I.
Sleep exposure Spearman rank correlation coefficients for breathing disturbances II.
Sleep exposure Spearman rank correlation coefficients for hypoxemia.
Sleep exposure Spearman rank correlation coefficients for limb movements.
Sleep exposure Spearman rank correlation coefficients for sleep structure.
Characteristics of Multi-Ethnic Study of Atherosclerosis sleep participants with MESA exam 5 subjects not studied.
Blood pressure models, predictor mean and between-imputation variance for 10 imputed blood pressure datasets.
Comparison of systolic blood pressure models when adjusting for blood pressure medication with imputed blood pressure values and with blood pressure adjusted with a constant.
Comparison of diastolic blood pressure models when adjusting for blood pressure medication with imputed blood pressure values and with blood pressure adjusted with a constant.
Systolic blood pressure model further adjusted for diabetes, congestive heart failure, and cardiovascular disease.
Diastolic blood pressure model further adjusted for diabetes, congestive heart failure, and cardiovascular disease.